2025 NAKA Price Prediction: Analyzing Market Trends and Future Growth Potential for Nakamoto Games Token

Introduction: Market Position and Investment Value of NAKA
Nakamoto Games (NAKA) is a Web3 infrastructure layer designed to redefine the Web3 gaming landscape. Since its inception in 2021, the project has established itself as a multifaceted gaming platform where the NAKA token serves as a critical utility asset for ecosystem participation and access. As of December 2025, NAKA boasts a fully diluted market valuation of approximately $13.11 million, with a circulating supply of around 64.98 million tokens trading at approximately $0.0728. This token, recognized as the "core heartbeat" of the Nakamoto Games ecosystem, plays an essential role in Web3 gaming infrastructure and community engagement.
This article will provide a comprehensive analysis of NAKA's price trends and market dynamics, incorporating historical price action, market supply and demand factors, ecosystem development, and macroeconomic considerations to deliver professional price forecasts and actionable investment strategies for the 2025-2030 period.
Nakamoto Games (NAKA) Market Analysis Report
I. NAKA Price History Review and Current Market Status
NAKA Historical Price Evolution
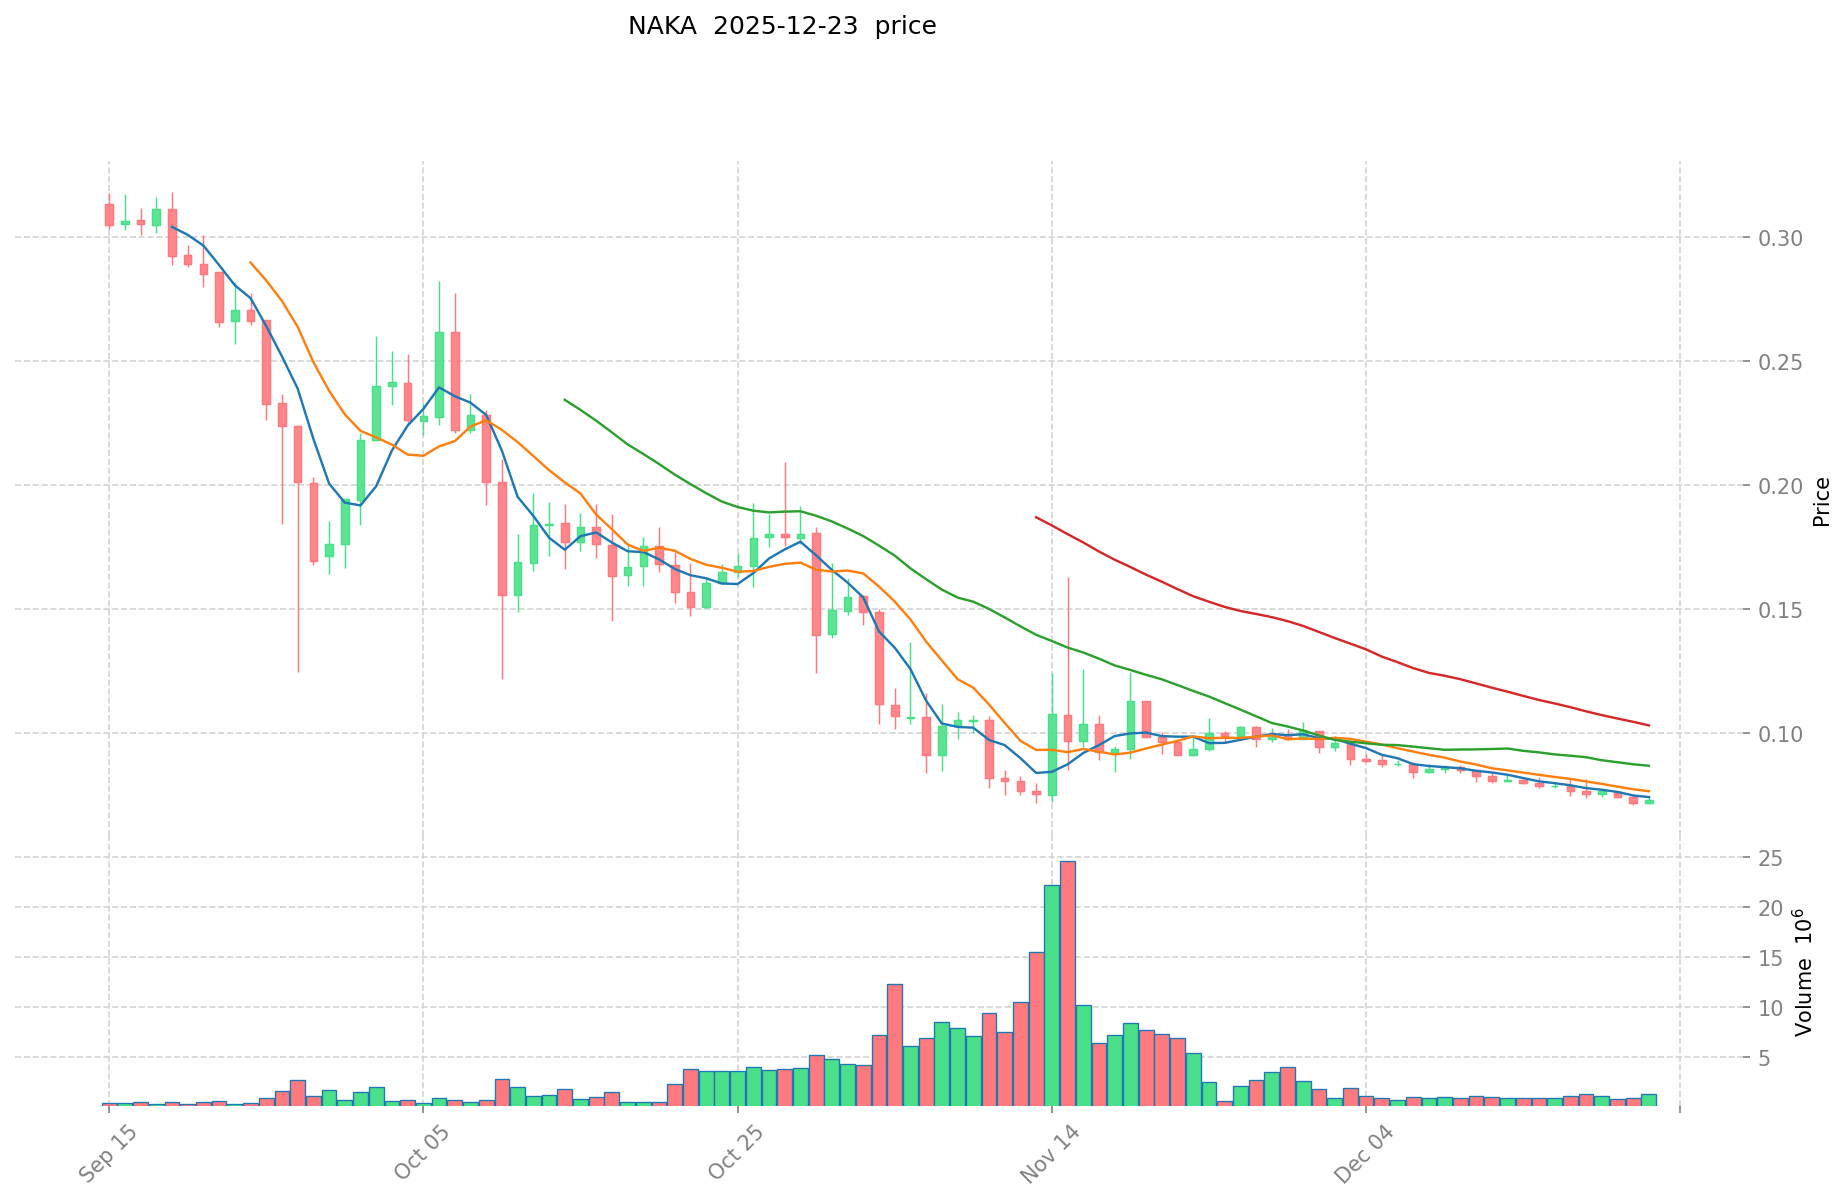
- October 2021: NAKA token launched at an initial price of $0.18, marking the beginning of the project's market presence.
- March 2024: NAKA reached its all-time high (ATH) of $3.2721 on March 10, 2024, representing peak market sentiment and investor confidence in the project.
- December 2025: NAKA declined significantly to an all-time low (ATL) of $0.07093 on December 21, 2025, reflecting a substantial long-term depreciation of approximately 92.72% from the previous year's level.
NAKA Current Market Position
As of December 23, 2025, NAKA is trading at $0.07281, representing a marginal recovery of approximately 0.26% from its recent low. The token exhibits concerning short-term performance metrics: a 24-hour decline of -1.96%, a 7-day decline of -8.93%, and a 30-day decline of -23.04%. On an intraday basis, NAKA has experienced a minor pullback of -0.89% over the past hour.
The token's market capitalization stands at approximately $4.73 million USD, with a fully diluted valuation of $13.11 million USD. The circulating supply consists of 64,984,277.5 NAKA tokens out of a total maximum supply of 180,000,000 tokens, indicating a circulation ratio of 36.10%. The 24-hour trading volume totals $94,578.20 USD across 15 trading venues, reflecting moderate liquidity conditions.
NAKA maintains a market rank of 1,559 among all cryptocurrencies, with a market dominance share of 0.00041%. The token currently holds approximately 29,172 token holders, indicating a distributed but relatively concentrated holder base.
Click to view current NAKA market price
NAKA Market Sentiment Indicator
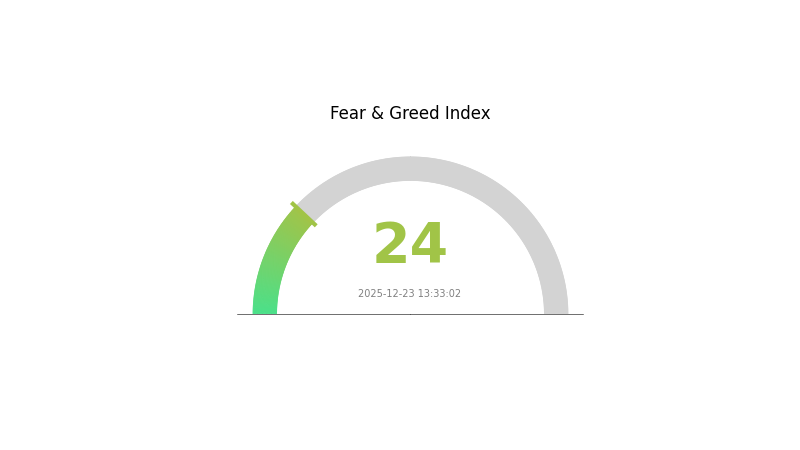
2025-12-23 Fear and Greed Index: 24 (Extreme Fear)
Click to view current Fear & Greed Index
The cryptocurrency market is currently experiencing extreme fear, with the Fear and Greed Index at 24. This indicates significant market pessimism and risk aversion among investors. During periods of extreme fear, asset prices typically face substantial downward pressure as panic selling dominates trading activity. However, contrarian investors often view such conditions as potential buying opportunities, as oversold conditions may create favorable entry points. Market participants should exercise caution and conduct thorough research before making investment decisions. Risk management remains crucial in volatile market environments.
NAKA Holdings Distribution
The address holdings distribution map illustrates the concentration of NAKA tokens across blockchain addresses, serving as a critical indicator of token ownership structure and potential market dynamics. This metric reveals how tokens are distributed among the top holders versus the broader market participants, providing insights into decentralization levels and vulnerability to coordinated selling pressure.
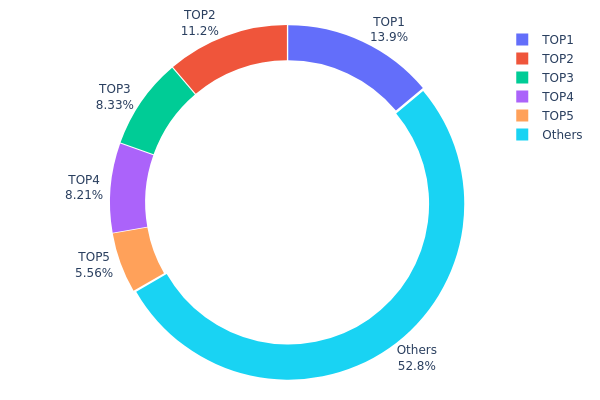
Current analysis of NAKA's holdings distribution reveals moderate concentration risk. The top five addresses collectively control approximately 47.18% of total token supply, with the largest holder commanding 13.88% and the second-largest holding 11.22%. While this concentration level does not indicate extreme centralization, the cumulative weight of the top addresses warrants attention. Notably, the remaining addresses account for 52.82% of holdings, suggesting that more than half the token supply remains distributed among a broader set of participants, which provides some diversification buffer.
The current address distribution structure presents mixed implications for market stability. The presence of five substantial stakeholders holding between 5.55% and 13.88% each creates potential for significant price volatility if these positions are liquidated rapidly or coordinated in trading activity. However, the healthy percentage of tokens held by "others" indicates meaningful decentralization that could mitigate extreme price manipulation scenarios. The overall structure reflects a market in transition toward wider distribution, though continued monitoring of the top holders' activity remains essential for assessing future price stability and on-chain governance dynamics.
Visit NAKA Holdings Distribution on Gate.com for real-time updates.
| Top | Address | Holding Qty | Holding (%) |
|---|---|---|---|
| 1 | 0xe162...7fdd1a | 25000.00K | 13.88% |
| 2 | 0x3d4a...944147 | 20200.00K | 11.22% |
| 3 | 0xd637...88995e | 15000.00K | 8.33% |
| 4 | 0x2933...fa4625 | 14772.45K | 8.20% |
| 5 | 0x2233...dc734f | 10000.00K | 5.55% |
| - | Others | 95027.55K | 52.82% |
II. Core Factors Influencing NAKA's Future Price
Institutional and Major Holder Dynamics
-
Institutional Holdings: KindlyMD (NAKA), a Bitcoin treasury company, holds digital assets as its core business model. However, the company has faced significant market challenges, with its market-to-NAV (mNAV) ratio falling below 0.4x, indicating the stock is trading at a substantial discount to its book asset value. This reflects market skepticism regarding the company's capital structure and continued operational viability.
-
Capital Market Pressures: NAKA received a minimum stock price compliance notification from NASDAQ, which typically triggers financing discounts, liquidity contraction, and valuation repricing. The company also announced PIPE (private investment in public equity) share unlocking, which contributed to sharp stock price declines as previously discounted shares entered circulation.
-
Industry Positioning Challenge: Among approximately 100 Bitcoin treasury companies tracked, approximately 65% are holding Bitcoin purchased at prices above current market levels, experiencing significant unrealized losses. This industry-wide headwind creates additional selling pressure during market downturns.
Macroeconomic Environment
-
Monetary Policy Impact: As of December 2024, the US Federal Reserve has a 77.9% probability of maintaining interest rates unchanged in January 2025, with only a 22.1% probability of a 25-basis-point rate cut. The European Central Bank has maintained deposit facility rates, main refinancing rates, and marginal lending rates at 2.00%, 2.15%, and 2.40% respectively. This tighter monetary environment increases opportunity costs for holding non-yielding digital assets.
-
Inflation Outlook: The eurozone is expected to experience inflation rates of 1.9% in 2026 and 1.8% in 2027, remaining below the 2% target, before rising to 2.0% in 2028. This disinflationary backdrop reduces the inflation-hedge appeal that typically supports digital asset valuations.
III. NAKA Price Forecast for 2025-2030
2025 Outlook
- Conservative Forecast: $0.06334 - $0.07281
- Base Case Forecast: $0.07281
- Optimistic Forecast: $0.08737 (requires sustained market momentum and positive ecosystem developments)
2026-2028 Medium-term Perspective
- Market Stage Expectation: Gradual recovery and consolidation phase with incremental growth trajectory
- Price Range Predictions:
- 2026: $0.04966 - $0.10172 (10% potential upside)
- 2027: $0.06181 - $0.13545 (24% potential upside)
- 2028: $0.0962 - $0.14826 (55% potential upside)
- Key Catalysts: Enhanced protocol adoption, ecosystem expansion, improved market liquidity on platforms like Gate.com, and broader cryptocurrency market recovery
2029-2030 Long-term Outlook
- Base Case Scenario: $0.08104 - $0.18823 by 2029 (79% potential appreciation from current levels)
- Optimistic Scenario: $0.12917 - $0.22326 by 2030 (119% potential upside, assumes sustained institutional interest and mainstream adoption acceleration)
- Transformative Scenario: Price extension beyond $0.22326 (contingent on breakthrough technological developments, major partnership announcements, and macroeconomic tailwinds favoring digital assets)
- Dec 23, 2025: NAKA trading at stabilization levels with consolidation pattern observed across major trading venues
| 年份 | 预测最高价 | 预测平均价格 | 预测最低价 | 涨跌幅 |
|---|---|---|---|---|
| 2025 | 0.08737 | 0.07281 | 0.06334 | 0 |
| 2026 | 0.10172 | 0.08009 | 0.04966 | 10 |
| 2027 | 0.13545 | 0.0909 | 0.06181 | 24 |
| 2028 | 0.14826 | 0.11317 | 0.0962 | 55 |
| 2029 | 0.18823 | 0.13072 | 0.08104 | 79 |
| 2030 | 0.22326 | 0.15947 | 0.12917 | 119 |
Nakamoto Games (NAKA) - Professional Investment Analysis Report
IV. NAKA Professional Investment Strategy and Risk Management
NAKA Investment Methodology
(1) Long-Term Holding Strategy
- Target Investors: Web3 gaming enthusiasts and infrastructure believers with medium to long-term horizons
- Operational Recommendations:
- Accumulate during market downturns when NAKA experiences significant price corrections, such as the current -92.72% annual decline
- Hold tokens for ecosystem participation and governance rights within the Nakamoto Games platform
- Reinvest ecosystem rewards and utility gains to compound holdings over 2-3 year periods
(2) Active Trading Strategy
- Technical Analysis Indicators:
- Support and Resistance Levels: Monitor the 24-hour low of $0.07157 as immediate support and $0.07479 as near-term resistance
- Volume Analysis: Track the 24-hour trading volume of $94,578.20 to identify breakout opportunities and liquidity conditions
- Wave Trading Key Points:
- Execute short-term trades during the 7-day window showing -8.93% decline for tactical entry positions
- Set take-profit targets at 5-10% gains given current low volatility and extreme valuation compression
NAKA Risk Management Framework
(1) Asset Allocation Principles
- Conservative Investors: 1-2% of total crypto portfolio allocation
- Active Investors: 3-5% of total crypto portfolio allocation
- Professional Investors: 5-10% of total crypto portfolio allocation, with hedging strategies
(2) Risk Hedging Solutions
- Dollar-Cost Averaging (DCA): Execute regular weekly or monthly purchases of NAKA regardless of price to reduce timing risk and volatility impact
- Diversification Strategy: Balance NAKA holdings with other Web3 infrastructure tokens to mitigate ecosystem-specific risks
(3) Secure Storage Solutions
- Self-Custody Wallets: Gate Web3 Wallet integration for secure, non-custodial NAKA storage with direct ecosystem access
- Exchange Custody: Maintain smaller trading positions on Gate.com for active trading and liquidity management
- Security Best Practices: Enable multi-factor authentication, use hardware wallet backups for large holdings, and never share private keys
V. NAKA Potential Risks and Challenges
NAKA Market Risk
- Extreme Valuation Decline: NAKA has experienced a catastrophic -92.72% decline over the past 12 months, from $0.18 initial launch price to current $0.07281, indicating severe market sentiment deterioration
- Liquidity Risk: With only $94,578.19 in 24-hour volume across 15 exchanges, NAKA faces significant slippage risk for large trades and limited exit liquidity
- Price Volatility Compression: The token trades at 36.1% of fully diluted valuation, suggesting potential further downside risk or recovery upside depending on adoption metrics
NAKA Regulatory Risk
- Gaming Industry Compliance: Web3 gaming tokens face evolving regulatory scrutiny in major jurisdictions regarding play-to-earn mechanics and token classification
- Blockchain Protocol Changes: Polygon network (ERC-20/Polygon) regulatory developments could impact NAKA token functionality and trading access
- Jurisdictional Restrictions: Gaming-related tokens may face geographic limitations in certain regions, affecting global trading accessibility
NAKA Technical Risk
- Smart Contract Risk: Potential vulnerabilities in the Nakamoto Games ecosystem smart contracts could compromise token security or platform functionality
- Blockchain Dependency: NAKA relies on Polygon network stability; network congestion or technical issues could affect transaction efficiency
- Token Economics Sustainability: The project's utility model depends on continuous game development and ecosystem growth to maintain token value
VI. Conclusion and Action Recommendations
NAKA Investment Value Assessment
Nakamoto Games presents a speculative Web3 gaming infrastructure opportunity with significant downside already realized. While the project offers an expansive ecosystem layer for Web3 games with genuine utility for platform participation, the -92.72% annual decline reflects major execution challenges and market skepticism. NAKA's current valuation compression (36.1% of FDV) provides potential upside asymmetry IF the project successfully delivers on its Web3 infrastructure promises, but this remains highly uncertain. The token's extreme price deterioration and liquidity constraints necessitate conservative position sizing and strict risk management protocols.
NAKA Investment Recommendations
✅ Beginners: Limit NAKA exposure to 1% of crypto portfolio maximum, focus on understanding the Nakamoto Games ecosystem before accumulating, and only participate through Gate.com with strict stop-loss orders
✅ Experienced Investors: Consider 3-5% allocation for portfolio diversification in Web3 gaming infrastructure; implement dollar-cost averaging to reduce entry risk; actively monitor on-chain metrics and game adoption rates
✅ Institutional Investors: Evaluate full ecosystem fundamentals and development roadmap before 5-10% strategic allocation; conduct thorough due diligence on smart contract audits and regulatory compliance; use hedging strategies through diversified exposure
NAKA Trading Participation Methods
- Exchange Trading: Execute NAKA trades directly on Gate.com with competitive liquidity and fee structures
- Ecosystem Participation: Stake NAKA tokens within the Nakamoto Games platform to earn rewards and access gaming features
- Strategic Accumulation: Build positions through regular purchases during continued market weakness, with clear entry and exit strategies
Cryptocurrency investment carries extreme risk. This report does not constitute investment advice. Investors must make decisions based on their individual risk tolerance and should consult professional financial advisors. Never invest funds you cannot afford to lose completely.
FAQ
Is NAKA stock a buy or sell?
NAKA is currently a buy. With a 14-day RSI of 63.516, the token shows strong technical momentum and favorable positioning for potential upside movement in the near term.
How high will Nak go?
Based on current market analysis, Nak is expected to reach approximately $0.5636 by 2030, with an average price forecast of $0.2852. Price movements depend on market adoption and overall ecosystem development.
Is Kadena worth investing?
Kadena demonstrates strong potential with solid technology fundamentals and positive price momentum. Its innovative blockchain infrastructure positions it well for long-term growth, making it an attractive investment opportunity for those seeking exposure to emerging Web3 projects.
Why is NAKA going up?
NAKA is experiencing an intraday surge driven by increased trading volume and strong market momentum. The significant price movement reflects growing investor interest and positive market sentiment toward the asset.
Share
Content
Introduction: Market Position and Investment Value of NAKA
I. NAKA Price History Review and Current Market Status
II. Core Factors Influencing NAKA's Future Price
III. NAKA Price Forecast for 2025-2030
IV. NAKA Professional Investment Strategy and Risk Management
V. NAKA Potential Risks and Challenges
VI. Conclusion and Action Recommendations
FAQ
How to Buy Cryptocurrency


Trending Cryptocurrencies


Is Gomble (GM) a good investment?: Analyzing the automaker's financial performance and future prospects

What is PCNT: Understanding Percentage Change and Its Applications in Data Analysis

Is Creo Engine (CREO) a good investment?: Analyzing the potential and risks of this blockchain gaming platform
Is BOSS FIGHTERS (BFTOKEN) a good investment?: Analyzing the Potential and Risks of this Gaming Cryptocurrency

Is Xterio (XTER) a good investment?: Analyzing the potential and risks of this emerging cryptocurrency

Is Heroes of Mavia (MAVIA) a good investment?: Analyzing the potential and risks of this blockchain-based strategy game token

How to Delete My Account

What is P2P Trading on a Leading Platform?

BTC Option Flows Explained, Why Bitcoin Above 93,000 Suggests a Bullish Start to 2026
Bitcoin Options Traders Eye USD $100,000 as Derivatives Signal Market Reset

What Is GLD ETF, Understanding Gold Price Exposure and Structure
