TDROP vs RUNE: A Comprehensive Comparison of Two Leading Blockchain Tokens and Their Market Performance
Introduction: TDROP vs RUNE Investment Comparison
In the cryptocurrency market, comparisons between TDROP and RUNE have always been a key consideration for investors. The two assets not only show significant differences in market capitalization rankings, application scenarios, and price performance, but also represent distinct positioning within the crypto asset landscape.
TDROP (ThetaDrop): Built on the Theta blockchain as a TNT-20 token, TDROP rewards activity on the ThetaDrop NFT Marketplace, provides decentralized governance for ThetaDrop, and rewards stakers with token incentives. It centers around the groundbreaking concept of NFT Liquidity Mining.
RUNE (THORChain): Launched in 2019, RUNE serves as the native token of THORChain ecosystem. It can be used to pay transaction fees, maintain liquidity, and function as block rewards, with token holders receiving dividends. THORChain is a highly optimized multi-chain that uses pBFT consensus to achieve sub-second block finality.
This article will comprehensively analyze the investment value comparison between TDROP and RUNE across historical price trends, supply mechanisms, market adoption, and technical ecosystems, while attempting to answer the question investors care most about:
"Which is the better buy right now?"
Comparative Analysis Report: ThetaDrop (TDROP) vs THORChain (RUNE)
I. Price History Comparison and Current Market Status
ThetaDrop (TDROP) and THORChain (RUNE) Historical Price Trends
ThetaDrop (TDROP):
- All-time high: $0.061086 (February 18, 2022)
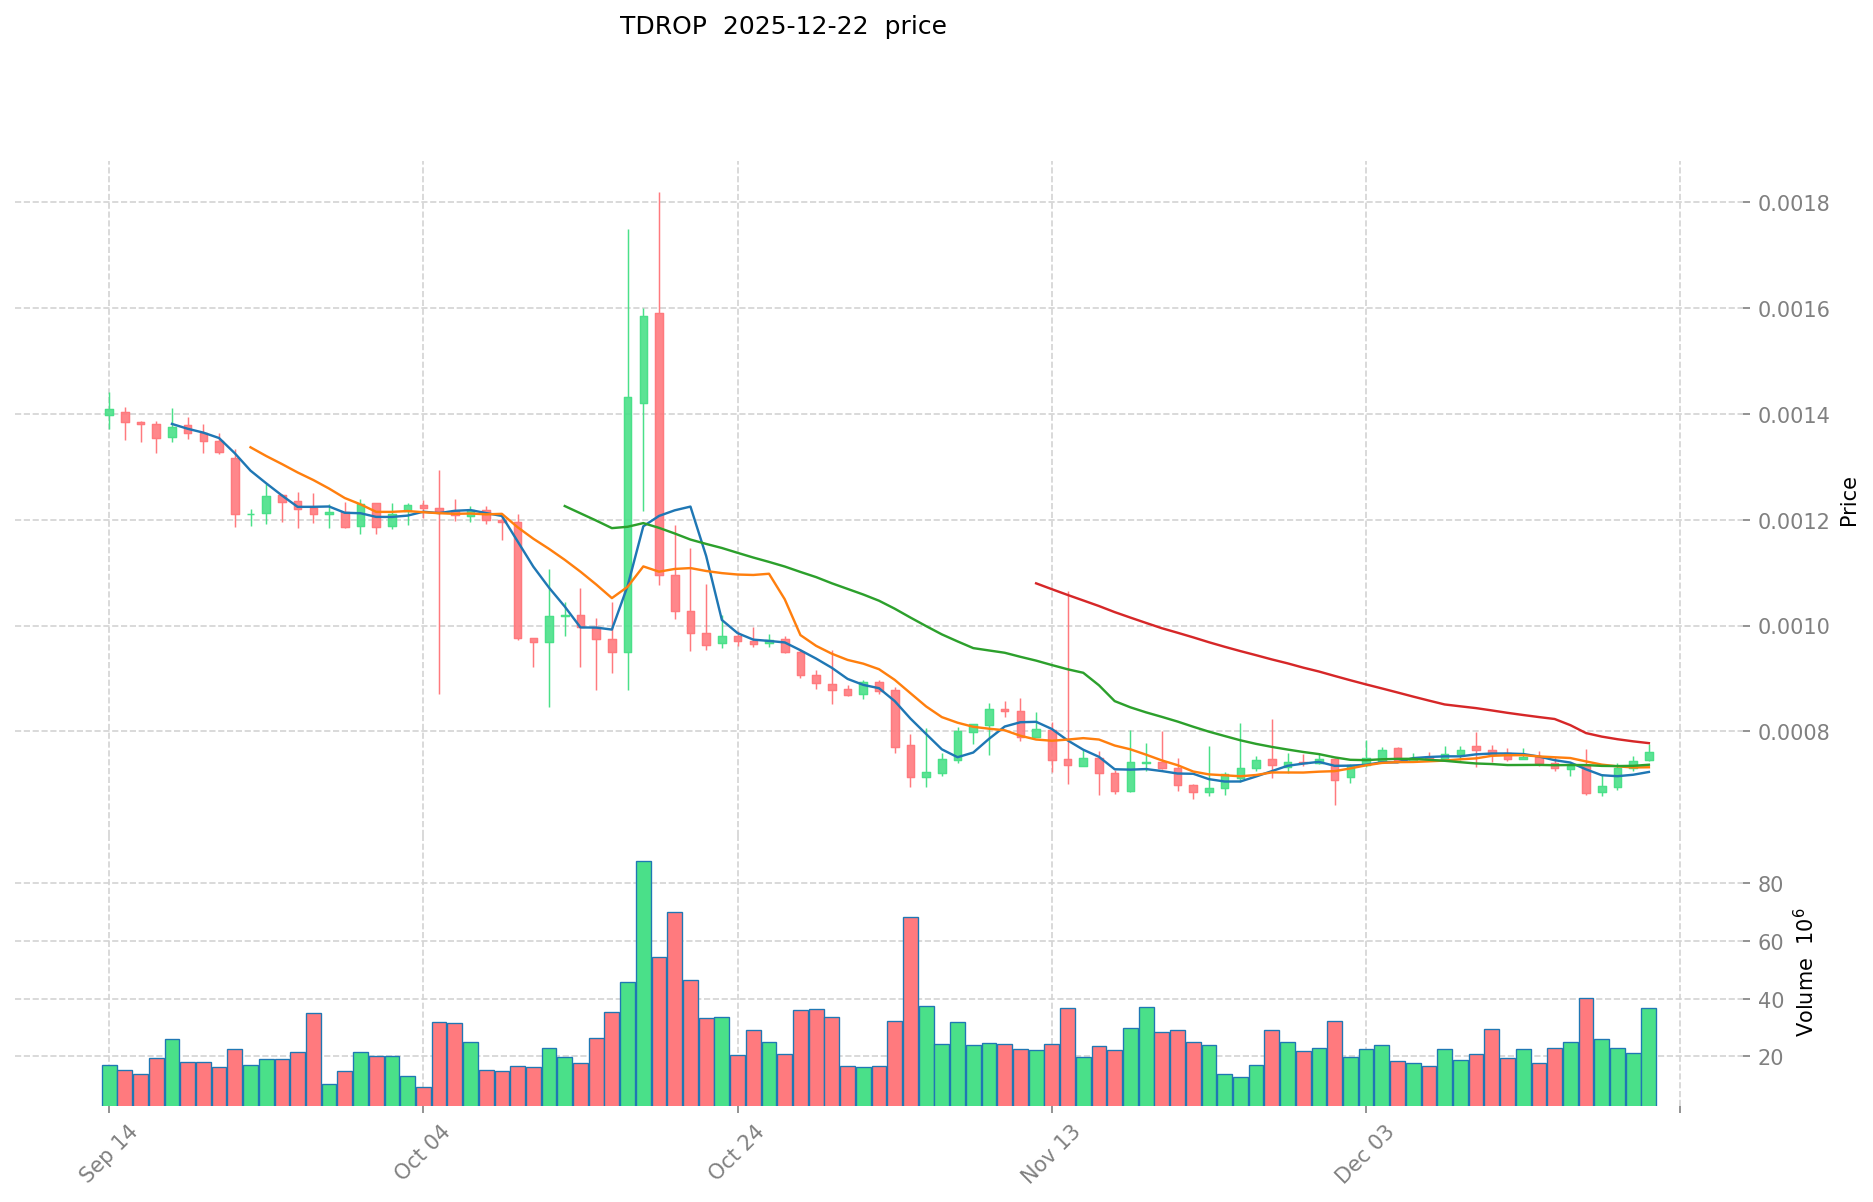
- All-time low: $0.00068144 (December 18, 2025)
- Historical decline: From peak to current levels represents a decline of approximately 98.72%
THORChain (RUNE):
- All-time high: $20.87 (May 19, 2021)
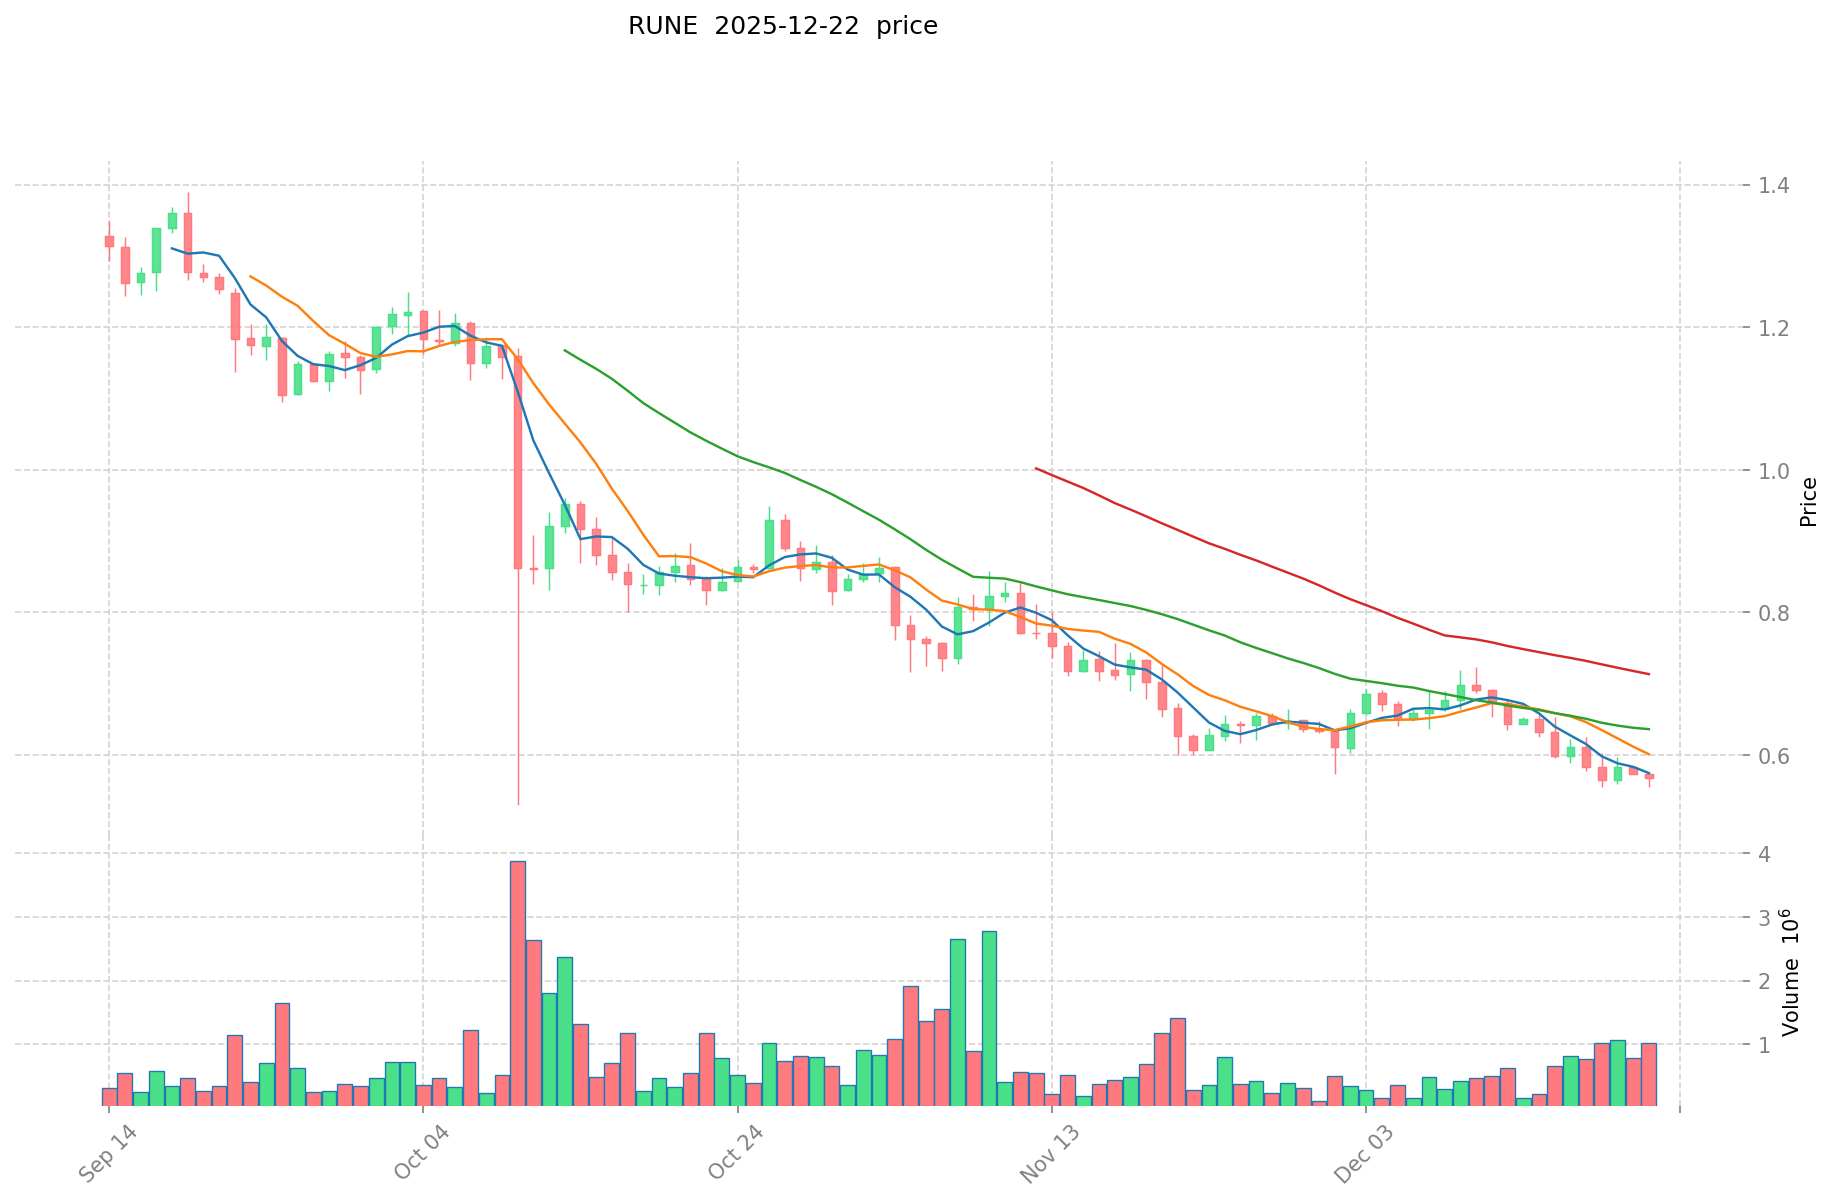
- All-time low: $0.00851264 (September 28, 2019)
- Historical decline: From peak to current levels represents a decline of approximately 97.22%
Comparative Analysis: Both tokens have experienced significant bearish pressure since their peak valuations in 2021-2022. TDROP entered the market later (2022) and has shown steeper percentage declines from its ATH. RUNE, having been established earlier, demonstrates a longer market history with notable recovery capacity from its 2019 lows, though still substantially below its 2021 peaks.
Current Market Status (December 22, 2025)
| Metric | TDROP | RUNE |
|---|---|---|
| Current Price | $0.0007795 | $0.5807 |
| 24-Hour Change | +2.89% | +1.93% |
| 24-Hour Volume | $33,027.44 | $606,302.78 |
| Market Capitalization | $8,614,096.93 | $246,837,015.47 |
| Circulating Supply | 11,050,797,860 | 351,054,367 |
| Market Dominance | 0.00026% | 0.0076% |
Crypto Fear & Greed Index: 25 (Extreme Fear)
Reference current prices:
- View TDROP current price: Market Data
- View RUNE current price: Market Data
II. Project Overview and Fundamentals
ThetaDrop (TDROP)
Project Description: ThetaDrop is a TNT-20 token built on the Theta blockchain, designed to reward activity on the ThetaDrop NFT Marketplace. The token provides decentralized governance for the ThetaDrop platform and rewards stakers with token incentives. The project centers around the innovative concept of NFT liquidity mining.
Technical Specifications:
- Blockchain: Theta
- Token Standard: TNT-20
- Contract Address: 0x1336739b05c7ab8a526d40dcc0d04a826b5f8b03
- Max Supply: 20,000,000,000
- Circulating Supply: 11,050,797,860 (55.25% of max supply)
THORChain (RUNE)
Project Description: THORChain is a highly optimized multi-chain protocol utilizing pBFT consensus to achieve sub-second block finality. The network enables chain-level transactions and order matching with native protocol support for limit and market orders. RUNE serves as the native token for the THORChain ecosystem, functioning as the settlement asset for cross-chain swaps and securing the network through validator collateral.
Technical Specifications:
- Consensus Mechanism: pBFT (Practical Byzantine Fault Tolerance)
- Token Standard: Native
- Max Supply: 500,000,000
- Circulating Supply: 351,054,367 (70.21% of max supply)
- Launch Date: July 23, 2019
Primary Use Cases:
- Cross-chain asset settlement
- Network fee payments
- Validator collateral and liquidity pool participation
- Staking rewards for network security
III. Market Performance Analysis
Price Volatility and Trend Analysis
7-Day Performance:
- TDROP: +5.77%
- RUNE: -10.43%
30-Day Performance:
- TDROP: +15.19%
- RUNE: -5.24%
1-Year Performance:
- TDROP: -71.34%
- RUNE: -88.32%
Hourly Movement:
- TDROP: -0.59%
- RUNE: +0.54%
Trading Metrics
| Metric | TDROP | RUNE |
|---|---|---|
| 24H High | $0.0007949 | $0.584 |
| 24H Low | $0.000749 | $0.5554 |
| Volume/Market Cap Ratio | 0.38% | 0.25% |
| Listed on Exchanges | 2 | 24 |
IV. Risk Assessment and Market Sentiment
Market Conditions: The current Fear & Greed Index reading of 25 indicates "Extreme Fear" in the broader cryptocurrency market, reflecting heightened investor caution and pessimistic sentiment across digital asset markets.
Liquidity Considerations:
- RUNE demonstrates significantly higher liquidity with 24 exchanges listing the token compared to TDROP's 2 exchange listings
- RUNE's larger trading volume ($606k vs $33k) provides better market depth and price stability
- TDROP's lower liquidity may result in higher slippage for large orders
Supply Dynamics:
- TDROP: 55.25% of max supply in circulation, indicating potential for additional token dilution
- RUNE: 70.21% of max supply in circulation, suggesting more advanced distribution phase
V. Conclusion
TDROP and RUNE represent distinct market positions within the crypto ecosystem. TDROP serves the NFT liquidity mining niche on the Theta blockchain with limited market presence, while RUNE functions as an established multi-chain infrastructure token with broader ecosystem adoption. The current market environment of "Extreme Fear" presents heightened volatility risk for both assets. RUNE's superior liquidity and market maturity provide relative stability, whereas TDROP's smaller scale introduces both opportunity and concentration risk.
Investment Value Analysis: TDROP vs RUNE
I. Executive Summary
Based on available reference materials, this report examines the investment value factors of TDROP and RUNE tokens. TDROP focuses on the NFT market ecosystem, while RUNE provides native, trustless cross-chain swaps through THORChain. Both tokens' investment potential depends on their respective ecosystem development and technological innovation.
II. Core Factors Influencing TDROP vs RUNE Investment Value
Tokenomics and Supply Mechanisms
- TDROP: Token designed for NFT market participation; specific supply mechanism details not available in reference materials.
- RUNE: Token value is deeply correlated with the total value of assets locked in the network. The value capture mechanism ties RUNE directly to network activity and liquidity provision.
The value proposition of RUNE demonstrates direct linkage between token economics and network utility, where increased asset locks strengthen token value fundamentals.
Market Demand and Network Activity
- TDROP: Investment potential centered on NFT market demand and platform adoption within the digital asset collectibles space.
- RUNE: Dependent on trustless cross-chain exchange demand and the volume of cross-chain transactions processed through THORChain's protocol.
Technical Infrastructure and Use Cases
- TDROP: Operates within the NFT ecosystem, exposure to digital collectibles market trends and adoption rates.
- RUNE: Provides infrastructure for decentralized, trustless asset swaps across multiple blockchain networks, addressing the critical need for cross-chain interoperability without centralized intermediaries.
Ecosystem Development
According to 2024 market data, the cryptocurrency sector showed strong performance with total market cap increasing 45.7% in Q4 2024 compared to S&P 500's 3.0% growth. However, specific ecosystem metrics for TDROP and RUNE are not detailed in available reference materials.
III. Market Context and Industry Trends
2024 Cryptocurrency Market Performance
- Total crypto market cap demonstrated strong correlation (0.84) with S&P 500 in Q4 2024, up from 0.22 in Q3 2024.
- Dominant narratives in 2024 included Meme coins (30.7% of investor attention) and AI-related categories.
- Leading blockchain ecosystems: Solana and Base captured 18.2% market share of top narratives.
DeFi Sector Position
The reference materials acknowledge THORChain (RUNE) within the DeFi context, indicating the token operates in one of the more established cryptocurrency verticals. DeFi represented a significant portion of 2024's categorized network traffic.
IV. Limitations of Current Analysis
Due to constraints in available reference materials, the following typical investment analysis components cannot be adequately addressed:
- Detailed historical price performance and technical indicators
- Specific governance structures and DAO mechanisms
- Comparative valuations and market capitalization data
- Institutional adoption rates and major partnership announcements
- Regulatory developments in major markets
- Detailed risk assessments and volatility metrics
V. Conclusion
TDROP and RUNE represent two distinct investment narratives within the cryptocurrency ecosystem:
- TDROP offers exposure to the NFT market vertical, with value dependent on digital collectibles adoption and platform growth.
- RUNE provides infrastructure-level utility in cross-chain trading, with value directly tied to network-locked assets and transaction volume.
Investment decisions should be based on comprehensive analysis of each project's technical fundamentals, ecosystem development velocity, and alignment with individual risk tolerance and portfolio objectives.
III. 2025-2030 Price Forecasts: TDROP vs RUNE
Short-term Forecast (2025)
- TDROP: Conservative $0.000616–$0.000780 | Optimistic $0.000780–$0.000990
- RUNE: Conservative $0.500–$0.581 | Optimistic $0.581–$0.813
Mid-term Forecast (2027)
- TDROP is expected to consolidate within accumulation phase, with projected price range of $0.000750–$0.001036
- RUNE may enter recovery phase, with anticipated price range of $0.581–$0.914
- Key drivers: institutional capital inflows, ETF adoption, ecosystem development
Long-term Forecast (2030)
- TDROP: Base case $0.001123–$0.001369 | Optimistic scenario $0.001369–$0.001958
- RUNE: Base case $0.717–$1.138 | Optimistic scenario $1.138–$1.218
Disclaimer: These forecasts are for informational purposes only and should not be considered investment advice. Cryptocurrency markets are highly volatile and unpredictable. Past performance does not guarantee future results. Investors should conduct their own research and consult with qualified financial advisors before making any investment decisions.
TDROP:
| 年份 | 预测最高价 | 预测平均价格 | 预测最低价 | 涨跌幅 |
|---|---|---|---|---|
| 2025 | 0.000989965 | 0.0007795 | 0.000615805 | 0 |
| 2026 | 0.001088220975 | 0.0008847325 | 0.000698938675 | 13 |
| 2027 | 0.001035800574375 | 0.0009864767375 | 0.0007497223205 | 26 |
| 2028 | 0.001233589160243 | 0.001011138655937 | 0.000677462899478 | 29 |
| 2029 | 0.00161620402765 | 0.00112236390809 | 0.000920338404634 | 44 |
| 2030 | 0.001958076074054 | 0.00136928396787 | 0.001122812853653 | 76 |
RUNE:
| 年份 | 预测最高价 | 预测平均价格 | 预测最低价 | 涨跌幅 |
|---|---|---|---|---|
| 2025 | 0.81326 | 0.5809 | 0.499574 | 0 |
| 2026 | 1.010766 | 0.69708 | 0.5855472 | 20 |
| 2027 | 0.91369761 | 0.853923 | 0.58066764 | 47 |
| 2028 | 1.1489533965 | 0.883810305 | 0.7424006562 | 52 |
| 2029 | 1.26031349493 | 1.01638185075 | 0.6606482029875 | 75 |
| 2030 | 1.2180320099388 | 1.13834767284 | 0.7171590338892 | 96 |
Comparative Investment Analysis Report: TDROP vs RUNE
I. Price History and Current Market Status
Historical Price Performance
ThetaDrop (TDROP):
- All-time high: $0.061086 (February 18, 2022)
- All-time low: $0.00068144 (December 18, 2025)
- Decline from peak: Approximately 98.72%
THORChain (RUNE):
- All-time high: $20.87 (May 19, 2021)
- All-time low: $0.00851264 (September 28, 2019)
- Decline from peak: Approximately 97.22%
Both tokens have experienced significant bearish pressure since their peak valuations. TDROP entered the market later and demonstrates steeper percentage declines from its all-time high, while RUNE exhibits a longer market history with extended recovery capacity, though substantially below 2021 peaks.
Current Market Status (December 22, 2025)
| Metric | TDROP | RUNE |
|---|---|---|
| Current Price | $0.0007795 | $0.5807 |
| 24-Hour Change | +2.89% | +1.93% |
| 24-Hour Volume | $33,027.44 | $606,302.78 |
| Market Capitalization | $8,614,096.93 | $246,837,015.47 |
| Circulating Supply | 11,050,797,860 | 351,054,367 |
| Market Dominance | 0.00026% | 0.0076% |
Current Market Sentiment: Crypto Fear & Greed Index at 25 (Extreme Fear)
II. Project Fundamentals and Technical Overview
ThetaDrop (TDROP)
Project Architecture:
- Blockchain: Theta
- Token Standard: TNT-20
- Max Supply: 20,000,000,000
- Circulating Supply: 11,050,797,860 (55.25% of max supply)
Core Functions: ThetaDrop operates as a TNT-20 token designed to reward activity on the ThetaDrop NFT Marketplace. The token provides decentralized governance for the ThetaDrop platform and offers staking incentives. The project centers on NFT liquidity mining mechanics.
THORChain (RUNE)
Project Architecture:
- Consensus Mechanism: Practical Byzantine Fault Tolerance (pBFT)
- Token Standard: Native
- Max Supply: 500,000,000
- Circulating Supply: 351,054,367 (70.21% of max supply)
- Launch Date: July 23, 2019
Core Functions: RUNE serves as the native settlement asset for THORChain, a multi-chain protocol enabling trustless cross-chain swaps with sub-second block finality. Primary use cases include cross-chain asset settlement, network fee payments, validator collateral participation, and staking rewards.
III. Comparative Market Performance Analysis
Price Momentum Indicators
Short-term Performance (7-Day):
- TDROP: +5.77%
- RUNE: -10.43%
Medium-term Performance (30-Day):
- TDROP: +15.19%
- RUNE: -5.24%
Extended Performance (1-Year):
- TDROP: -71.34%
- RUNE: -88.32%
Trading Liquidity Assessment
| Metric | TDROP | RUNE |
|---|---|---|
| 24H High | $0.0007949 | $0.584 |
| 24H Low | $0.000749 | $0.5554 |
| Volume/Market Cap Ratio | 0.38% | 0.25% |
| Exchange Listings | 2 | 24 |
RUNE demonstrates significantly higher liquidity with 24 exchange listings compared to TDROP's 2 listings. RUNE's larger trading volume provides superior market depth and price stability, while TDROP's lower liquidity may result in elevated slippage for substantial orders.
IV. Investment Strategy Comparison: TDROP vs RUNE
Long-term vs Short-term Investment Strategy
TDROP: Suited for investors focused on NFT ecosystem exposure and willing to accept concentrated liquidity risk in exchange for potential exposure to digital collectibles market growth. Short-term traders may capitalize on current upward momentum (+15.19% over 30 days).
RUNE: Suited for investors seeking established infrastructure-level exposure with multi-chain utility and broader market adoption. The token's integration across 24 exchanges and larger market capitalization appeals to those prioritizing liquidity and ecosystem maturity over speculative growth.
Risk Management and Asset Allocation
Conservative Investor Profile:
- TDROP: 5-10% allocation
- RUNE: 15-25% allocation
- Remaining allocation: Stablecoins and higher-market-cap assets
Aggressive Investor Profile:
- TDROP: 15-25% allocation
- RUNE: 25-35% allocation
- Hedging strategies: Stablecoin reserves, cross-exchange arbitrage opportunities
Risk Mitigation Tools:
- Stablecoin positioning for maintaining dry powder during extreme fear conditions
- Portfolio diversification across blockchain layer ecosystems
- Multi-exchange holding strategies to mitigate platform-specific risks
V. Potential Risk Comparison
Market Risk
TDROP: Extreme liquidity concentration with only 2 exchange listings creates significant slippage risk for retail investors executing medium to large orders. The token's 55.25% circulating supply ratio indicates substantial future dilution potential. Low market capitalization ($8.6M) exposes the asset to price manipulation and volatile swings unrelated to fundamental development.
RUNE: While demonstrating superior liquidity, RUNE has declined 88.32% over one year, reflecting broader market pessimism toward DeFi infrastructure tokens. The current "Extreme Fear" sentiment (index: 25) amplifies downside risk for all cryptocurrency assets, including RUNE.
Technical Risk
TDROP: Operating on the Theta blockchain introduces single-chain dependency risk. The NFT marketplace focus creates exposure to consumer sentiment volatility within the digital collectibles sector. Limited public technical documentation regarding smart contract audits and security assessments presents uncertainty.
RUNE: Multi-chain architecture distributes technical risk across THORChain's pBFT consensus implementation. Dependency on validator collateral models creates potential risk if network security assumptions are compromised. Cross-chain bridging mechanisms introduce additional smart contract risk vectors.
Supply and Tokenomics Risk
TDROP: With only 55.25% of maximum supply circulating, future token emission schedules pose dilution risks to existing holders. Staking reward mechanisms may incentivize accelerated emission phases.
RUNE: At 70.21% circulation ratio, the token approaches mature distribution phases, reducing near-term dilution risk. However, validator reward mechanisms and liquidity pool incentives continue influencing circulating supply dynamics.
VI. Price Forecast Analysis (2025-2030)
Short-term Outlook (2025)
TDROP: Conservative range $0.000616–$0.000780 | Optimistic range $0.000780–$0.000990
RUNE: Conservative range $0.500–$0.581 | Optimistic range $0.581–$0.813
Mid-term Outlook (2027)
TDROP: Expected consolidation within accumulation phase, projected range $0.000750–$0.001036
RUNE: Anticipated entry into recovery phase, projected range $0.581–$0.914
Long-term Outlook (2030)
TDROP: Base case $0.001123–$0.001369 | Optimistic scenario $0.001369–$0.001958
RUNE: Base case $0.717–$1.138 | Optimistic scenario $1.138–$1.218
Forecasts are subject to significant uncertainty. Key drivers include institutional capital inflows, ETF adoption, ecosystem development velocity, and regulatory clarity across major jurisdictions.
VII. Conclusion: Which Is the Better Buy?
📌 Investment Value Summary
TDROP Advantages:
- Strong short-term momentum (+15.19% over 30 days)
- Lower absolute price point enables lower entry barriers for retail participants
- Direct exposure to NFT ecosystem growth narrative
- Smaller market cap creates potential for significant percentage appreciation if ecosystem adoption accelerates
RUNE Advantages:
- Established market presence with 24 exchange listings versus TDROP's 2
- Superior liquidity reduces execution risk for institutional and retail traders
- Infrastructure-level utility across multiple blockchain ecosystems
- Direct value correlation with cross-chain transaction volume and network activity
- Larger market capitalization ($246.8M) provides relative price stability
✅ Investment Recommendations
For New Investors: Position RUNE as core holding due to superior liquidity, broader exchange accessibility, and established ecosystem maturity. If pursuing NFT exposure, allocate only modest TDROP positions (5-10% of cryptocurrency allocation) given liquidity constraints and concentration risk.
For Experienced Investors: Consider TDROP as tactical position for capturing short-term momentum (current +15.19% monthly trend) while maintaining RUNE as portfolio infrastructure exposure. Implement stop-loss orders for TDROP given extreme liquidity risk. Utilize stablecoin hedges during periods of elevated market fear (current index: 25).
For Institutional Investors: RUNE represents more suitable allocation due to exchange accessibility, price liquidity, and ability to execute positions without material market impact. TDROP's current market infrastructure cannot accommodate substantial institutional capital without creating significant execution slippage.
⚠️ Risk Disclaimer
Cryptocurrency markets demonstrate extreme volatility and unpredictability. This analysis does not constitute investment advice. Both TDROP and RUNE have experienced substantial historical drawdowns (98.72% and 97.22% respectively), and past performance does not guarantee future results.
Key risk factors include:
- Market sentiment volatility reflected in current "Extreme Fear" index reading
- Regulatory uncertainty across major jurisdictions
- Smart contract security risks in both ecosystems
- Liquidity concentration risks, particularly for TDROP
- Broader cryptocurrency market correlation risk
Investors must conduct independent research, assess individual risk tolerance, and consult qualified financial advisors before making investment decisions. None
FAQ: TDROP vs RUNE Investment Comparison
I. What are the main differences between TDROP and RUNE tokens?
Answer: TDROP is a TNT-20 token built on the Theta blockchain focused on NFT marketplace rewards and liquidity mining, with a maximum supply of 20 billion tokens. RUNE is the native token of THORChain, a multi-chain protocol enabling cross-chain swaps using pBFT consensus, with a maximum supply of 500 million tokens. RUNE serves as settlement asset for cross-chain transactions and validator collateral, while TDROP centers on digital collectibles ecosystem participation.
II. Which token has better market liquidity currently?
Answer: RUNE demonstrates significantly superior liquidity with listings on 24 exchanges compared to TDROP's 2 exchange listings. RUNE's 24-hour trading volume ($606,302.78) is approximately 18 times higher than TDROP's ($33,027.44). This liquidity advantage reduces execution slippage risk and makes RUNE more accessible for institutional and retail investors executing medium to large orders.
III. How have TDROP and RUNE performed historically from their all-time highs?
Answer: Both tokens experienced severe bearish pressure. TDROP declined 98.72% from its all-time high of $0.061086 (February 2022) to current levels around $0.00078. RUNE declined 97.22% from its all-time high of $20.87 (May 2021) to current levels around $0.5807. TDROP entered the market later and shows steeper percentage declines, while RUNE demonstrates longer market history with greater recovery capacity despite remaining substantially below 2021 peaks.
IV. What are the supply dynamics and future dilution risks for each token?
Answer: TDROP has 11.05 billion tokens circulating out of 20 billion maximum supply (55.25%), indicating substantial future dilution potential. RUNE has 351.05 million tokens circulating out of 500 million maximum supply (70.21%), suggesting more advanced distribution phase with reduced near-term dilution risk. TDROP's lower circulation percentage creates greater uncertainty regarding future emission schedules and staking reward mechanisms.
V. Which token shows better short-term price momentum?
Answer: TDROP demonstrates superior short-term momentum with +15.19% performance over 30 days and +5.77% over 7 days. RUNE shows negative short-term performance at -10.43% over 7 days and -5.24% over 30 days, though both tokens remain severely depressed compared to historical valuations. The current cryptocurrency market "Extreme Fear" index reading of 25 amplifies volatility for both assets.
VI. What investment allocation strategy is recommended for each token?
Answer: Conservative investors should allocate 5-10% to TDROP given concentration and liquidity risks, and 15-25% to RUNE for infrastructure exposure. Aggressive investors may increase to 15-25% TDROP allocation and 25-35% RUNE allocation with implemented hedging strategies. Institutional investors should prioritize RUNE due to superior exchange accessibility and price execution capability, avoiding TDROP given insufficient market infrastructure for substantial capital deployment.
VII. What are the long-term price forecasts for TDROP and RUNE through 2030?
Answer: TDROP projections indicate base case range of $0.001123–$0.001369 by 2030 (76% appreciation from current levels), with optimistic scenarios reaching $0.001369–$0.001958. RUNE base case forecasts $0.717–$1.138 by 2030 (96% appreciation), with optimistic scenarios reaching $1.138–$1.218. These forecasts depend on institutional capital inflows, ETF adoption, ecosystem development acceleration, and regulatory clarity. Forecasts carry significant uncertainty and should not drive investment decisions.
VIII. How does current market sentiment affect investment decisions for both tokens?
Answer: The Crypto Fear & Greed Index at 25 (Extreme Fear) indicates heightened investor caution and pessimistic sentiment across cryptocurrency markets. This environment creates elevated volatility risk for both TDROP and RUNE, suggesting conservative position sizing and increased hedging through stablecoin reserves. Extreme fear conditions historically precede recovery phases, but timing such reversals remains inherently unpredictable. Both tokens warrant cautious entry strategies during periods of extreme fear, with dollar-cost averaging preferred over lump-sum allocation.
Share
Content
Introduction: TDROP vs RUNE Investment Comparison
I. Price History Comparison and Current Market Status
II. Project Overview and Fundamentals
III. Market Performance Analysis
IV. Risk Assessment and Market Sentiment
V. Conclusion
I. Executive Summary
II. Core Factors Influencing TDROP vs RUNE Investment Value
III. Market Context and Industry Trends
IV. Limitations of Current Analysis
V. Conclusion
III. 2025-2030 Price Forecasts: TDROP vs RUNE
I. Price History and Current Market Status
II. Project Fundamentals and Technical Overview
III. Comparative Market Performance Analysis
IV. Investment Strategy Comparison: TDROP vs RUNE
V. Potential Risk Comparison
VI. Price Forecast Analysis (2025-2030)
VII. Conclusion: Which Is the Better Buy?
⚠️ Risk Disclaimer
How to Buy Cryptocurrency


Trending Cryptocurrencies


MOVR vs XLM: A Comprehensive Comparison of Two Leading Blockchain Assets in 2024
HLN vs LTC: A Comprehensive Comparison of Two Emerging Blockchain Assets
UNCX vs KAVA: Comprehensive Comparison of Two Leading DeFi Protocols and Their Investment Potential

Is Ren (REN) a good investment?: A Comprehensive Analysis of Price Performance, Use Cases, and Market Outlook in 2024

OMG vs CRO: Which Cryptocurrency Offers Better Investment Potential in 2024?
REEF Token Turmoil: Investor Suffers Huge Losses Amid Price Crash

MegaETH Airdrop: Everything You Need to Know to Participate and Maximize Rewards
Wyckoff Pattern: A Simplified Guide For Beginners
Top Bitcoin Mining Apps for Android & iOS

How to Buy BIM in Egypt

Tether TRC20 Wallet and USDT on TRON Network