Crypto analyst Jason Pizzino predicts that Bitcoin may only bottom out in October 2026. He notes that Bitcoin trading volume is gradually decreasing in a manner similar to late 2022 and early 2023, which is currently a springboard for the bull market. The CryptoQuant weekly report points out that the share of large players in total deposits has dropped from a peak of 47% in the 24-hour average in mid-November to the current 21%.
Trading Volume Contraction Repeats 2022 Script: The Final Stage Before Bottoming Out
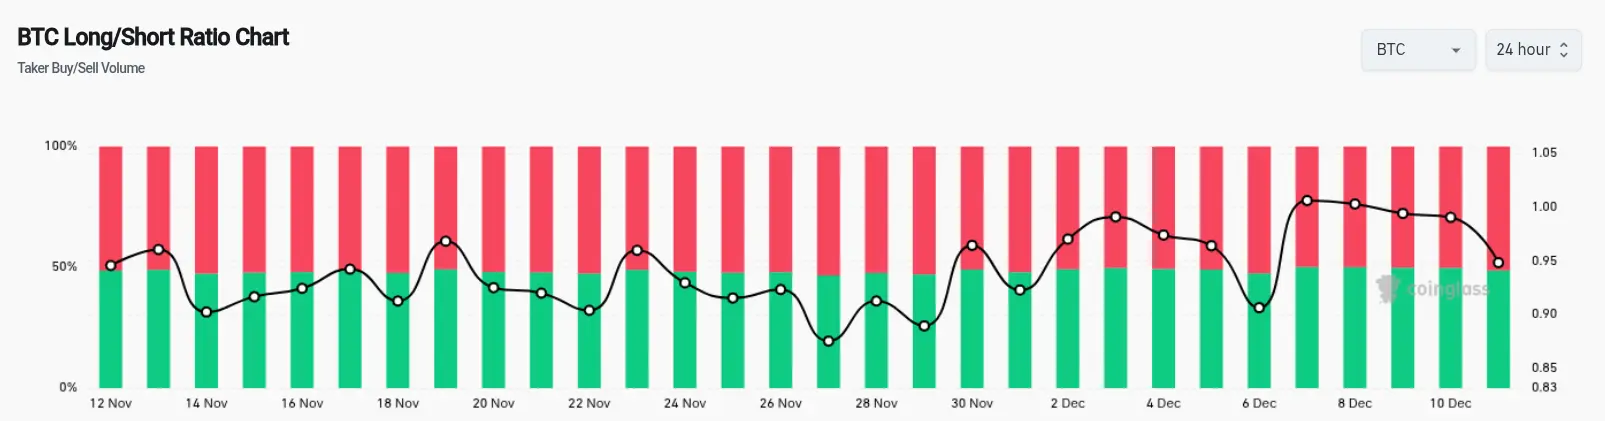
(Source: Coinglass)
Pizzino summarizes the current market trend and mentions the community’s expectation that BTC/USD will form a rebound zone sometime in the next 11 months. He says: “As I’ve said, we still have some time. I think it’s too early to determine whether this will be a bottom that pushes to new all-time highs or a bottom that pushes lower to even lower highs, because we are currently in the position of the 2018 cycle.”
Pizzino discusses risk asset behavior and links it to the 18-year cycle theory involving the real estate market. This long-cycle theory suggests that asset markets go through major cycles of about 18 years, from recovery to boom and then recession. If Bitcoin follows a similar pattern, it may currently be in the middle or later stages of the cycle, requiring a period of consolidation or retracement to accumulate energy for the next big rally.
To identify the reversal zone, Pizzino pays close attention to the pattern of Bitcoin trading volume changes. In late 2022 and early 2023, Bitcoin volume continued to decline to very low levels, with market attention hitting a freezing point. At that time, most investors believed the crypto market was dead, with events like the FTX collapse and Terra Luna crash severely damaging confidence. However, it was in this extremely pessimistic environment that Bitcoin bottomed in the $15,000 to $20,000 range, subsequently initiating the ongoing bull market.
Pizzino believes that the current pattern of declining volume is highly similar to late 2022. “Because most people are not paying attention, these shocking moves happen,” he says. This contrarian thinking is typical of successful investors: when the market is extremely quiet and no one is paying attention, it’s often the best time to build positions. If the current situation is truly repeating the 2022 script, the bottom in 2026 will offer a historic buying opportunity for patient investors.
Pizzino thinks that the likelihood of a major trend change in the short term is low, as the 200-day simple moving average (SMA) is forming strong resistance above, and traders’ risk appetite is also limited. The buy-sell ratio balance confirms this. CoinGlass data shows that Bitcoin traders’ buy and sell volumes are currently in a relatively balanced state, with no clear dominance by bulls or bears. This balanced state usually appears during sideways consolidation phases with no clear trend.
Dual Signals of Large Holder Exit and Selling Pressure Easing
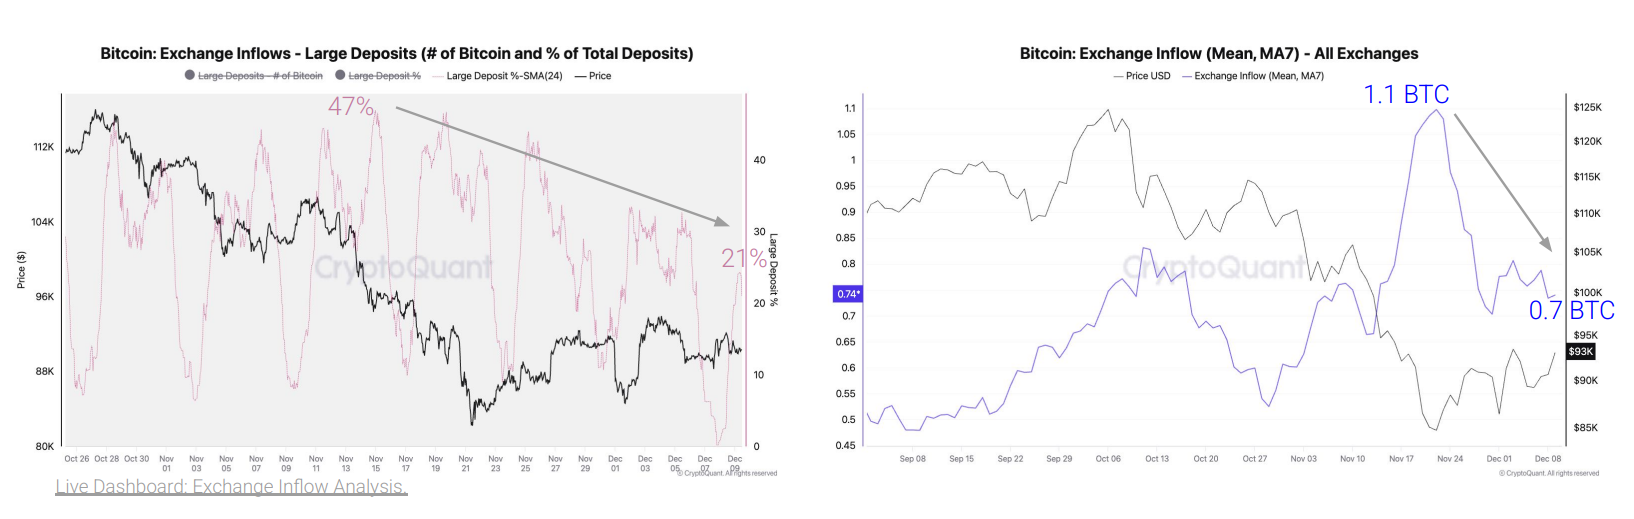
(Source: CryptoQuant)
In this week’s latest weekly report “Calm Before the Storm,” CryptoQuant points out that inflows of exchange funds from large trading volumes are decreasing. The report states: “The share of large players in total deposits has dropped from a peak of 47% in mid-November to 21% today.” This decline of over half indicates that large holders are changing their behavior.
Meanwhile, the average deposit amount has shrunk from 1.1 Bitcoin on November 22 to 0.7 Bitcoin, a 36% decrease. When large players reduce transfers to crypto exchanges, selling pressure eases. This is a positive signal, as exchange inflows are often seen as a sign of preparation to sell, while decreasing inflows suggest holders are inclined to continue holding rather than sell.
Triple Interpretation of Large Holder Behavior Changes
Increased Holding Confidence: Large holders reducing inflows to exchanges may indicate optimism about long-term prices and reluctance to sell at current levels
Liquidity Exhaustion Phase: Similar to late 2022, reduced large holder activity signals the market entering an extremely cold bottoming phase
Structural Easing of Selling Pressure: Decreased Bitcoin transfers into exchanges reduce available supply for sale, supporting prices
CryptoQuant believes that before a new market frenzy arrives, a consolidation period may occur. However, the continued weakening of selling pressure could push BTC/USD back to $99,000. The report adds: “This price level is the lower bound of the actual on-chain trader price range, serving as a resistance level in a bear market. Beyond this, key resistance levels are $102,000 (one-year moving average) and $112,000 (on-chain trader actual price).”
This analytical framework provides a clear price roadmap. If Bitcoin can break through $99,000, it will confirm that selling pressure has been sufficiently released, with the next target at $102,000. This level corresponds to the one-year moving average and is an important mid-term trend threshold. Further breaking through $112,000 would mark Bitcoin’s return to a healthy upward trend, paving the way to challenge the all-time high.
Potential Explosion After 2026 Bottom: Will History Repeat?
If Bitcoin truly bottoms in October 2026, it means there will be about 10 months of consolidation or decline from the current level. This period is both a test and an opportunity for long-term investors. The test involves enduring the psychological pressure of possible further price declines, while the opportunity lies in accumulating more positions at lower prices.
Historical experience offers an optimistic reference. After Bitcoin bottomed at $15,000 in November 2022, it rose to $40,000 within a year, a 167% increase. If a similar pattern repeats after the 2026 bottom in October, Bitcoin could challenge or even surpass the previous high of $108,000 in 2027. Although this historical analogy cannot guarantee repetition, it provides a risk-reward framework for investors.
However, the current cycle differs significantly from 2022. Back then, the market experienced systemic collapses like Terra Luna and FTX, with panic reaching extremes. Today’s market, while quiet, has not collapsed; institutional investors continue to participate via ETFs, and the regulatory environment is more friendly. These differences may mean the current bottoming process will be more gradual and longer, but the rebound may not be as explosive as in 2023.
Pizzino’s 18-year cycle theory offers a macro perspective, but short-term traders should focus more on technicals and on-chain data. The key resistance levels at $99,000, $102,000, and $112,000 will determine whether Bitcoin continues sideways or reverses early. Investors should remain patient, waiting for volume to truly bottom out and show signs of recovery.
Disclaimer: The information on this page may come from third parties and does not represent the views or opinions of Gate. The content displayed on this page is for reference only and does not constitute any financial, investment, or legal advice. Gate does not guarantee the accuracy or completeness of the information and shall not be liable for any losses arising from the use of this information. Virtual asset investments carry high risks and are subject to significant price volatility. You may lose all of your invested principal. Please fully understand the relevant risks and make prudent decisions based on your own financial situation and risk tolerance. For details, please refer to
Disclaimer.