Author: Frank, PANews
After experiencing a sharp decline on October 11th, the crypto market seems to have entered a prolonged “cooling-off period.” For most investors, understanding how current market liquidity has recovered since the heavy blow on 10.11 may be more important than predicting rises or falls. Additionally, how do the dominant capital players view the market’s future direction?
In response, PANews attempts to analyze the current capital landscape of the market through data such as order book depth, options market, and stablecoins. The final conclusion is: the market does not appear to have truly recovered but is instead trapped in a structural split characterized by continuous liquidity decline and institutional capital accelerating its defensive stance.
Micro Liquidity: Fragile Balance and Disappearing Support Orders
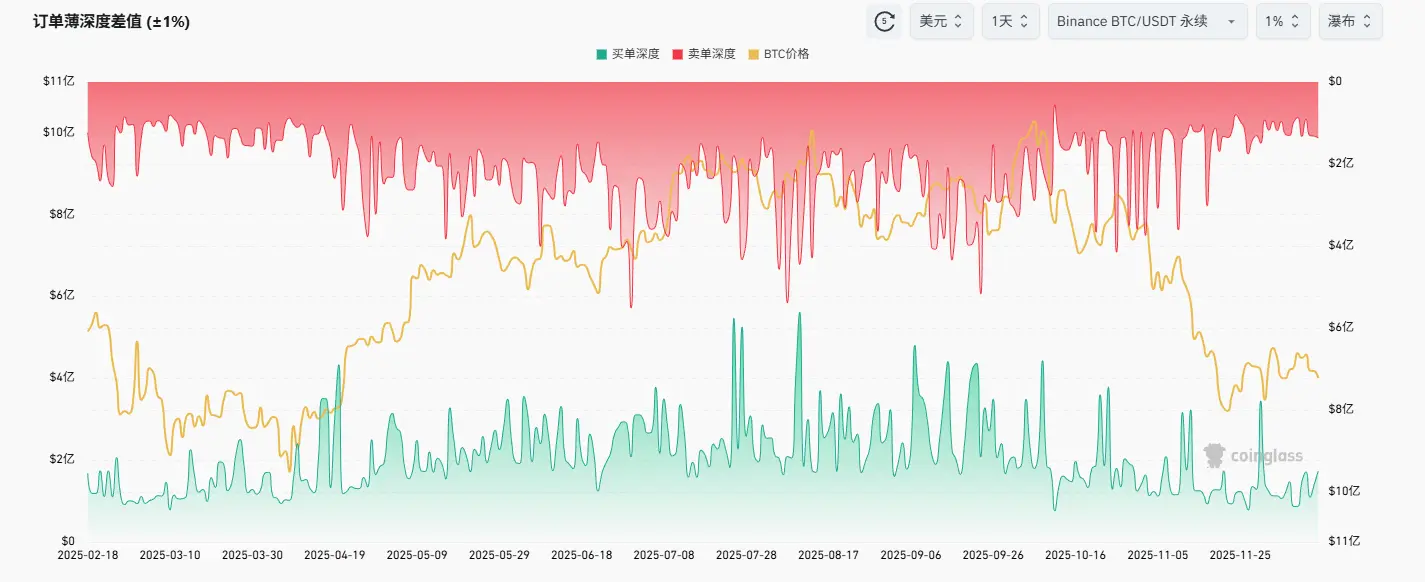
To understand the current liquidity situation, the order book depth difference is one of the most direct indicators.
Taking Binance BTC/USDT perpetual contract depth chart as an example, it is evident that since October, the buy order book depth has been decreasing, dropping from previously generally above $200 million to the $100-200 million range. The buy order depth has also significantly diminished, remaining below $200 million.
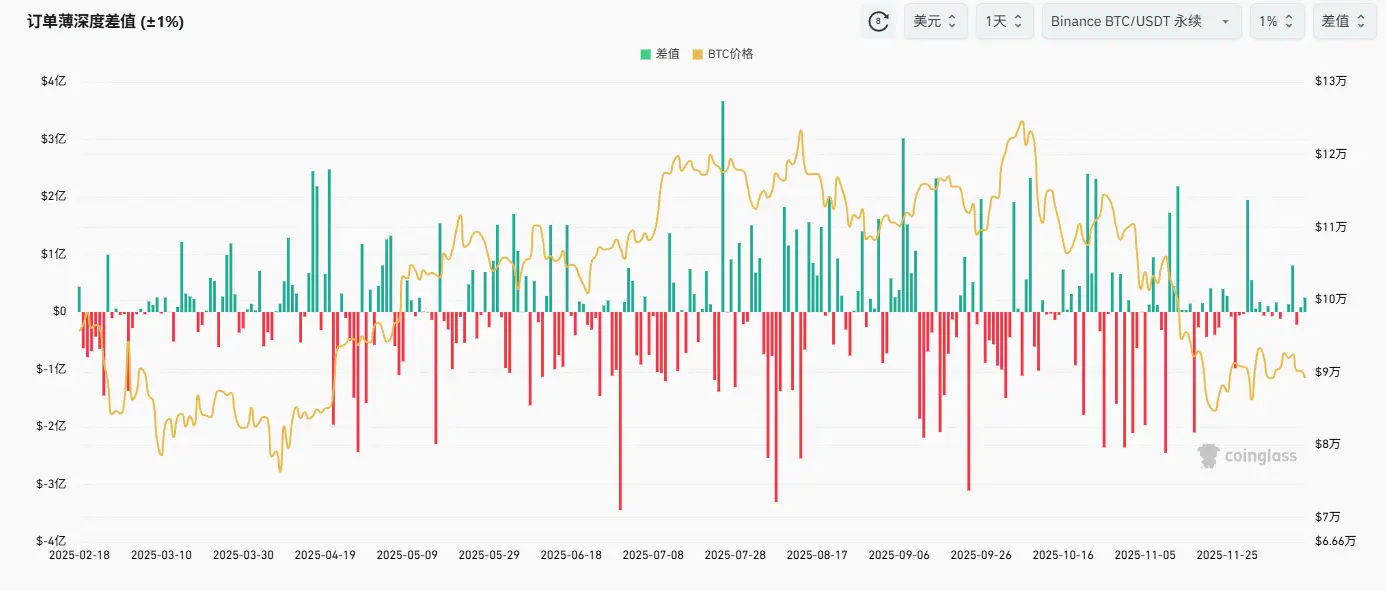
Regarding the order book difference, the gap between long and short order depths has recently become more balanced, with the order difference only around $10 million for several days since November. These data indicate that the entire market has entered a state of relatively balanced long and short positions but with ongoing liquidity decline.
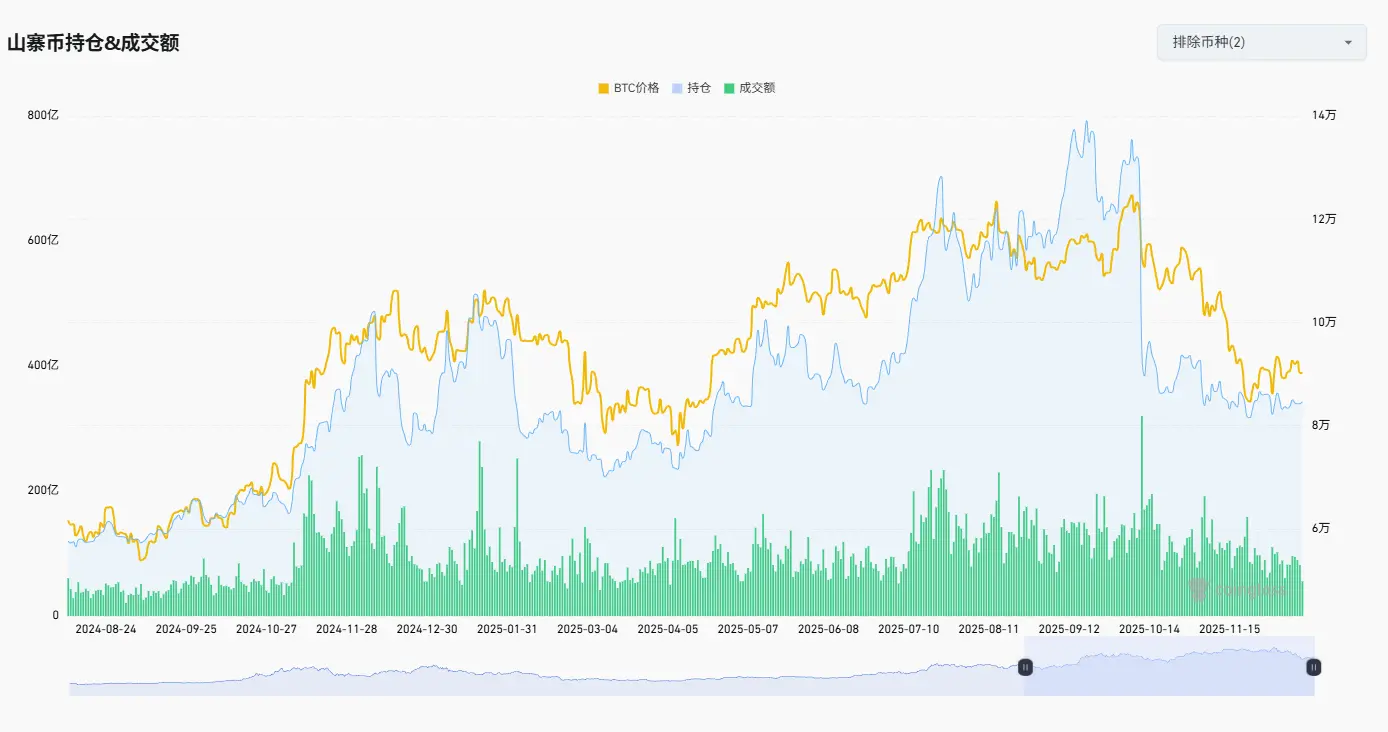
In terms of open interest, the overall holdings of altcoins (excluding BTC and ETH) have not shown growth as prices hit lows; instead, they are also declining. By contrast, in April, the market experienced a deep correction, but after prices reached lows, the total holdings rebounded sharply (sometimes even before prices hit the bottom).
Meanwhile, the trading volume of altcoin futures is also shrinking, with no significant increase in volume that would suggest a bottom-fishing rally. These data suggest that the altcoin market has entered a state of neglect.
Options Market: Retail Lottery, Main Players Bearish
Another interesting data point is the crypto options/open interest ratio, which shows that BTC options’ proportion has soared since the beginning of this year, even surpassing 100% at its peak, and currently remains around 90%. Previously, BTC options’ ratio was mostly around 60%. This indicates that the BTC market has shifted from being dominated by futures contracts to being dominated by options contracts. However, ETH’s crypto options/open interest ratio has fallen to a very low level this year, around 30%.
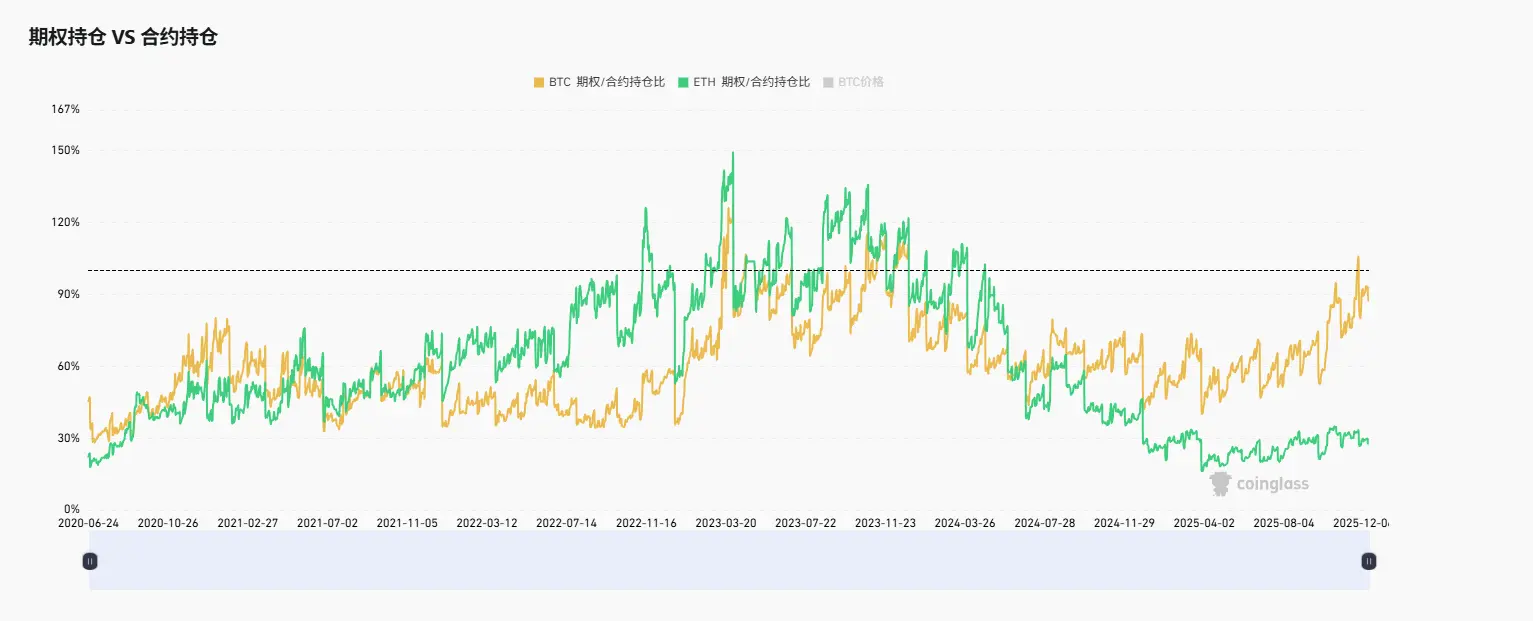
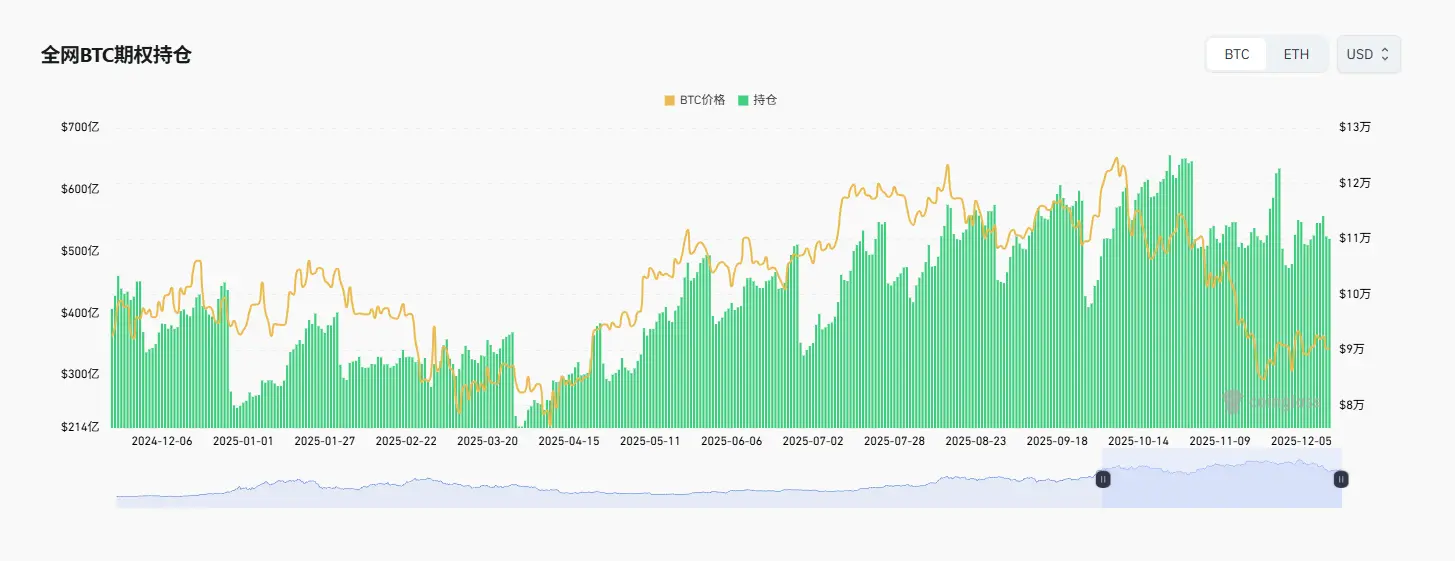
This data supports two conclusions. One is that the dominance of BTC market has been fully taken over by institutional and hedge funds, while ETH and other altcoins no longer serve as trading options for these institutions. The other is that options market data has become more critical in predicting BTC market movements. We can also see this trend from the total open interest in BTC options—despite price declines, open interest remains high.
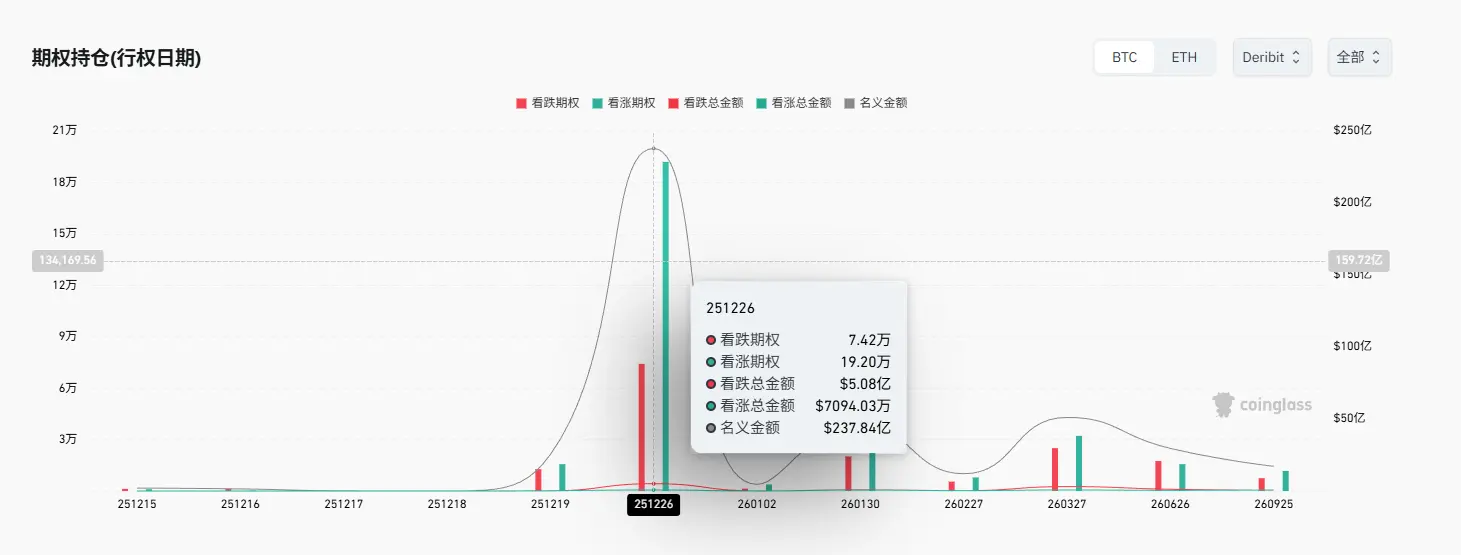
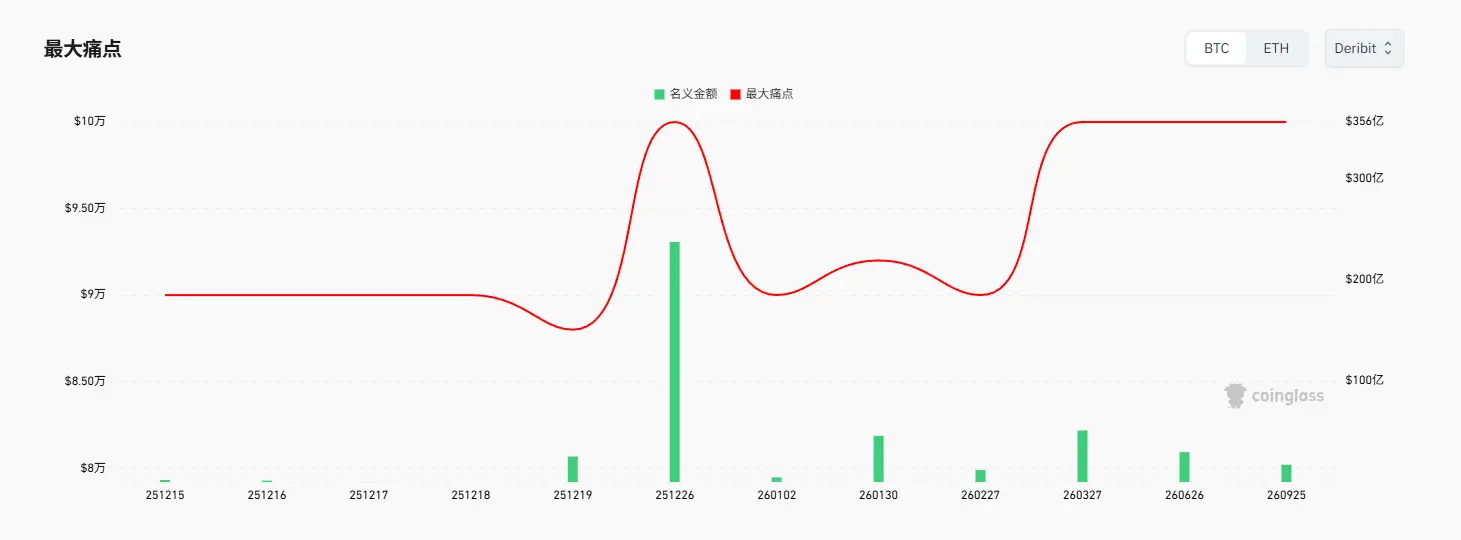
Therefore, options expiration dates and maximum pain points are important reference indicators for the current BTC market. Based on recent data, the next key options expiration date is December 26th, with total call options reaching 192,000 contracts, while put options total only 74,200. However, the total value of these put options is as high as $508 million, while call options total only $71.25 million. This inverted data suggests that current call options are very cheap (around $370), while put options are very expensive (up to $6,800).
Combining the distribution of strike prices, most call options are concentrated above $100,000, making it unlikely they will be exercised on December 26th. Although the number of call options is large, they are more akin to “lottery” style speculation. Meanwhile, many put options have strike prices below $85,000. The market value of put options has reached $1.124 billion, while call options’ market value is only $373 million (the premium paid by investors). In summary, although more traders are betting on rises, about 75% of the funds are actually betting on declines or hedging against downside risk.
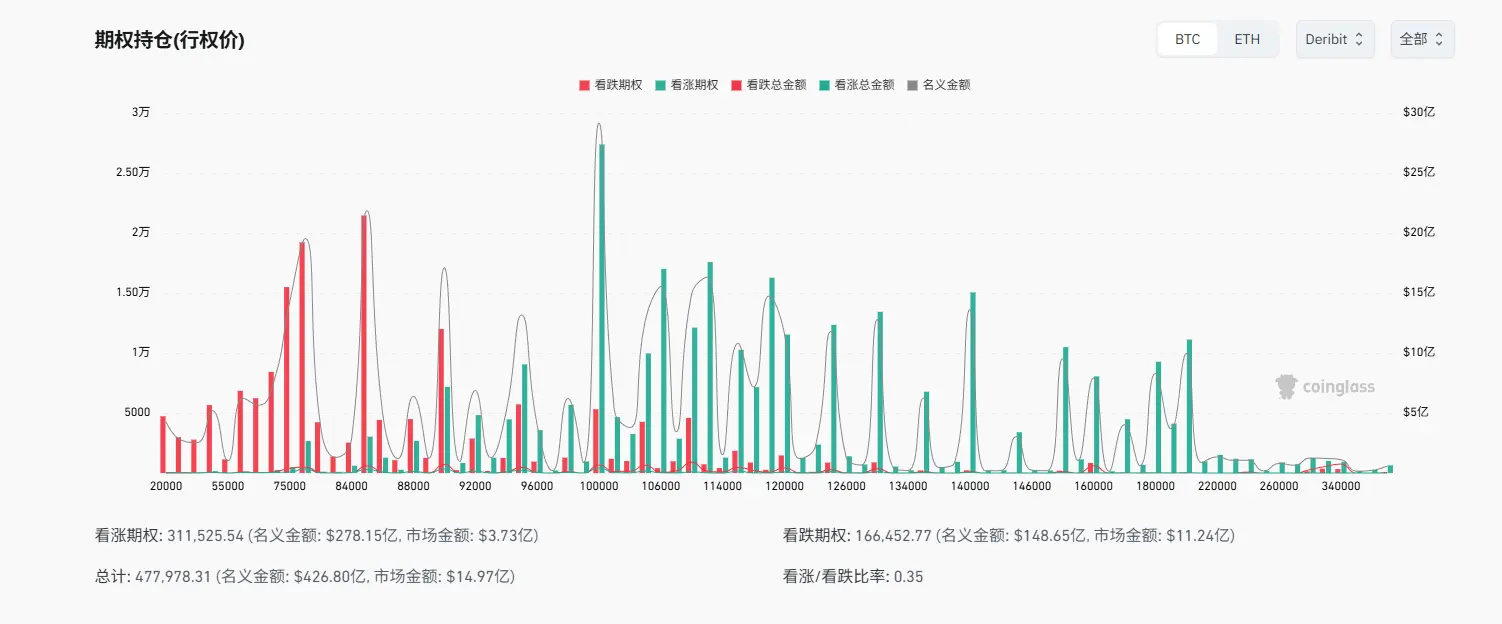
Another key point is the $100,000 level, which may become the focal point of competition between options sellers and buyers this month. For market makers (option sellers), they are likely the main bullish players; as long as the price can be pushed to around $100,000, they will be the biggest winners.
However, for institutions heavily investing in put options, most are likely hedging their spot holdings against downside risk. Although their primary motive is defensive, the high cost of puts means they are still allocating significant funds to bearish positions, indicating a strongly pessimistic outlook on the market’s future.
Stablecoins: Regulatory Retreat, Capital Watching
Besides options data and order book information, stablecoin data is also an important indicator for assessing current market liquidity and direction, especially the flow of stablecoins on exchanges. However, this data also reveals clear market divisions.
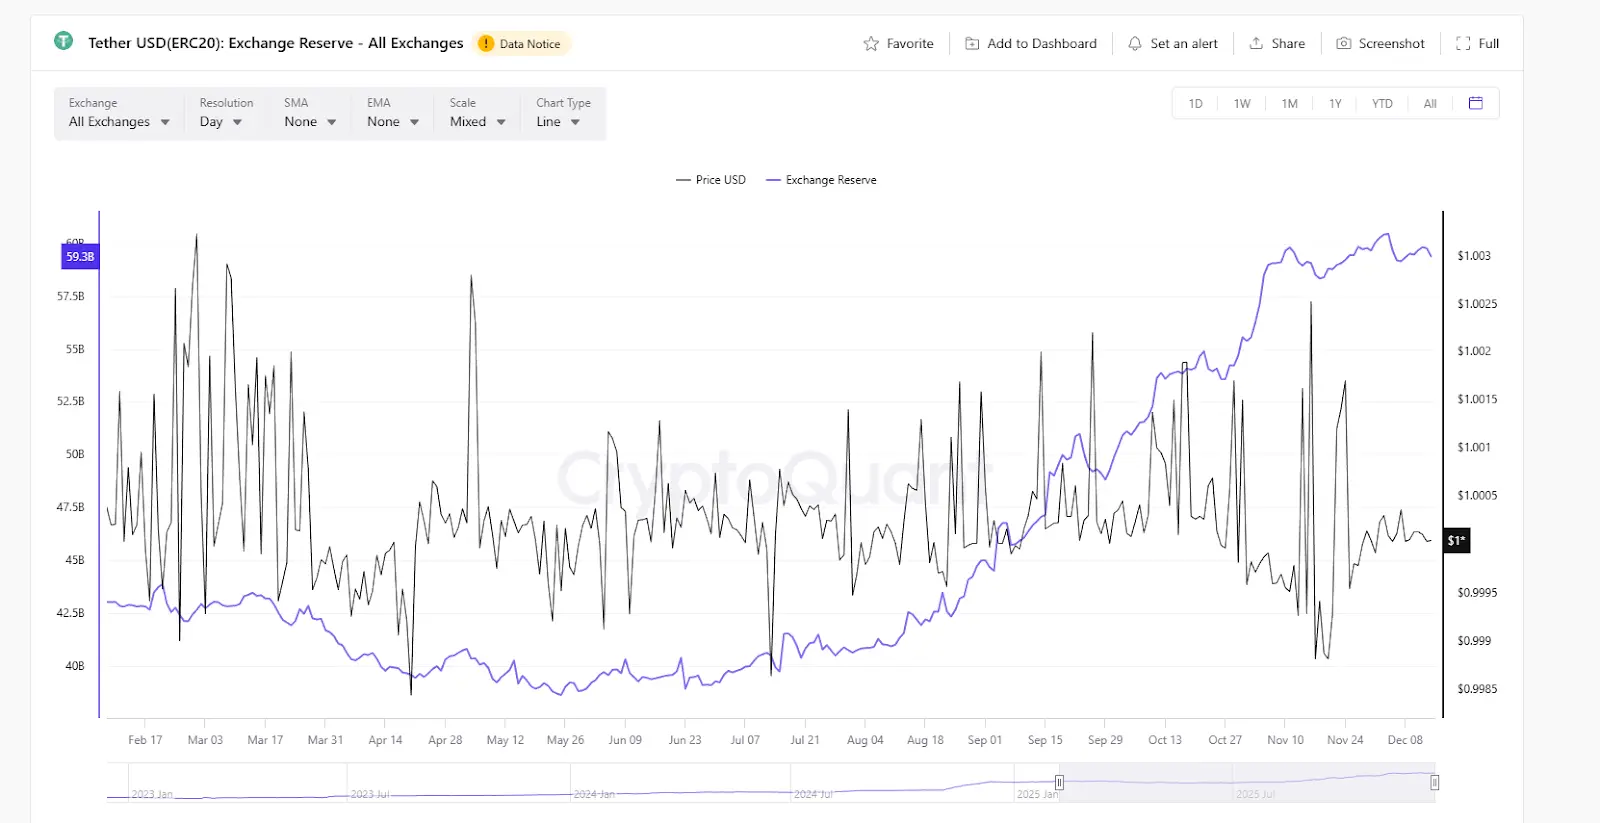
According to CryptoQuant, USDT exchange reserves have been on an upward trend throughout this year, maintaining this momentum recently. On December 4th, USDT reserves on exchanges hit a record high of $60.4 billion, still holding above $60 billion. As the primary pricing reference for non-compliant exchanges, the continuous growth of USDT reserves indicates that a large amount of speculative capital remains active, either betting or preparing to buy the dip. Coupled with the current decline in open interest, it suggests that much speculative capital is in a wait-and-see mode. 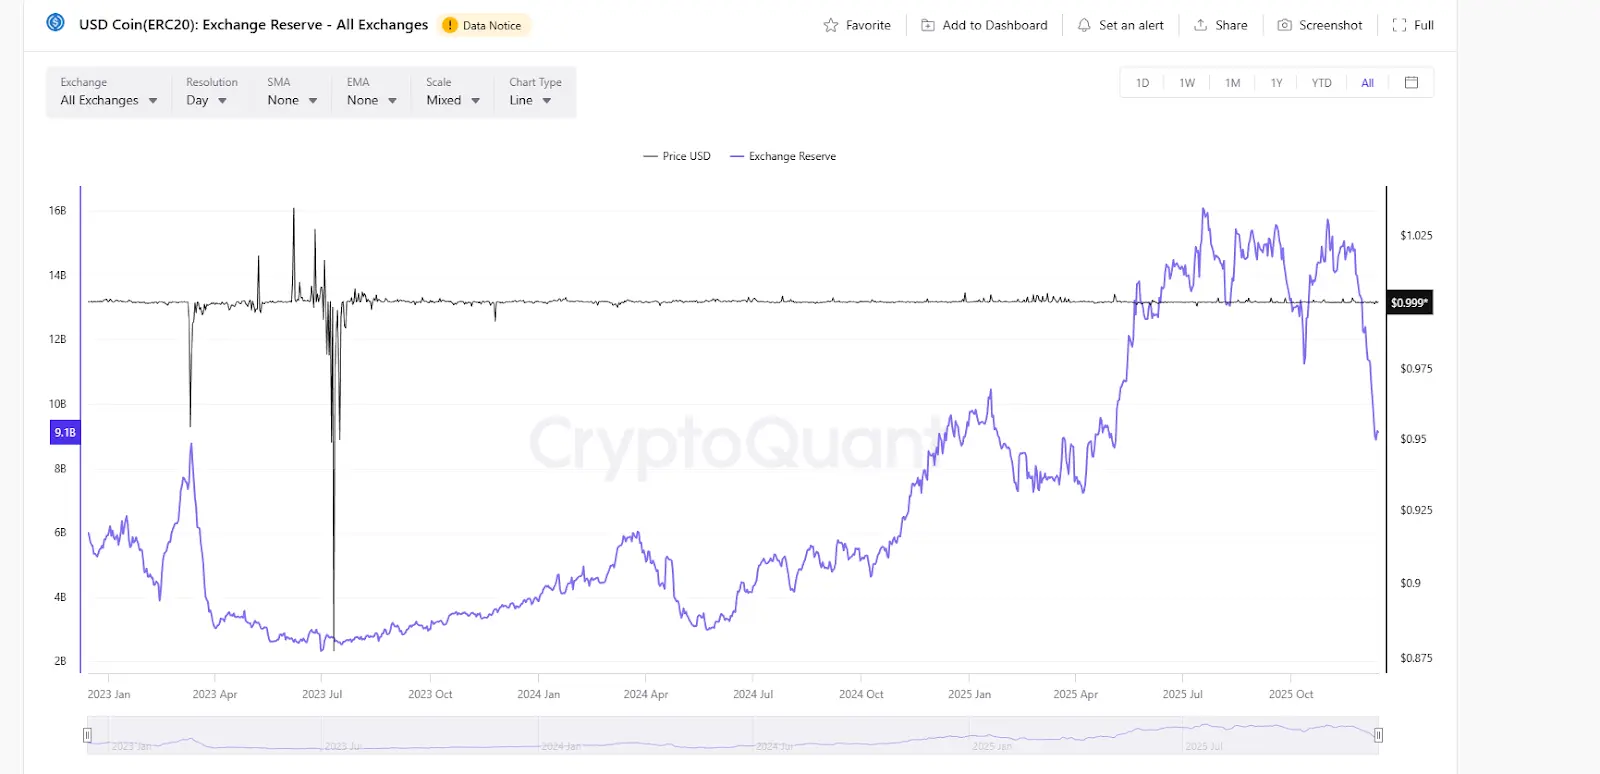
In contrast, USDC shows a completely different picture. Since late November, large amounts of USDC have been withdrawn from exchanges, with reserves dropping from $15 billion to around $9 billion, a decline of 40%. As the leading compliant stablecoin, USDC’s main users are institutions, such as US-based funds and compliant entities. They represent the institutional side of the market. Currently, it is clear that this group is accelerating its exit.
From these contrasting movements, it appears that retail investors and speculative capital are waiting to buy the dip, while compliant institutions are retreating. This conclusion aligns with the earlier analysis of the BTC options market. Another possibility is that under the risk of market downturns, large funds are shifting their crypto holdings into stablecoins for risk hedging.
In fact, the data and indicators used to judge the market are far more numerous than these, but overall, they tend to lead to similar conclusions: the market after the 10.11 crash has not truly recovered; instead, we see a market characterized by liquidity shortages and significant divergence between main players and retail investors. Retail and speculative traders hold positions on the sidelines, while compliant institutions or main funds are accelerating their withdrawal from spot markets and paying high premiums in options markets to build bearish defenses.
The current market does not seem to be a bottom ready to launch but rather a defensive battle of “institutions retreating and speculative players fighting.” It is more pragmatic to monitor whether the institutional support level at $85,000 is broken than to hope for a breakthrough at $100,000.
