
Hedera (HBAR) starts the week trading quietly, but there is plenty happening under the surface. A scheduled mainnet upgrade later this month keeps the network in focus, while Wyoming’s state-backed stablecoin initiative continues to lean on Hedera for international connectivity.
At the same time, institutional tokenization efforts tied to firms like Archax and BlackRock-linked funds are reinforcing Hedera’s long-term narrative.
Despite those developments, the HBAR price action remains cautious, with traders waiting for confirmation on the chart.
- What the Hedera chart is showing
- What market indicators are saying
- HBAR price short-term outlook for this week
What the Hedera chart is showing
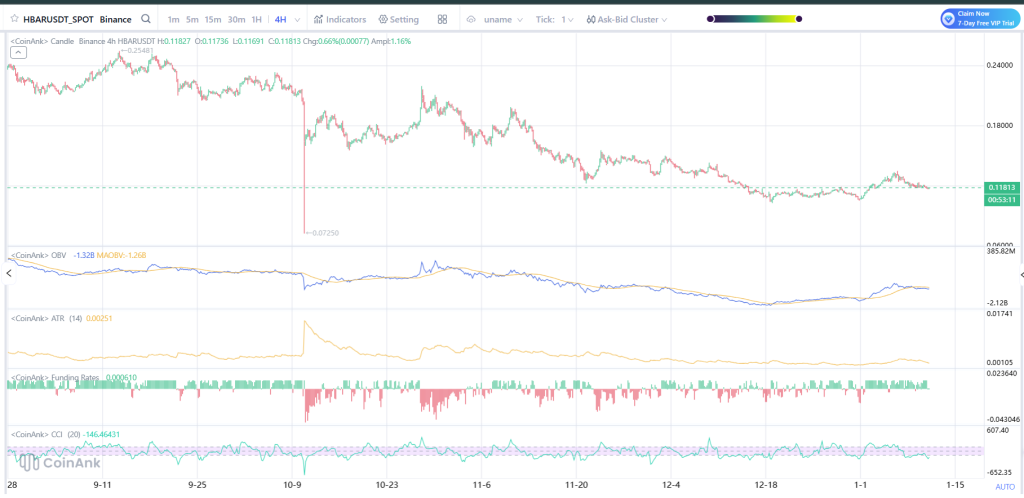
On the 4H chart, HBAR remains locked in a broader downtrend that began after the sharp breakdown earlier in the cycle. That large sell-off marked a structural shift, and price has struggled to reclaim previous support levels since. Over recent weeks, however, downside momentum has slowed noticeably.
The HBAR price is now trading in a tight consolidation zone, holding just above recent lows. Price has started forming a series of higher short-term reactions, but these moves lack follow-through.
This suggests sellers are no longer aggressive, yet buyers have not stepped in with conviction either. The structure currently favors sideways movement unless a clear breakout occurs.
Source: Coinank
What market indicators are saying
OBV is still very negative on balance, and this is a clear indicator that overall participation is not yet back. However, OBV has fallen into a flat pattern and is now stabilizing, which is a sign that a potential turn or a relief rally might soon happen.
ATR continues to trend lower after the earlier volatility spike, signaling compressed price action and reduced expansion. This typically occurs prior to a directional change, but it does not foretell the direction.
Funding rates remain flat and around neutral, implying a balanced use of leverage with no overcrowded positions.
The CCI has recently moved into oversold and has started to reverse and move back, showing waning downside momentum in the short run.
_****Artificial Superintelligence Alliance (FET) Price Returns To The Zone That Sparked Every Major Rally**
HBAR price short-term outlook for this week
With Hedera trading around $0.1178, price is sitting directly in the middle of this range. The first level of support comes in at $0.115. As long as this level continues to support price action, there is no reason to expect any further sideway movements or breaks lower.
A clear break below $0.115 would bring about a test of $0.110 and further down to $0.105. Breaking below $0.100 would be a clear sign that a bearish impulse is underway and that any form of rebound is likely to be delayed.
On the flip side, the first level of resistance is close to $0.122. Crossing above that point would be the first indicator that the market is about to see the revival of buying pressure.
If that resistance is sustained, buy/sell alerts for the HBAR price may reach $0.128, followed by $0.132, which saw previous sell activity. After that, the next level to watch is $0.140, with stronger resistance sitting in the $0.150–$0.155 area.
For this week, HBAR is most likely to trade between $0.115 and $0.130. A move above $0.132 would improve the short-term picture, while a drop below $0.110 would keep the broader correction in place.
Disclaimer: The information on this page may come from third parties and does not represent the views or opinions of Gate. The content displayed on this page is for reference only and does not constitute any financial, investment, or legal advice. Gate does not guarantee the accuracy or completeness of the information and shall not be liable for any losses arising from the use of this information. Virtual asset investments carry high risks and are subject to significant price volatility. You may lose all of your invested principal. Please fully understand the relevant risks and make prudent decisions based on your own financial situation and risk tolerance. For details, please refer to
Disclaimer.
Related Articles
Bitcoin Trades Narrow Range As Resistance Holds Near $71K
Bitcoin is trading around $70,335, showing a 2.13% decline in 24 hours. Analysts note a resistance near $71,400 and a consolidation phase, with traders awaiting a decisive breakout above or below established support and resistance levels.
CryptoBreaking1m ago
BTC 15-minute rise of 0.60%: ETF capital inflows and technical breakout resonance drive short-term momentum
2026-03-13 12:45 to 2026-03-13 13:00 (UTC), BTC achieved a +0.60% return within 15 minutes, with a price range of 72341.6-72888.0 USDT and a volatility amplitude of 0.76%. Short-term price oscillations noticeably intensified. Due to abundant trading volume, market attention rose rapidly, reflecting a phase of strengthened buying power.
The primary drivers of this movement are continuous net inflows into ETFs and a technical breakout of key structures. In March 2026, BTC spot ETFs attracted capital inflows as high as 1.6 billion dollars in a single week.
GateNews53m ago
DeFi enters a "winter of yields": liquidity stagnation, leverage contraction, and the disappearance of arbitrage opportunities
The DeFi market entered an "interest rate winter" since September 2025, with deposit rates for major stablecoins declining sharply and supply-demand imbalances causing liquidity congestion. The rate decline reflects reduced capital demand and a lack of high-return opportunities. Stablecoin lending demand has dropped significantly, with market risk appetite shifting toward more stable investment channels. In response to this situation, the Sky protocol demonstrates competitiveness and adaptability by introducing real-world assets to enhance yields. The low interest rates during this phase can be viewed as an opportunity for DeFi market transformation.
区块客57m ago
"Seeking a Sword by Marking a Boat" - Style Coin Price Predictions Go Viral: The Practical Logic and Flaws of Mystical Prophecies
Author: Frank, PANews
Whenever the market enters a confusing phase of going nowhere, people try to use a "cutting the boat to seek the sword" method of historical retrospection to predict the next market movement. In such cases, people often see from these theories and charts that history always repeats itself, and seem to automatically overlay and verify future price movements with a certain period in the past.
This coincidence seems to have a magical effect and is often verified. Some bloggers claim this prediction method has an accuracy rate of 75%~80%.
Does this "cutting the boat to seek the sword" style price prediction that repeatedly goes viral on social media help the market identify stages, or is it just packaging noise as prophecy?
From "Tick Fractals" to "History Rhyming"
The peak operation regarding predictions of October 2025 market tops is an analyst named CryptoBullet, who created a method called "ti
区块客1h ago
Surviving Oscillating Markets: How Retail Investors Can Minimize Losses? Capital Flow Trends and Practical Guide
Author: MyToken
In the crypto market, sentiment often emerges more easily than logic. When "volatility" becomes the norm for the broader market and "anxiety" becomes the prevailing mindset among retail investors, a discussion on how to "lose less money" carries more practical significance than any macro narrative presentation.
Recently, the renowned data aggregation platform MyToken hosted an AMA event themed "In the Current Market, How Can Retail Investors Lose Less Money? Capital Flow and Practical Guide." The event invited independent trader BTC Bull Demon King and KTX Exchange CMO Christine, who provided puzzled investors with a practical "survival guide" from the perspectives of independent traders and trading platforms respectively.
Below is a highlight recap of this AMA.
---
Market Phase Consensus: Stop Fantasizing About a Bull Run, This is a "Consolidation Phase"
Market positioning is a relatively important issue, as it directly determines the next
PANews2h ago
NAV Price Surges 44.25%: Is a New Trend Emerging?
NAV coin recently surged by 44.25%, reaching $0.032715, amid increased trading activity and fluctuating market conditions. Analysts attribute this rally to rising on-chain activity and shifting sentiment toward altcoins, while traders monitor key price levels for future movements.
Coinfomania4h ago