Trade
Basic
Futures
Futures
Hundreds of contracts settled in USDT or BTC
Options
HOT
Trade European-style vanilla options
Unified Account
Maximize your capital efficiency
Demo Trading
Futures Kickoff
Get prepared for your futures trading
Futures Events
Futures Mall
Participate in events to win generous rewards
Demo Trading
Use virtual funds to experience risk-free trading
Earn
Launch
CandyDrop
Collect candies to earn airdrops
Launchpool
Quick staking, earn potential new tokens
HODLer Airdrop
Hold GT and get massive airdrops for free
Launchpad
Be early to the next big token project
Alpha Points
NEW
Trade on-chain assets and enjoy airdrop rewards!
Futures Points
NEW
Earn futures points and claim airdrop rewards
Investment
Simple Earn
Earn interests with idle tokens
Auto-Invest
Auto-invest on a regular basis
Dual Investment
Buy low and sell high to take profits from price fluctuations
Soft Staking
Earn rewards with flexible staking
Crypto Loan
0 Fees
Pledge one crypto to borrow another
Lending Center
One-stop lending hub
VIP Wealth Hub
Customized wealth management empowers your assets growth
Private Wealth Management
Customized asset management to grow your digital assets
Quant Fund
Top asset management team helps you profit without hassle
Staking
Stake cryptos to earn in PoS products
Smart Leverage
NEW
No forced liquidation before maturity, worry-free leveraged gains
GUSD Minting
Use USDT/USDC to mint GUSD for treasury-level yields
More
AHeadOfBlackHair
Analysis Standards for the Market
%+-/
%+-/
#黄金白银再创新高 Why are US stocks and gold performing strongly?
The key issue: funds have not disappeared, only reallocated.
1. Why can gold break through $5000?
The rise in gold is fundamentally driven by safe-haven demand. When investors feel risks are too high, they do two things: sell high-risk assets (such as cryptocurrencies, tech stocks) and buy low-risk assets (such as gold, government bonds). In the past two weeks, three main factors have driven gold's rise:
Geopolitical tensions: Greenland incident + tariff threats, causing global investor uneas
View Original%+-/
%+-/
#黄金白银再创新高 Why are US stocks and gold performing strongly?
The key issue: funds have not disappeared, only reallocated.
1. Why can gold break through $5000?
The rise in gold is fundamentally driven by safe-haven demand. When investors feel risks are too high, they do two things: sell high-risk assets (such as cryptocurrencies, tech stocks) and buy low-risk assets (such as gold, government bonds). In the past two weeks, three main factors have driven gold's rise:
Geopolitical tensions: Greenland incident + tariff threats, causing global investor uneas

- Reward
- 1
- 1
- Repost
- Share
Ryakpanda :
:
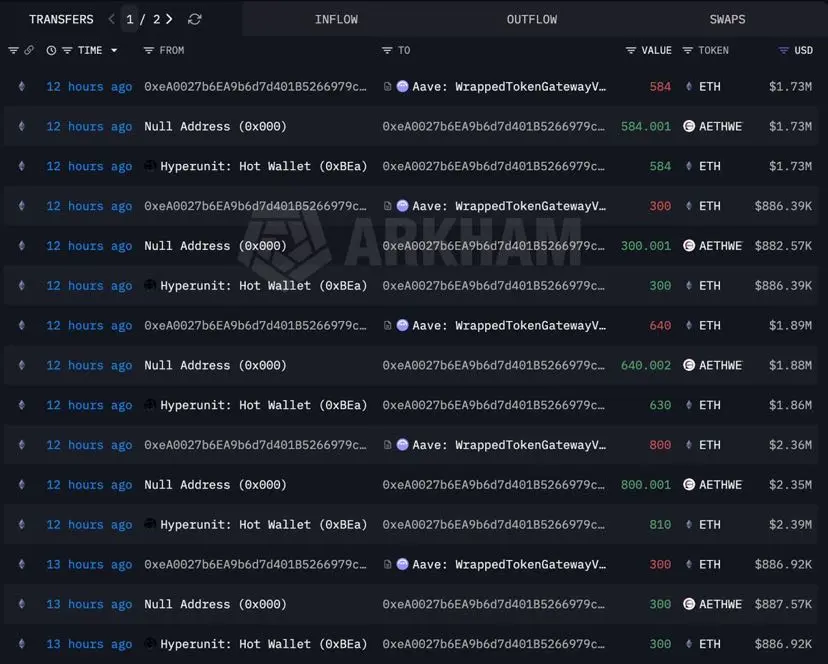
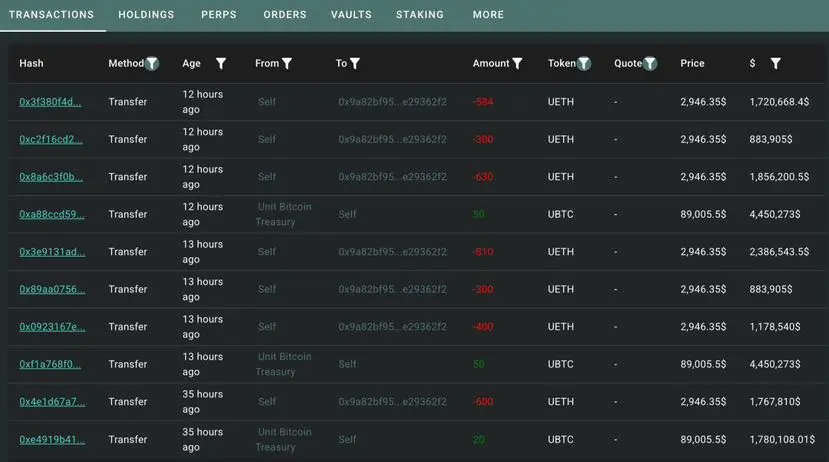
2026 Go Go Go 👊Two ETH staker wallets have withdrawn a total of 13,000 ETH (~$37.64M) from centralized exchanges, signaling potential long-term holding or staking intent.
📤 Wallet Breakdown:
0xd4f → withdrew 8,000 ETH (~$23.16M)
0xA75 → withdrew 5,000 ETH (~$14.48M)
📊 Market Insight:
Large ETH outflows from CEXs often reduce immediate sell pressure and are commonly viewed as a bullish on-chain signal, especially when paired with broader risk-asset momentum.
🌍 Macro Context:
With Gold and Silver hitting new highs, capital rotation into hard assets and crypto is back in focus, strengthening the narrative of
ETH-0,49%

- Reward
- 2
- 3
- Repost
- Share
ybaser:
Happy New Year! 🤑View More
大爆涨,不敢想象
大爆涨,不敢想象
Created By@ChineseMemeGlobalAmbassador
Listing Progress
0.00%
MC:
$3.38K
Create My Token
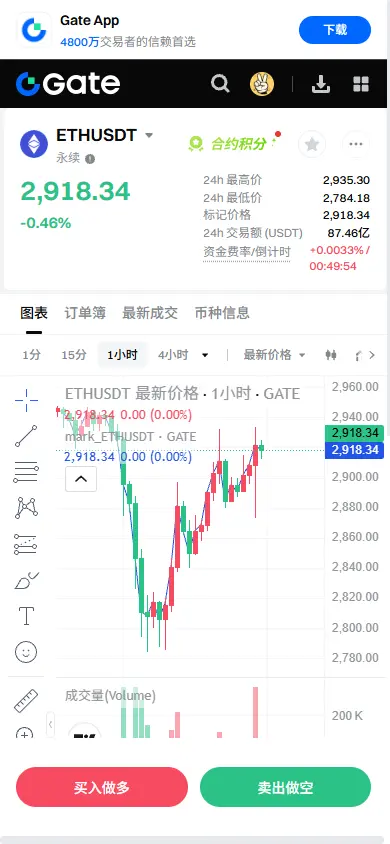
【$ETH Signal】Bullish with Healthy Pullback and Accumulation
$ETH After a volume-driven surge, the price is undergoing a healthy pullback, with falling prices accompanied by high open interest, indicating short squeeze rather than main force distribution. This is a typical cooling of a bull market.
🎯 Direction: Long
🎯 Entry: 2890 - 2915
🛑 Stop Loss: 2845 ( Rigid Stop Loss )
🚀 Target 1: 2980
🚀 Target 2: 3050
$ETH The price is consolidating above the key breakout zone, with decreasing downward momentum, indicating exhaustion of selling pressure. The pullback under high open interest is a
ETH-0,49%
- Reward
- like
- Comment
- Repost
- Share
- Reward
- like
- Comment
- Repost
- Share


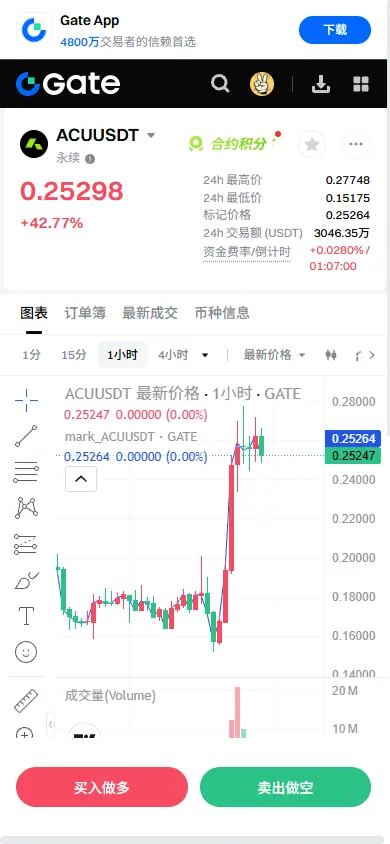
【$ACU Signal】Long + Volume and Price Breakout
$ACU Achieved a strong breakout under massive volume, with price action indicating continuous absorption by buyers. After the short squeeze, the market structure has shifted to a bullish dominance.
🎯 Direction: Long
🎯 Entry: 0.248 - 0.255
🛑 Stop Loss: 0.235 ( Rigid Stop Loss )
🚀 Target 1: 0.285
🚀 Target 2: 0.315
$ACU Daily increase exceeds 43%, accompanied by 227 million in trading volume and synchronized growth in open interest. This is a typical signal of main force entering rather than just short covering. After the breakout, no deep ret
ACU40,59%
- Reward
- 2
- 3
- Repost
- Share
NormalTemperature :
:
Either bad or stupidView More
🚨 GOLD JUST FLIPPED THE DOLLAR FOR THE FIRST TIME IN 30 YEARS… AND IT’S A GLOBAL RED FLAGThe data is clear and the shift is massive. For the first time in three decades central banks now hold more gold than US debt. This is not a minor rebalancing. It is a global vote of no confidence in the dollar. Foreign holders are no longer chasing yield. They are protecting principal because treasuries can be seized inflated away or weaponized through sanctions.
Gold carries zero counterparty risk and that single feature has changed the entire reserve playbook. The moment reserves became a geopolitical
Gold carries zero counterparty risk and that single feature has changed the entire reserve playbook. The moment reserves became a geopolitical
BTC-0,39%
- Reward
- 2
- 2
- Repost
- Share
CryptoZeno:
Good luck everyone View More
#GateWeb3UpgradestoGateDEX
Today marks a meaningful step forward in Gate’s Web3 journey as Gate Web3 officially upgrades to Gate DEX, signaling more than just a name change. This upgrade reflects a deeper shift toward decentralization, user sovereignty, and on-chain transparency values that continue to define the future of crypto. As the Web3 ecosystem matures, platforms are no longer competing only on features, but on how well they empower users, and Gate DEX positions itself clearly within that vision.
The transition to Gate DEX represents a stronger focus on decentralized trading infrastr
DEFI-3,57%

- Reward
- 1
- 1
- Repost
- Share
珮吉:
👍
- Reward
- like
- Comment
- Repost
- Share
AIBT integrates artificial intelligence and blockchain technology to promote the development of decentralized intelligent applications and empower the innovation of the digital economy. The project focuses on technological innovation and ecological construction, exploring new paradigms for future digital assets. #AIBT $AIBT
View Original
- Reward
- like
- Comment
- Repost
- Share
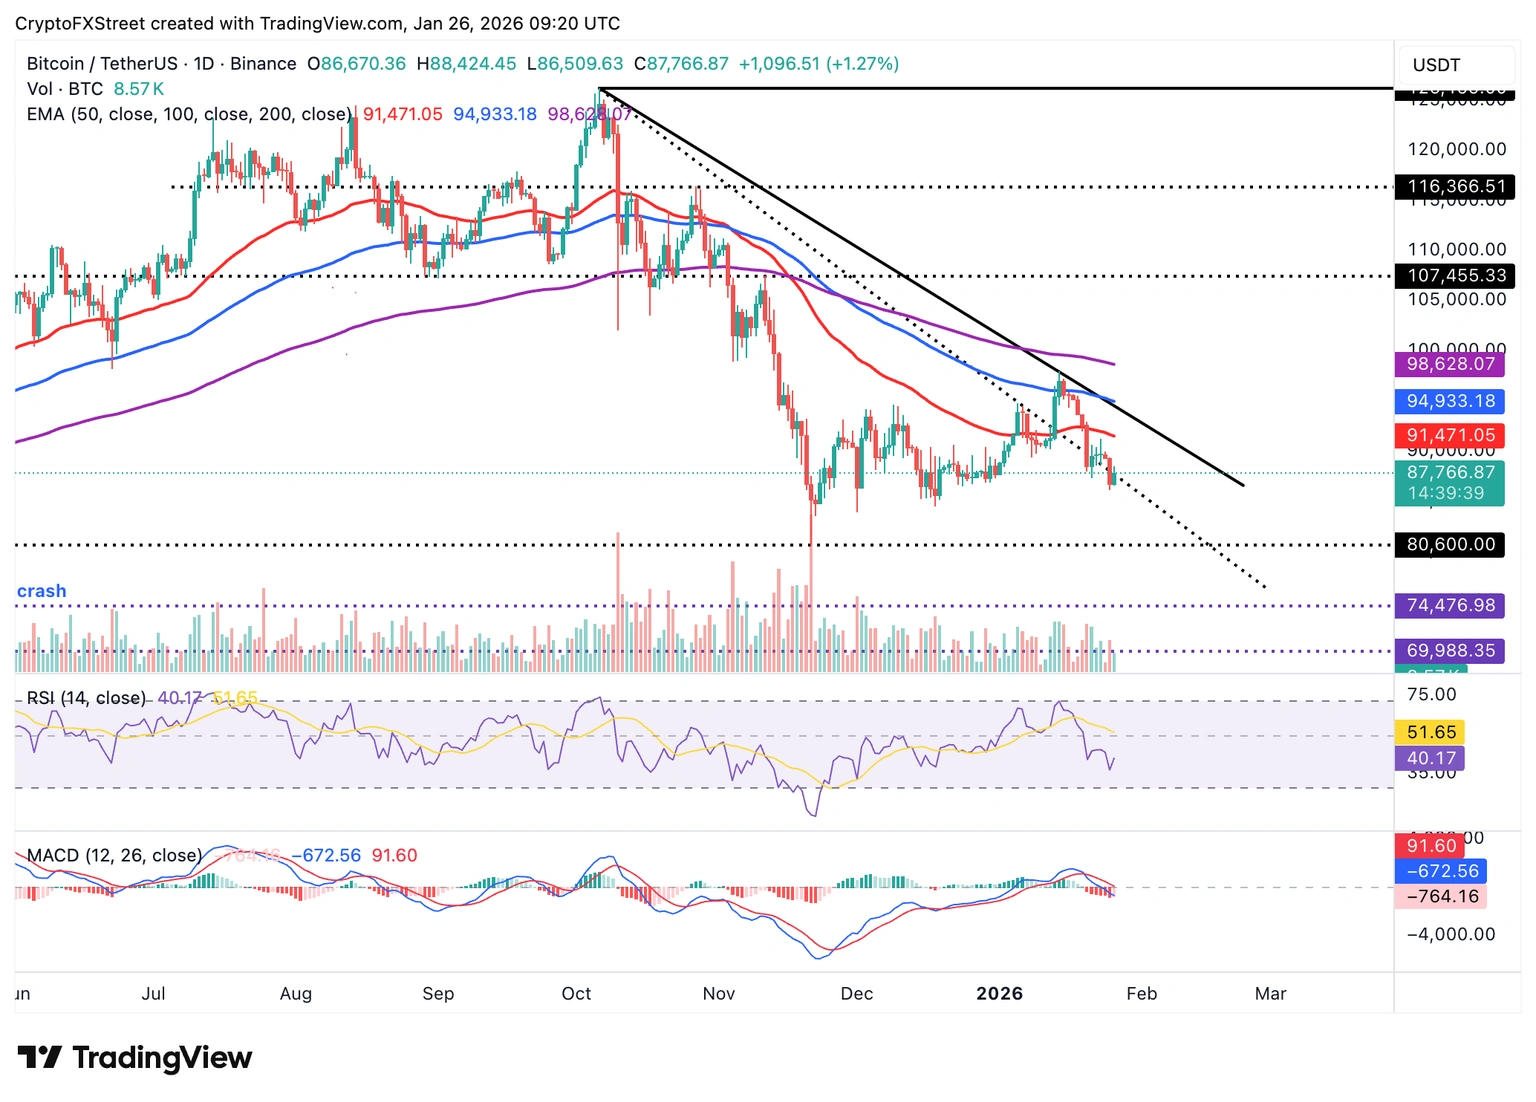
Daily Chart: Bitcoin Price Rises with Slight Drop in Pressure
Bitcoin is aiming for a short-term breakout above the $90,000 level, with buyers strengthening their control after the sharp volatility experienced last week. The Relative Strength Index (RSI), which rose to 40 on the daily chart, indicates that buyers are trying to maintain key support levels. An RSI above the midline could signal a potential shift from a bearish to a bullish trend, while Bitcoin overcoming obstacles toward the psychological level of $100,000.
However, the Moving Average Convergence Divergence (MACD) on the same ch
BTC-0,39%
- Reward
- 1
- 1
- Repost
- Share
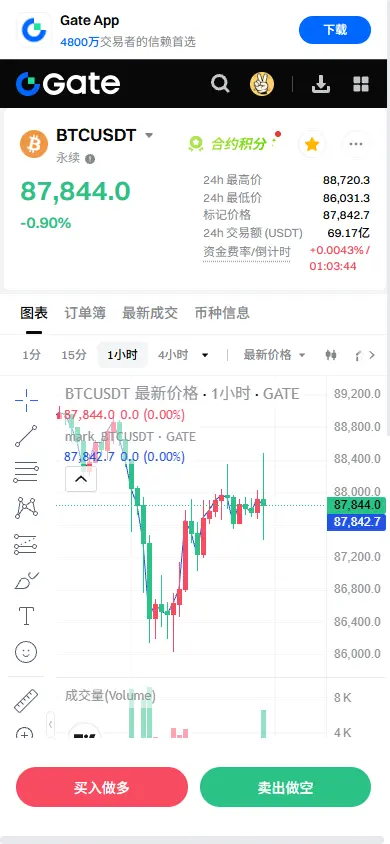
Before00zero:
The price of Bitcoin rose to around $88,000 after a volatile week and increasing risks of another US government shutdown.MYJB
蚂蚁金币
Created By@MunanYiBufan
Listing Progress
100.00%
MC:
$8.6K
Create My Token
- Reward
- like
- Comment
- Repost
- Share
🇺🇸 US Senate will vote on the Crypto Markey Structure bill tomorrow at 3:00 PM ET.


- Reward
- like
- Comment
- Repost
- Share
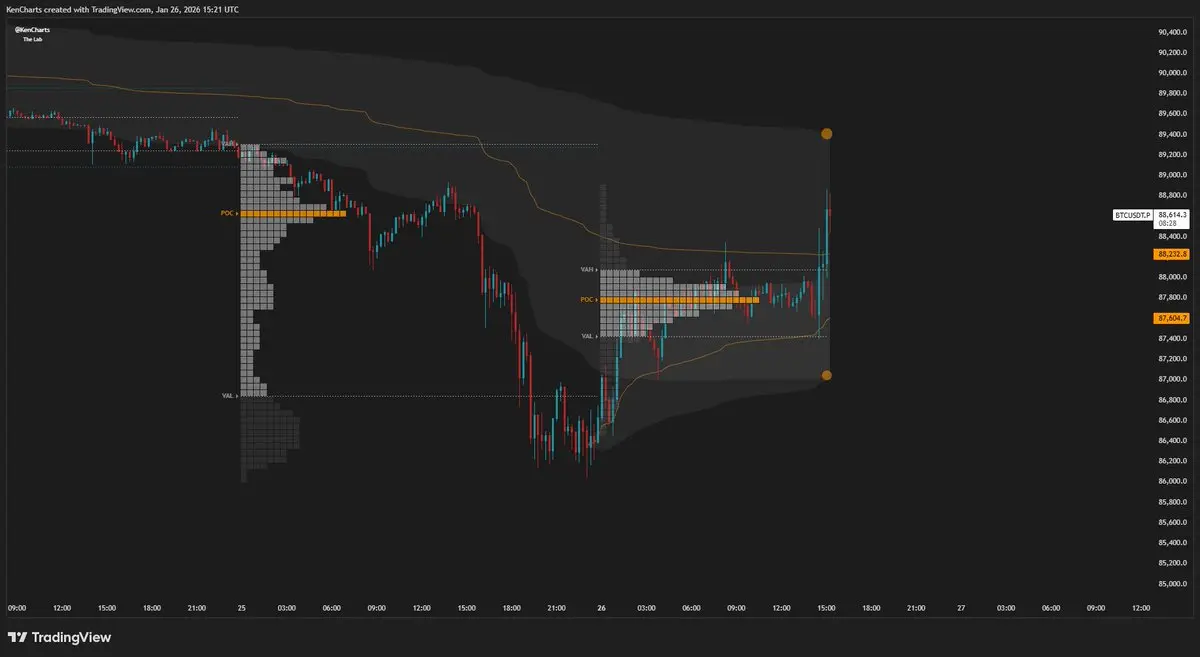
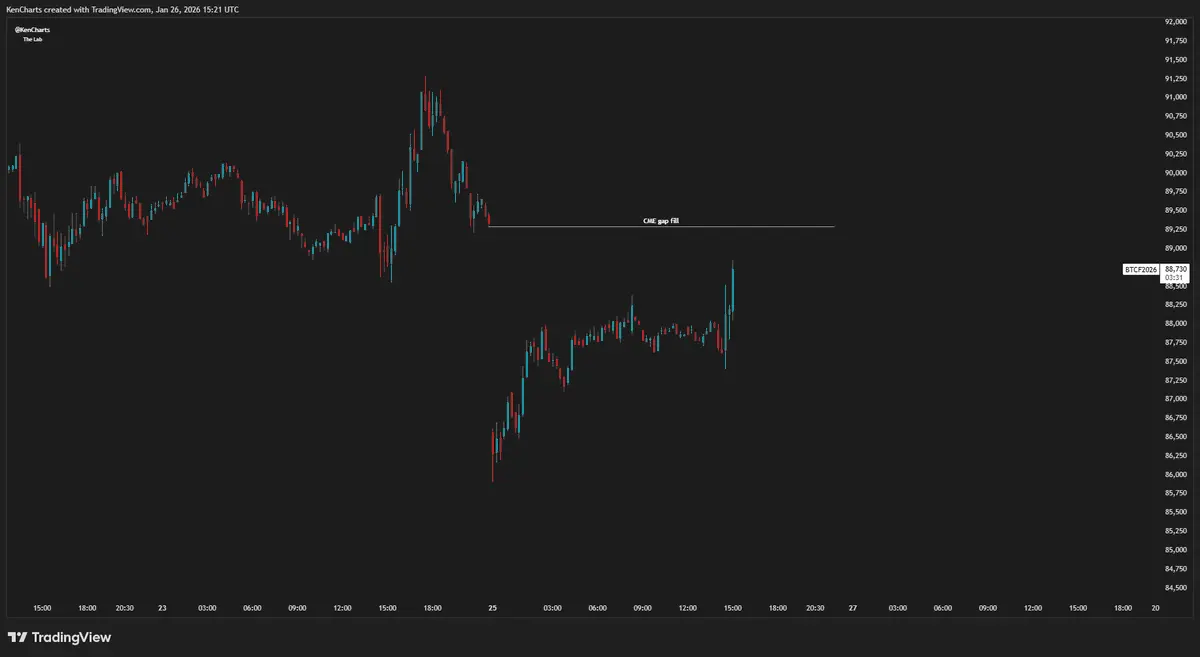
【$BTC Signal】Bullish — Healthy Pullback for Accumulation Pattern
$BTC After reaching a new high, the price is experiencing a healthy pullback, consolidating above the key breakout zone. This is a typical absorption of buy orders and rebalancing of long positions, rather than a trend reversal.
🎯 Direction: Long
🎯 Entry: 87,500 - 88,200
🛑 Stop Loss: 86,500 ( Rigid stop loss, invalidates the structure if broken )
🚀 Target 1: 90,500
🚀 Target 2: 92,500
$BTC The pullback from the high is limited, with increased volume and high open interest, indicating this is a shakeout rather than a main f
BTC-0,39%
- Reward
- like
- Comment
- Repost
- Share
Very optimistic about Bitcoin's market in February 2026
View Original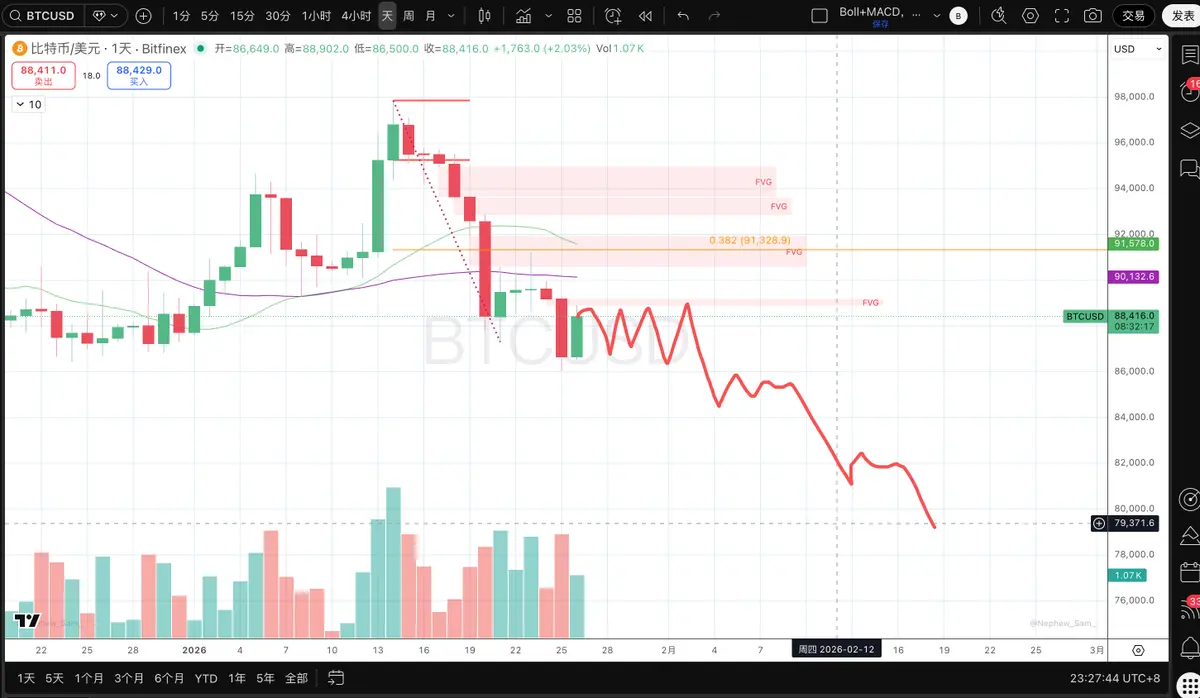
- Reward
- like
- Comment
- Repost
- Share

- Reward
- like
- Comment
- Repost
- Share
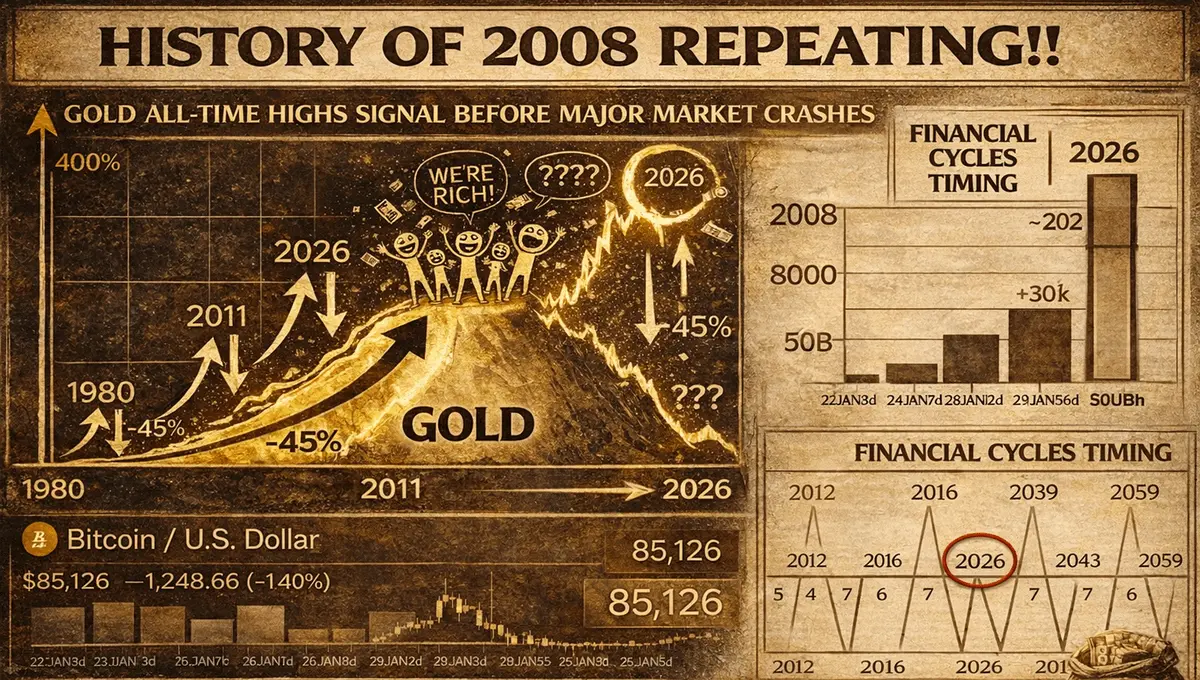
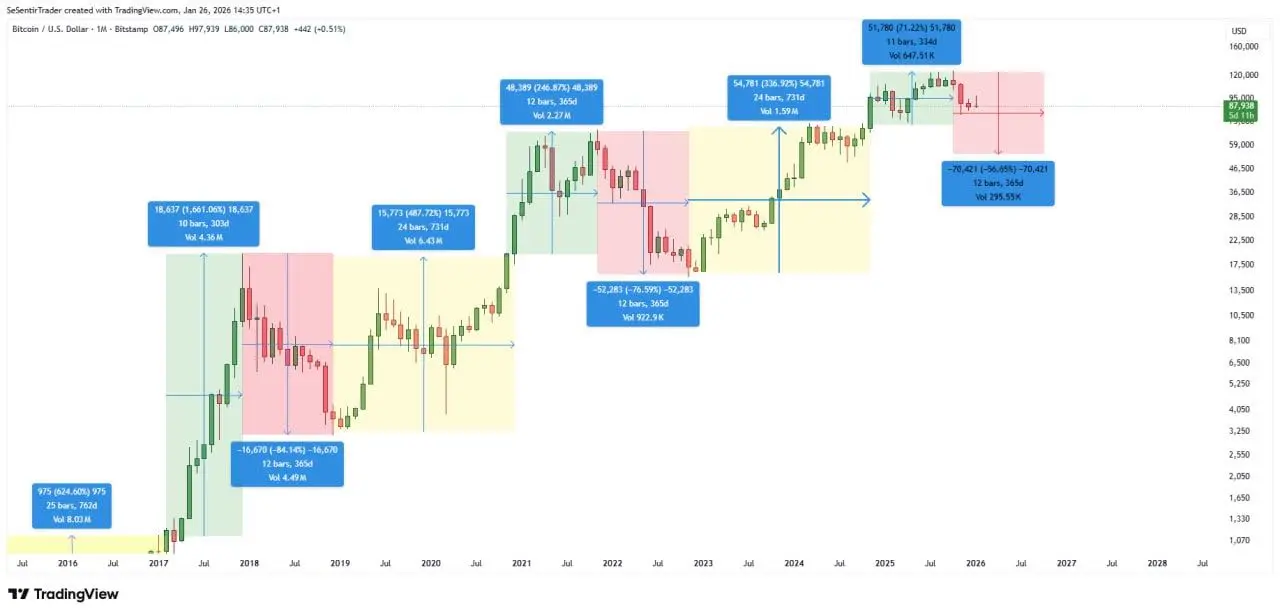
$BTC Monthly Chart — The Four-Year Cycle Is Repeating
I believe the best indicator for understanding Bitcoin's long-term trend remains the four-year cycle theory. It has never failed, not even last year.
For those unfamiliar, since 2013, Bitcoin has experienced 3 market cycles, each comprising the following phases:
▪️2 years of steady growth (yellow part of the chart)
▪️1 year of a bull market (green part of the chart)
▪️1 year of a bear market (red part of the chart)
The bull market phase peaked in October 2025 and then ended. We are currently in the bear market phase, which is expected to l
BTC-0,39%
- Reward
- 2
- Comment
- Repost
- Share
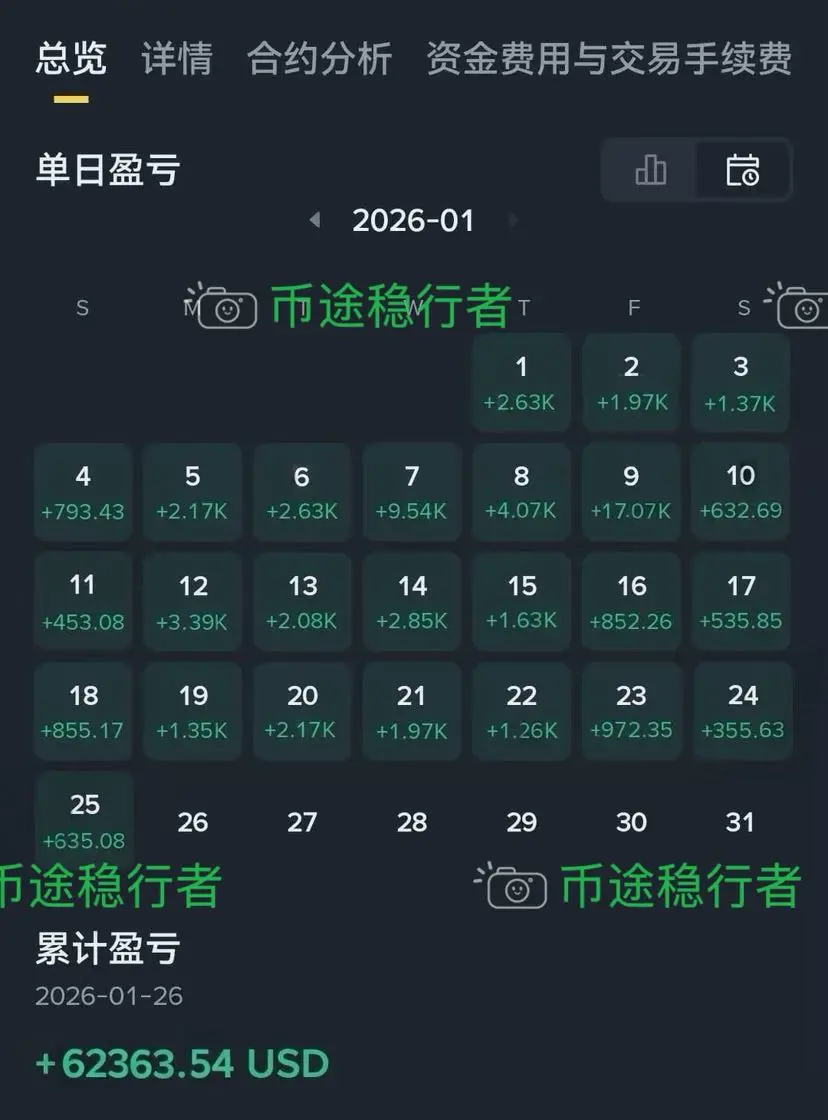
# This is a general summary of 2025🔥🔥🔥
View Original- Reward
- 1
- Comment
- Repost
- Share
Load More
Join 40M users in our growing community
⚡️ Join 40M users in the crypto craze discussion
💬 Engage with your favorite top creators
👍 See what interests you
Trending Topics
View More12.76K Popularity
92.6K Popularity
65.21K Popularity
17.81K Popularity
37.59K Popularity
Hot Gate Fun
View More- MC:$3.63KHolders:21.27%
- MC:$0.1Holders:10.00%
- MC:$0.1Holders:10.00%
- MC:$3.38KHolders:10.00%
- MC:$3.38KHolders:10.00%
News
View MoreThe U.S. Senate Agriculture Committee has rescheduled the review of the Crypto Market Structure Act to January 29.
3 m
Spot silver and New York futures silver both break above the $111 level
4 m
Morgan Stanley: Gold prices may rise to $5,700
4 m
Benchmark: If the Market Structure Act does not pass, the US crypto market will fall into a "structural constraint"
9 m
The S&P 500 Index continues its rally, hitting a one-week high with a 0.4% increase.
10 m
Pin