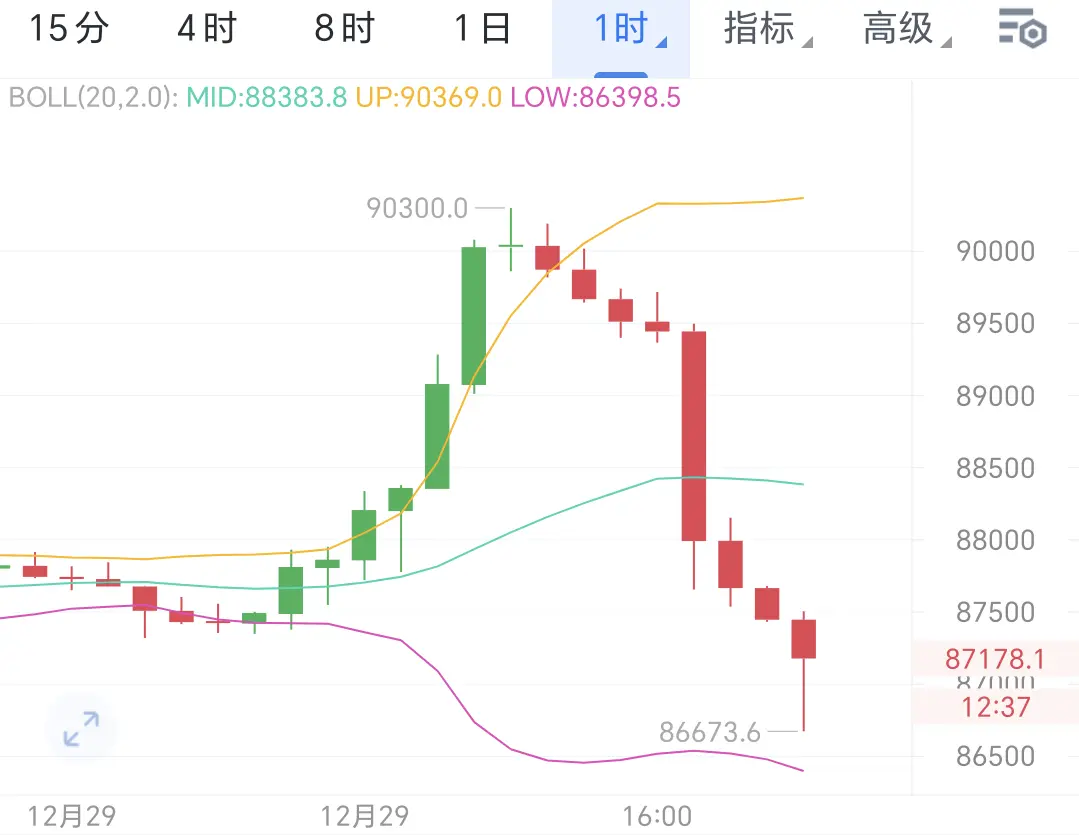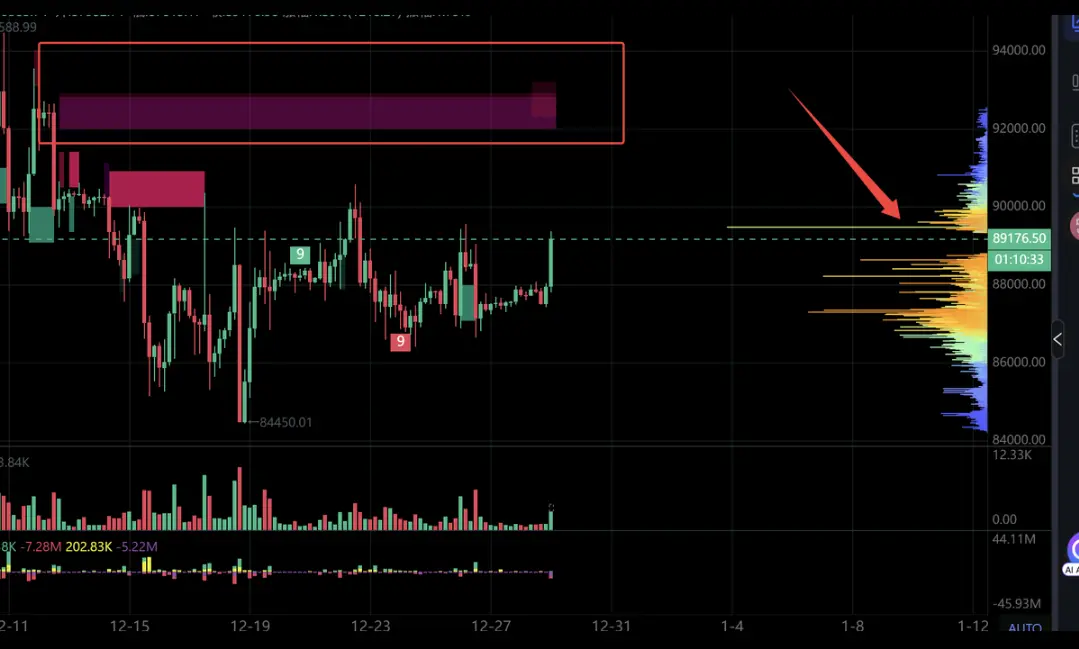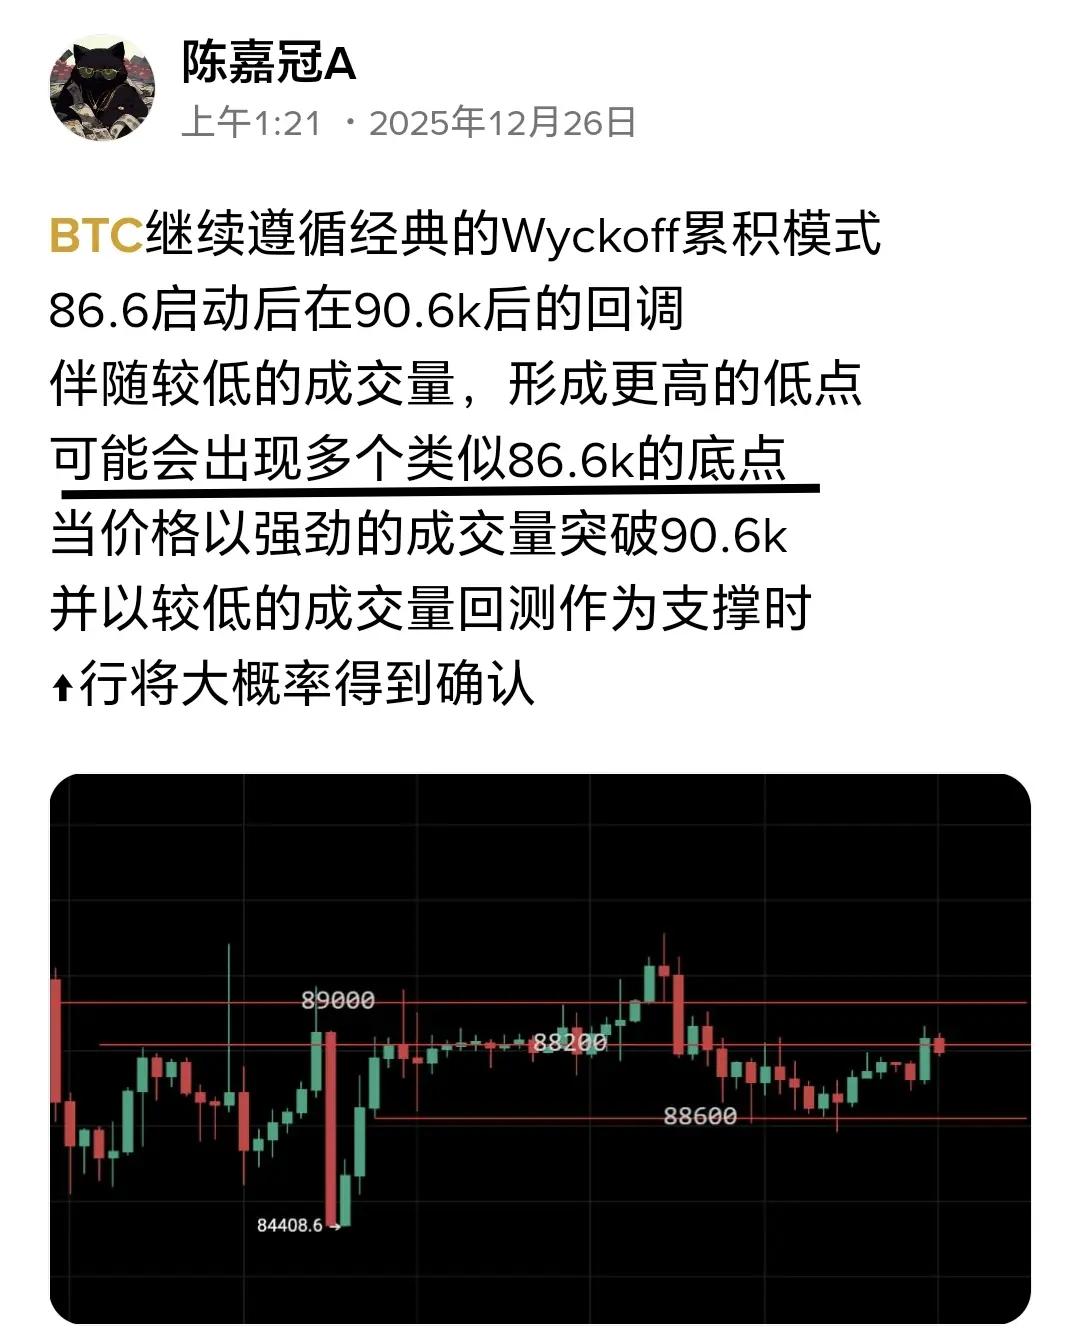
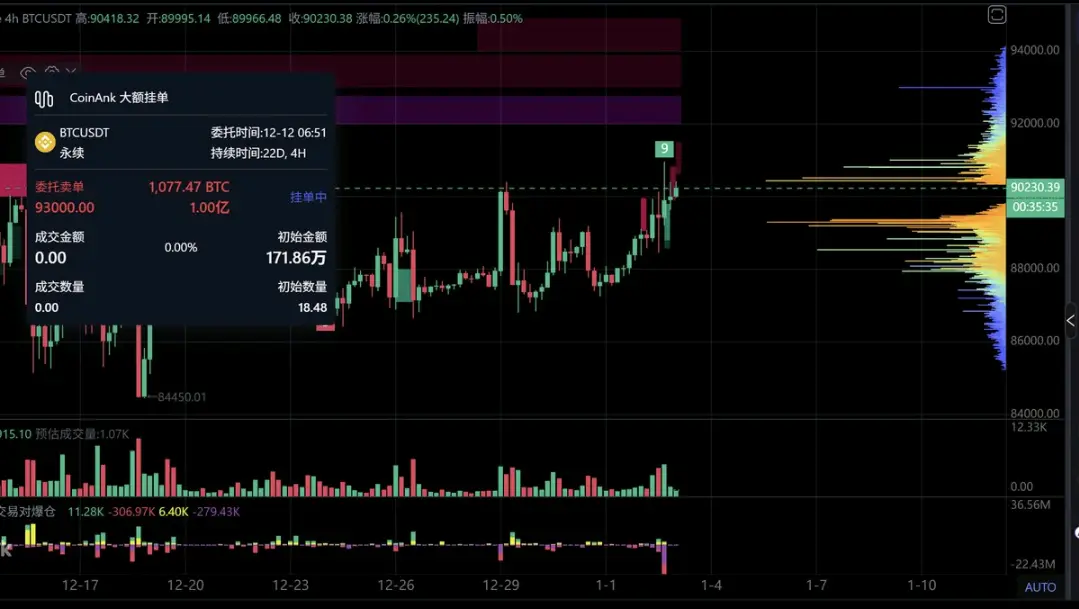


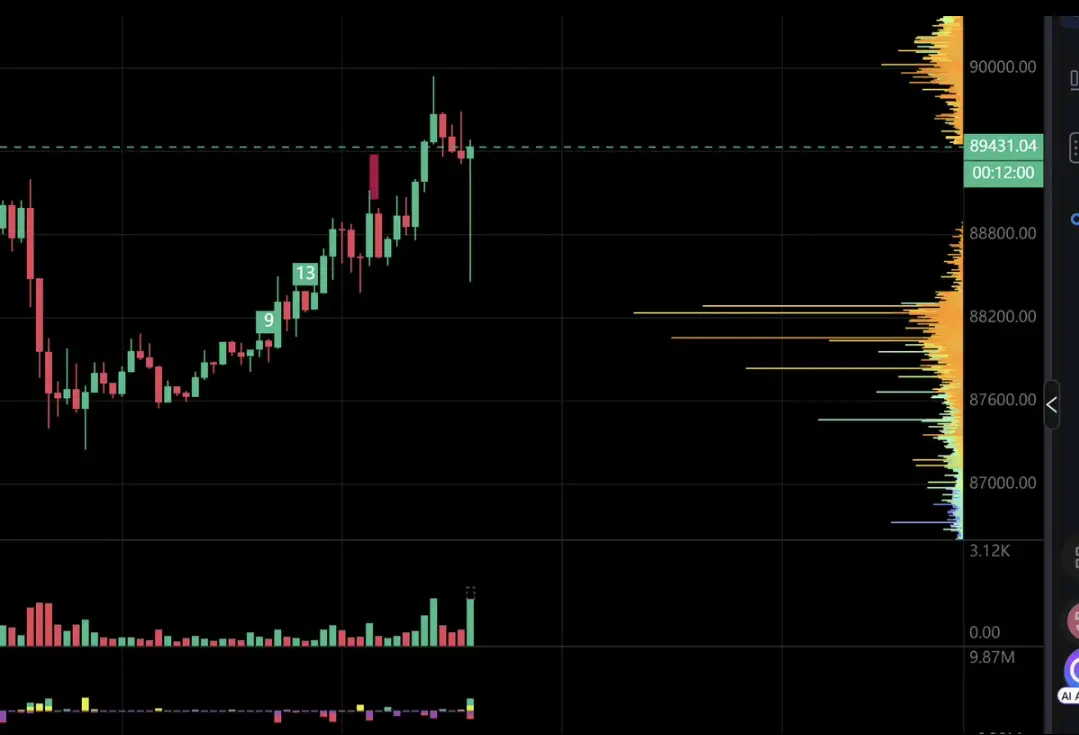


ETH's current market trend is still in a range-bound oscillation
Resistance at 3050 above, support at 2880 below
Still valid, mainly focusing on buying the dips
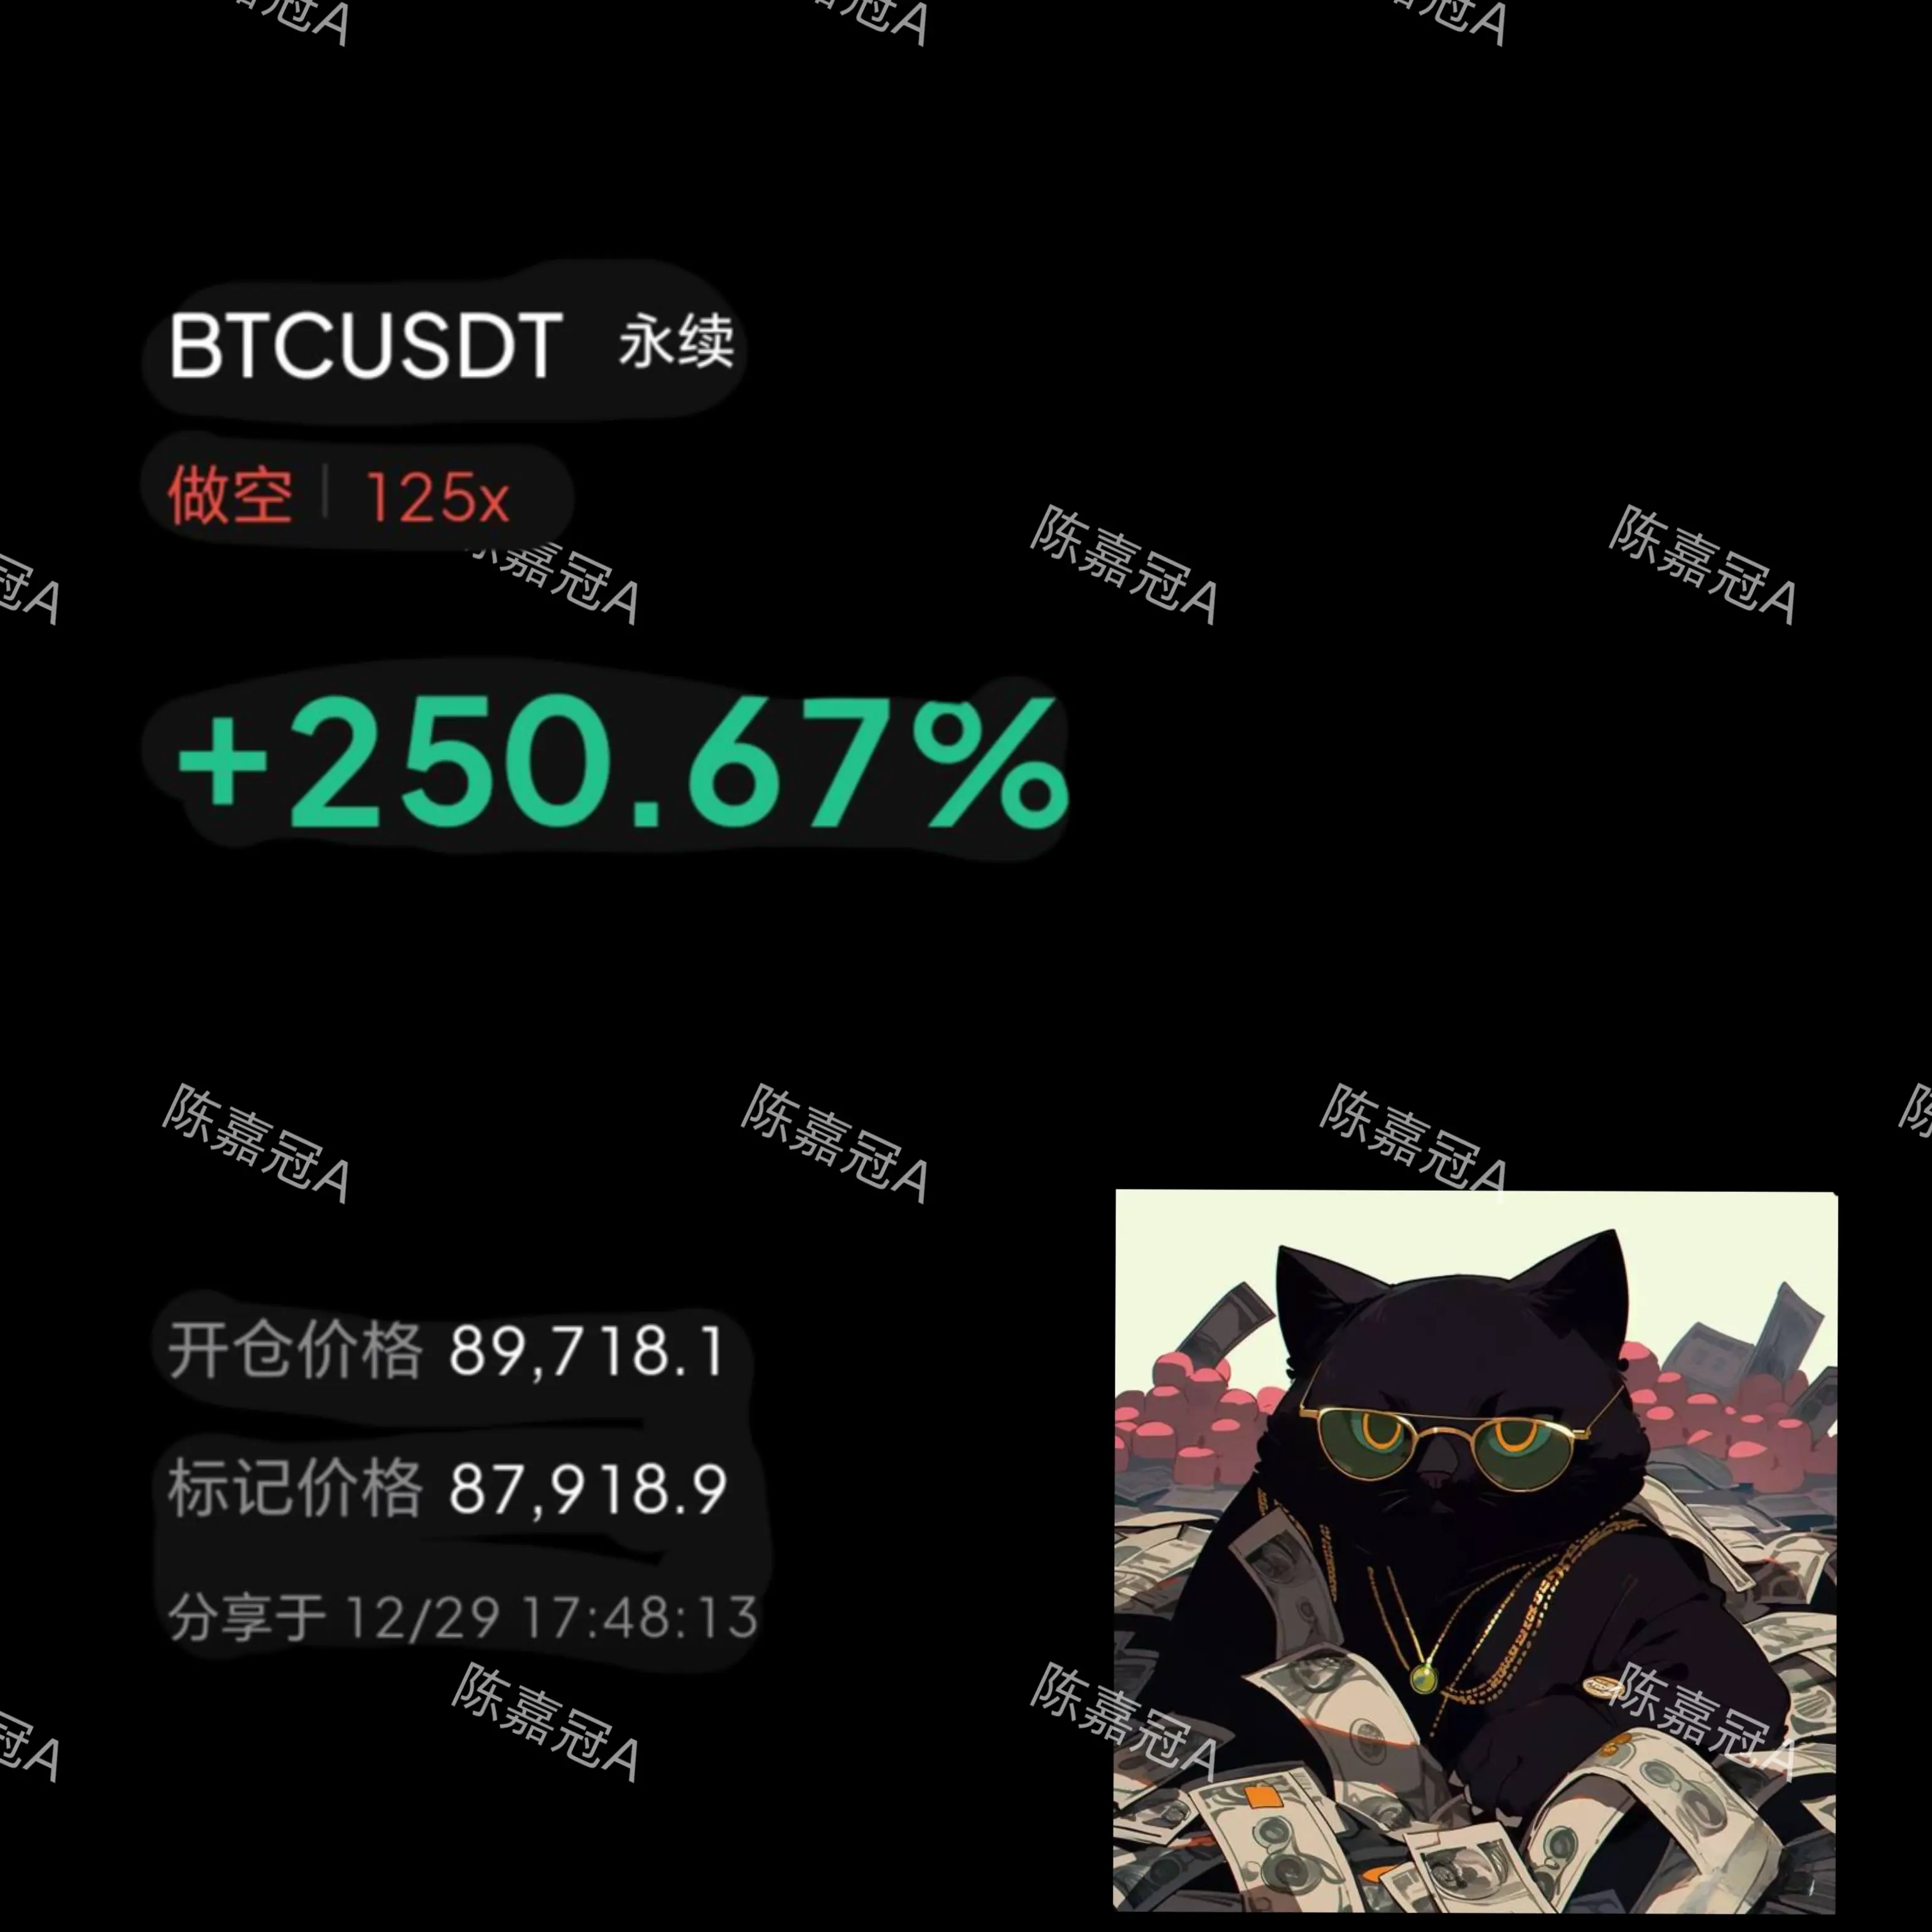
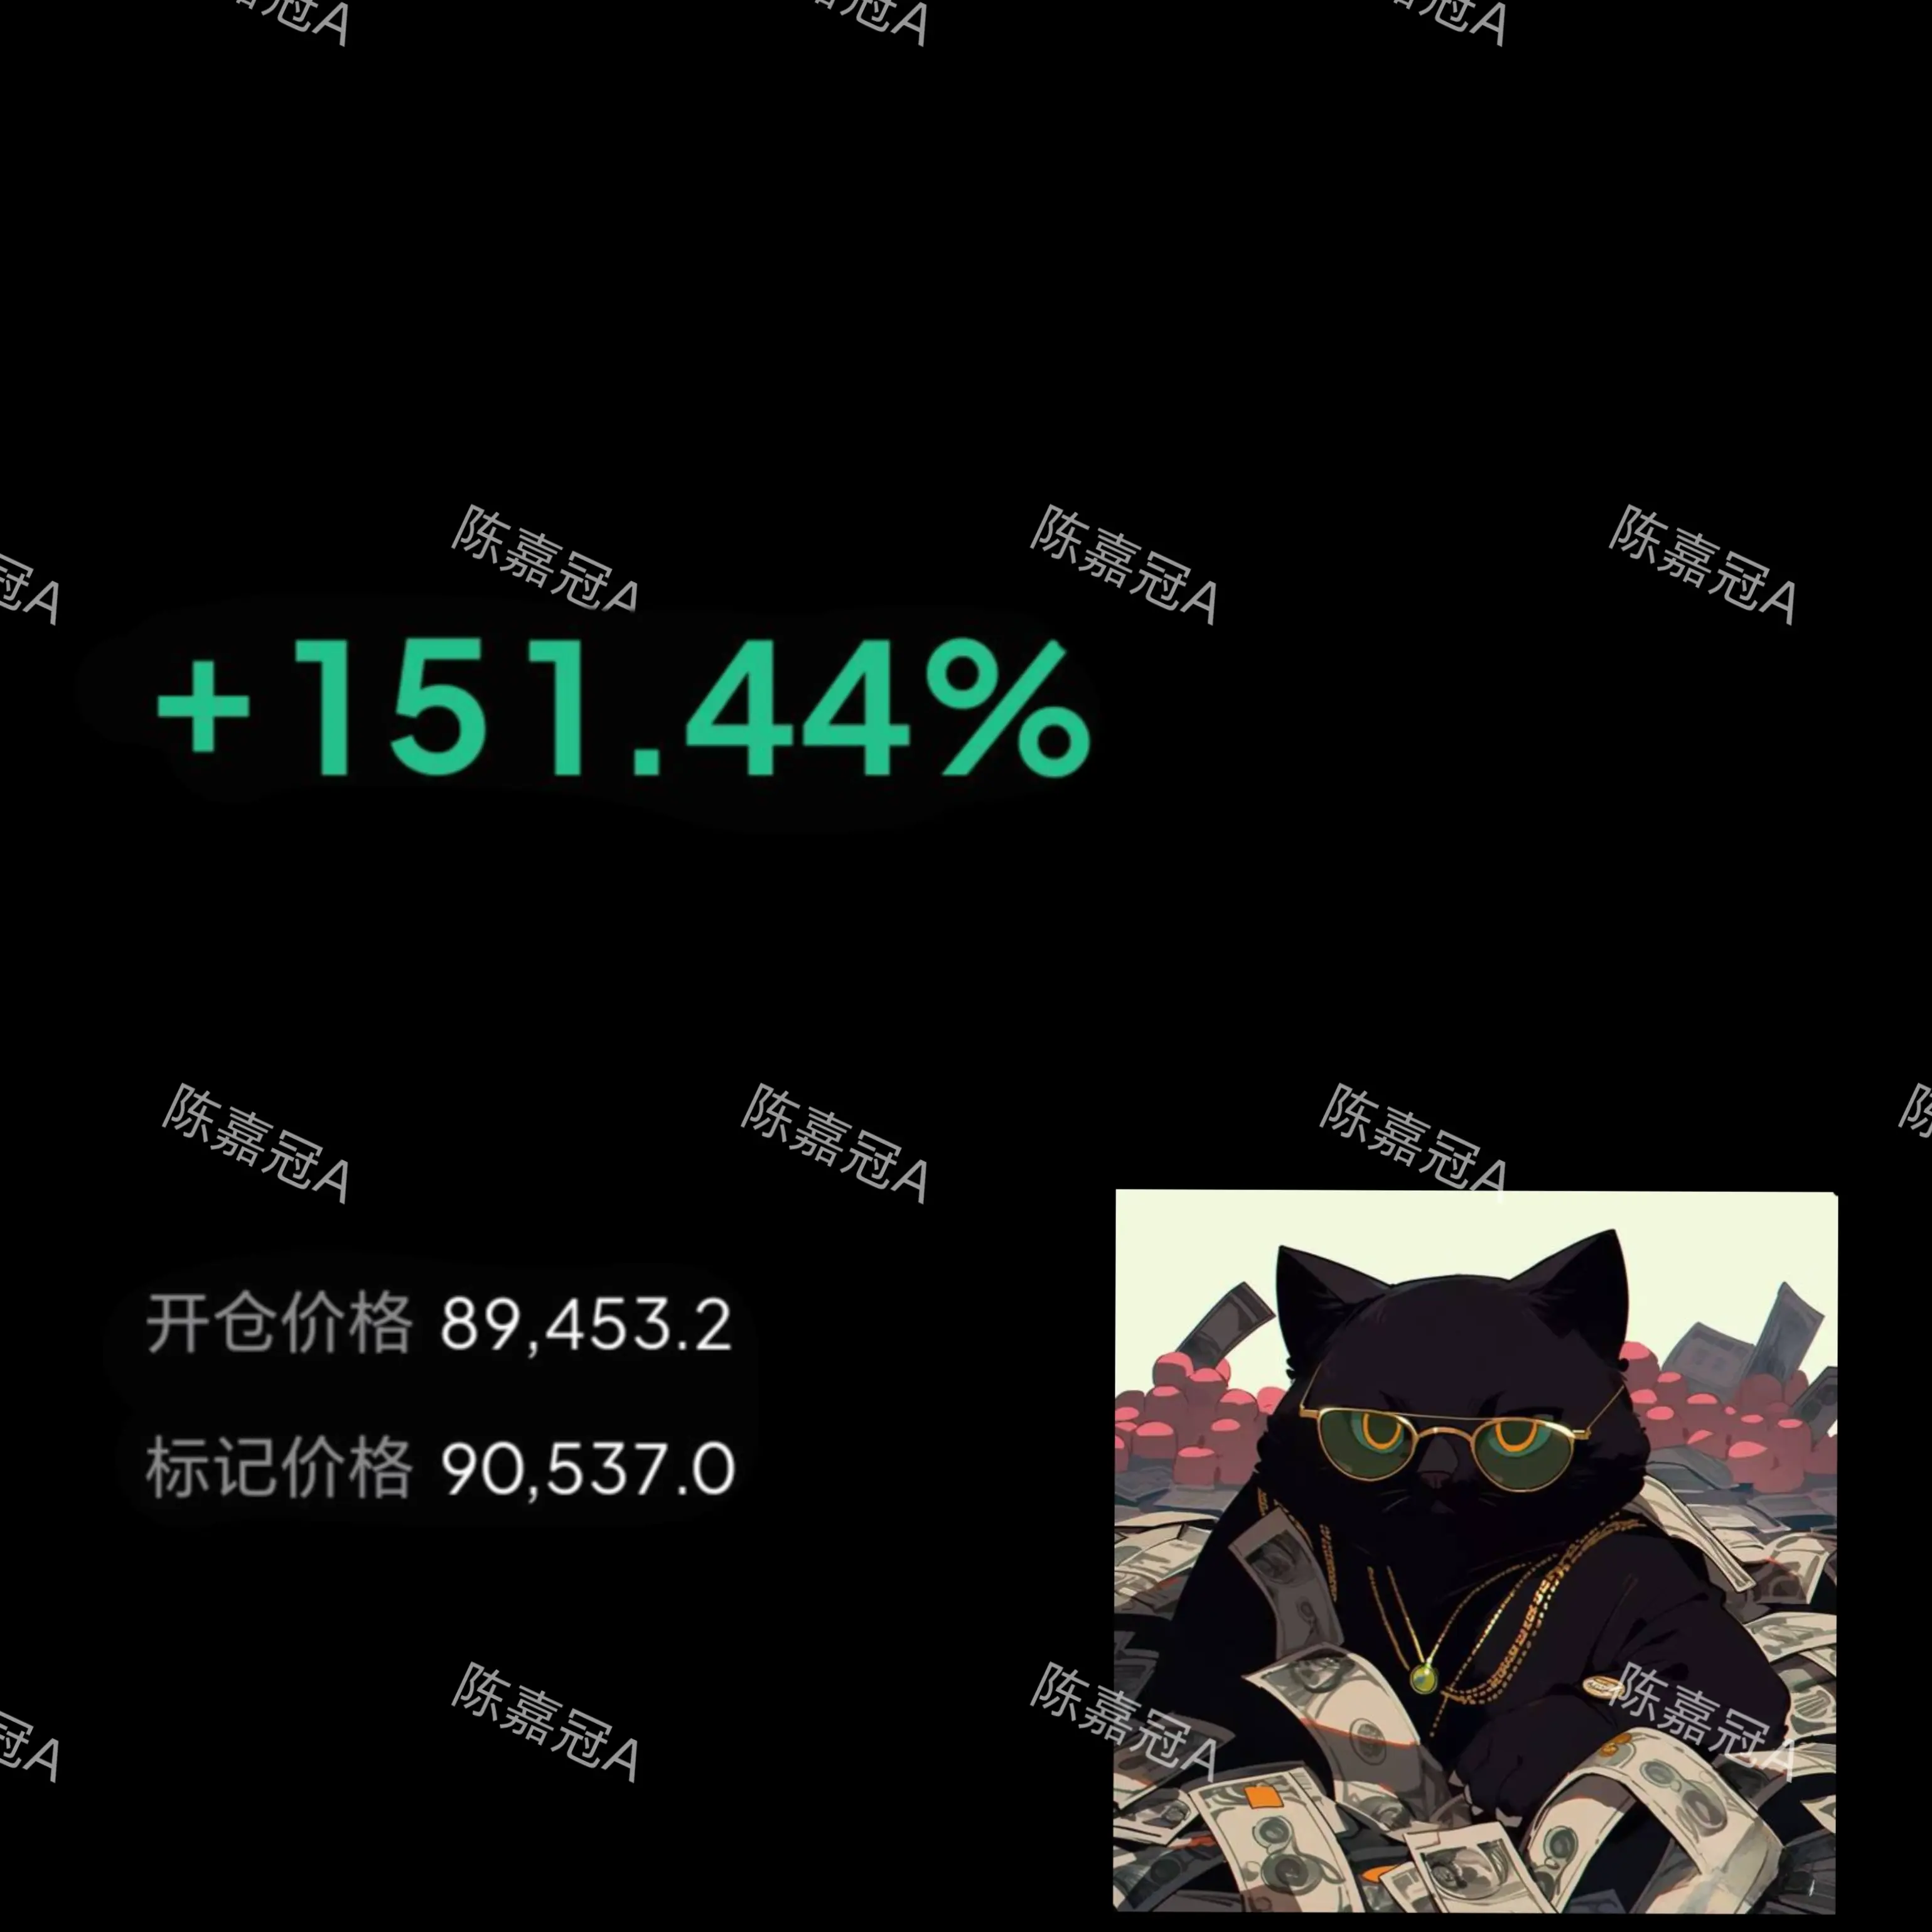
Once retail investors develop a habit of shorting at high points
I feel it will directly soar to the sky
Completely wiping out the shorts
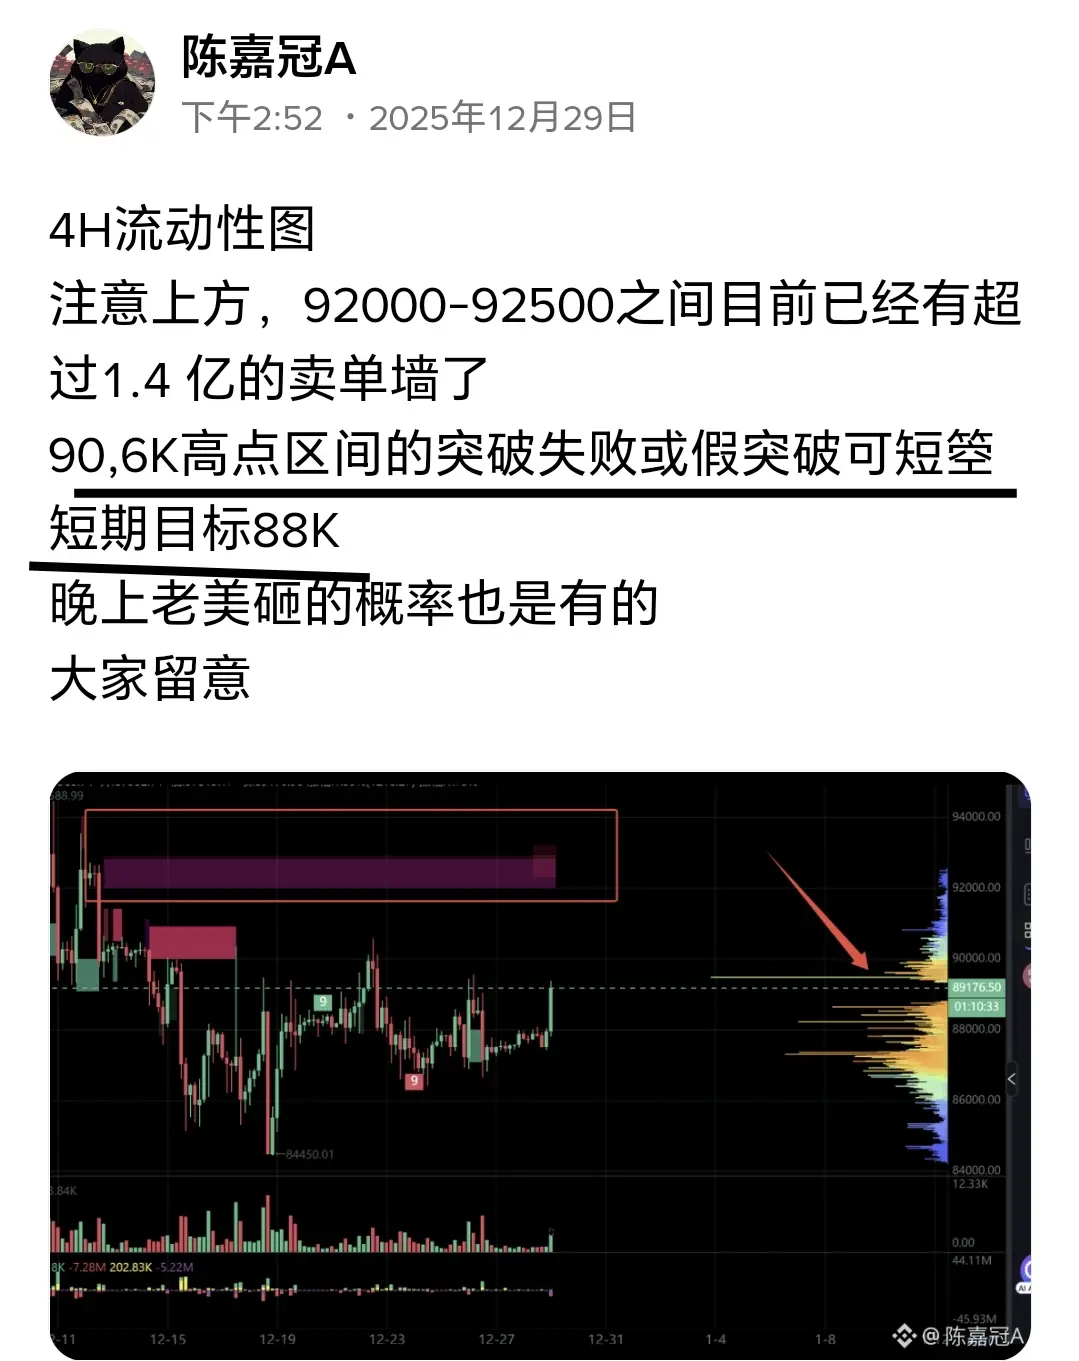
Resistance at 3050 above, support at 2880 below
Still valid, mainly focusing on buying the dips
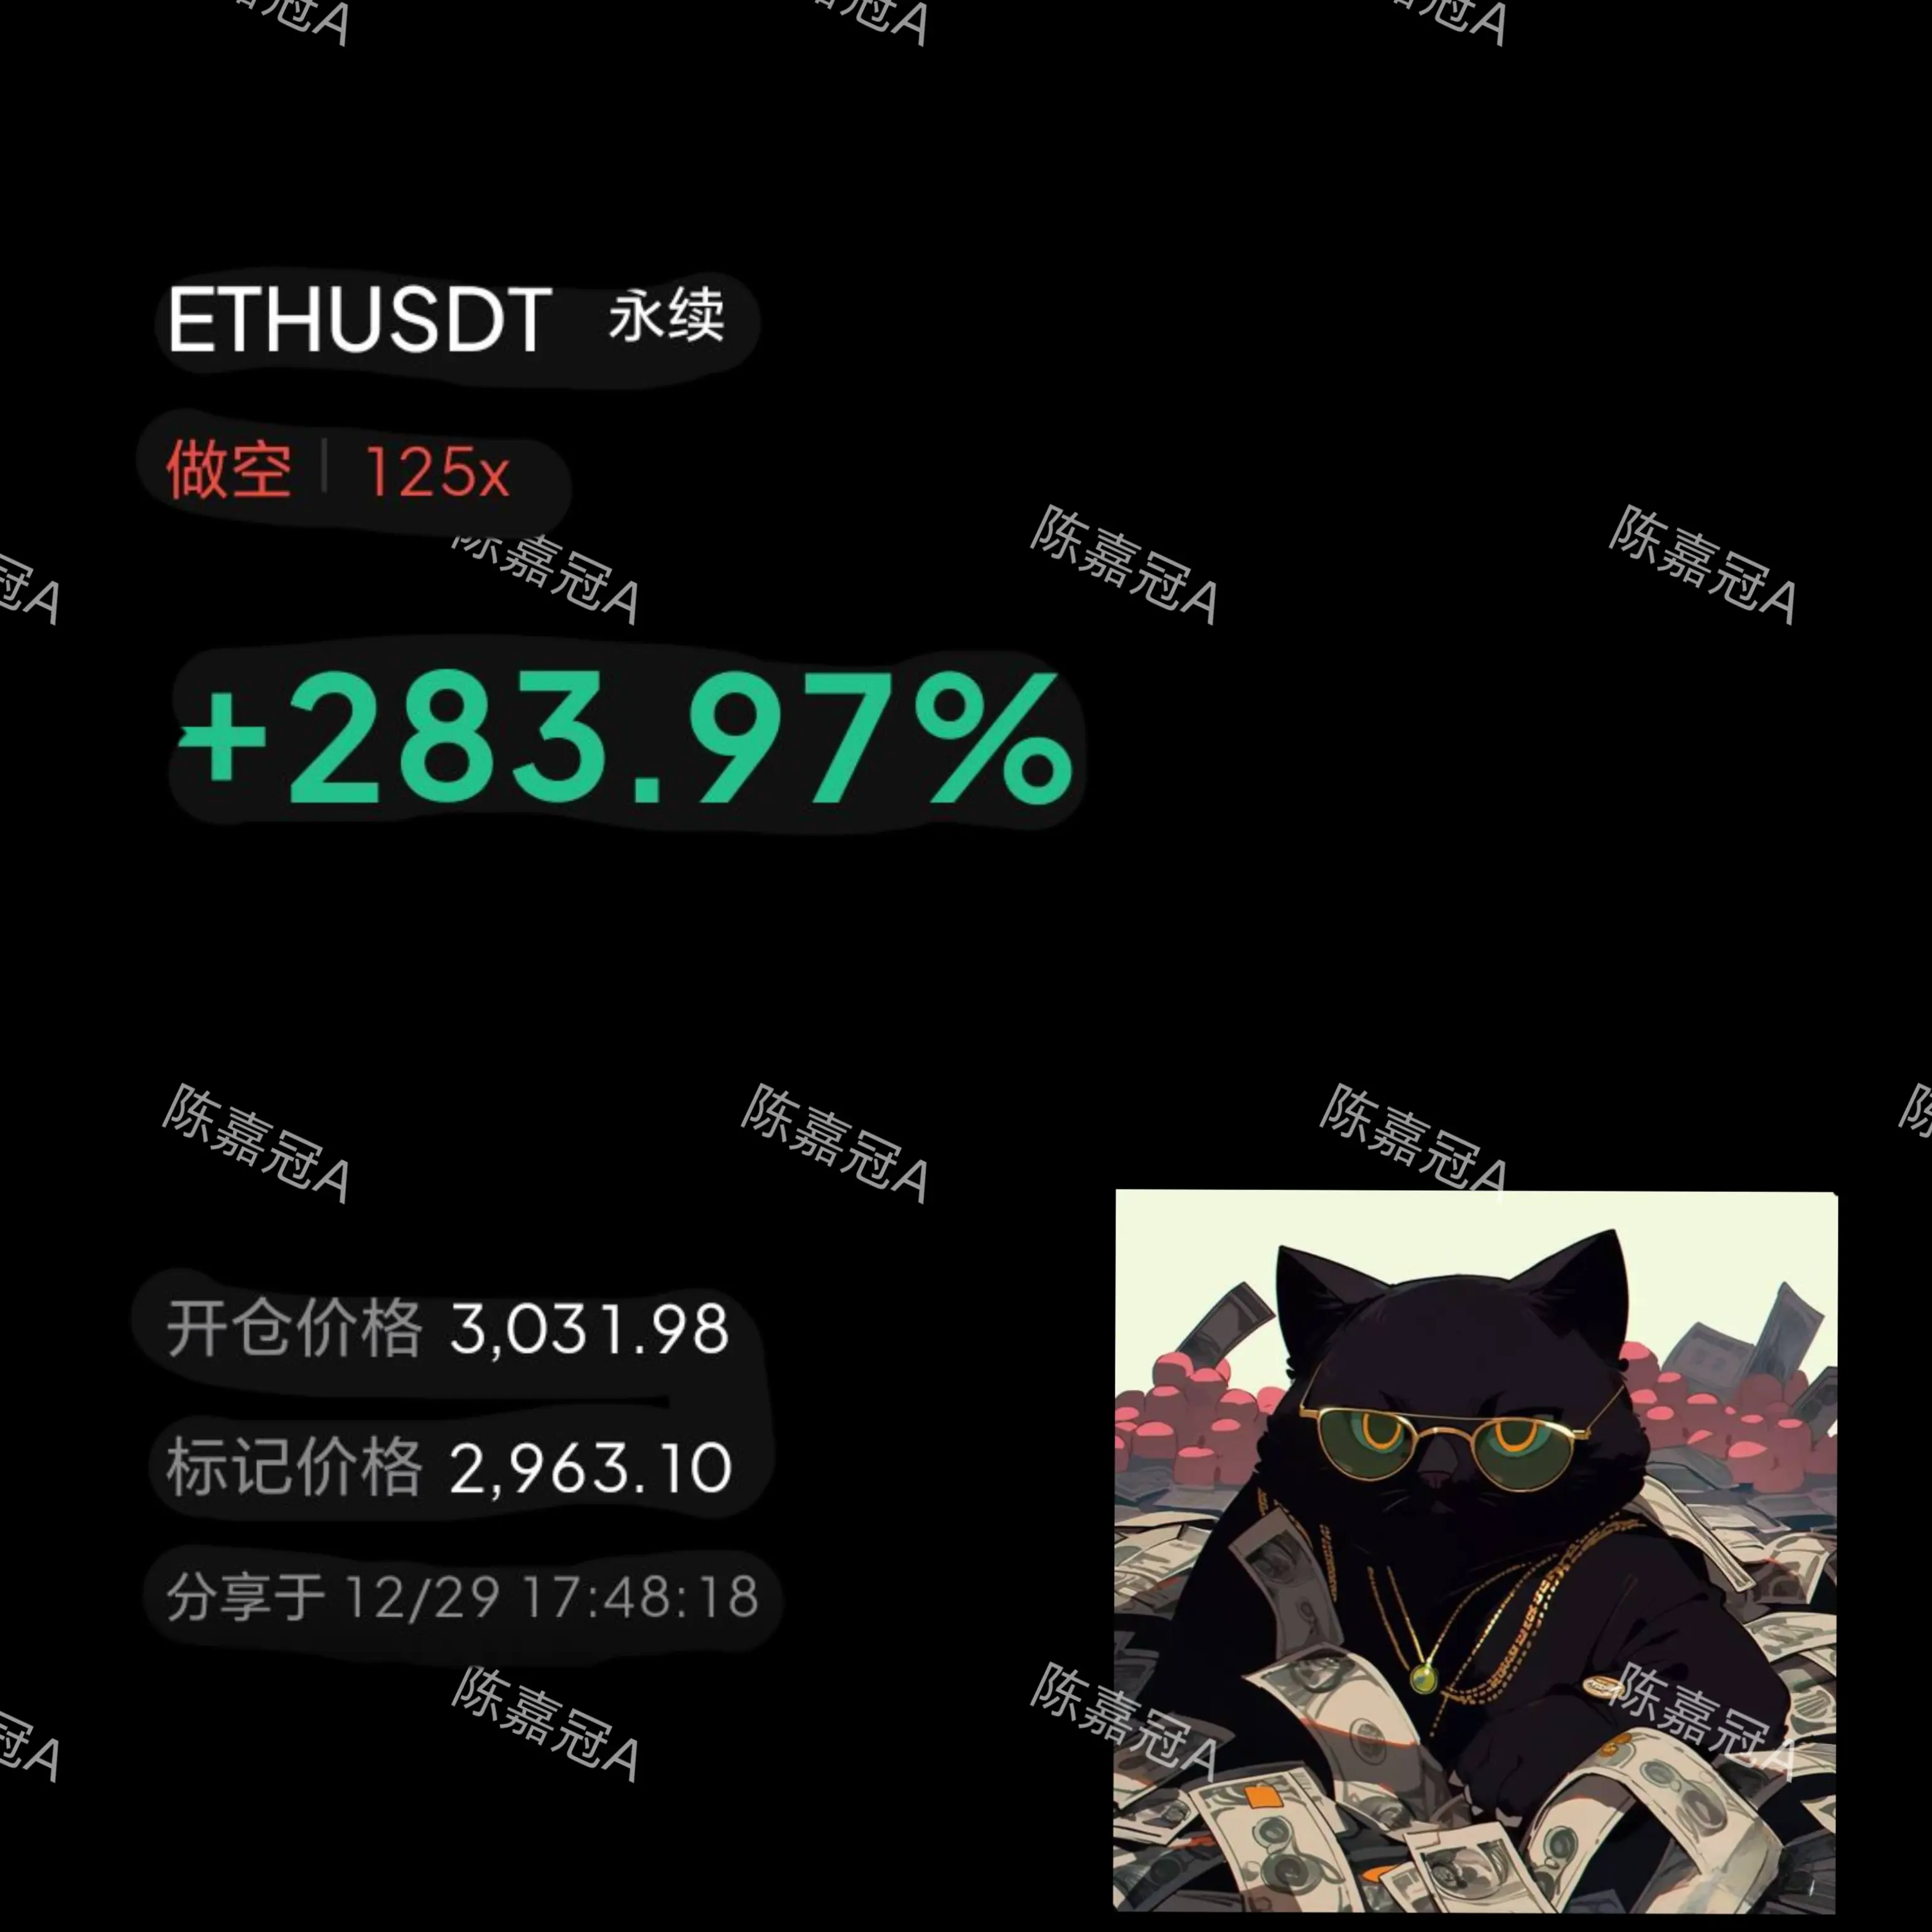
Once retail investors develop a habit of shorting at high points
I feel it will directly soar to the sky
Completely wiping out the shorts
ETH-0,29%