2025 ARB Fiyat Tahmini: Arbitrum'un Yerel Token'ı İçin Piyasa Trendleri ve Olası Büyüme Faktörlerinin Analizi


Giriş: ARB'nin Piyasa Konumu ve Yatırım Potansiyeli
Arbitrum (ARB), Ethereum ağında öncü bir ölçeklendirme çözümü olarak kurulduğu günden bu yana dikkat çekici başarılar elde etti. 2025 yılı itibarıyla Arbitrum'un piyasa değeri $1.765.906.483 düzeyine ulaşırken, dolaşımdaki arz yaklaşık 5.403.630.609 token ve fiyatı $0,3268 civarında seyrediyor. “Layer 2 Güç Merkezi” olarak anılan ARB, güvenilirliği koruyarak yüksek işlem hacmi ve düşük maliyetli akıllı kontratlara olanak sağlayan kritik bir role sahip.
Bu makalede, Arbitrum'un 2025-2030 dönemindeki fiyat hareketleri; tarihsel eğilimler, arz-talep dengesi, ekosistem gelişimi ve makroekonomik etkenler ışığında detaylı biçimde analiz edilecek; yatırımcılara profesyonel tahminler ve uygulanabilir stratejiler sunulacaktır.
I. ARB Fiyat Geçmişi ve Güncel Piyasa Durumu
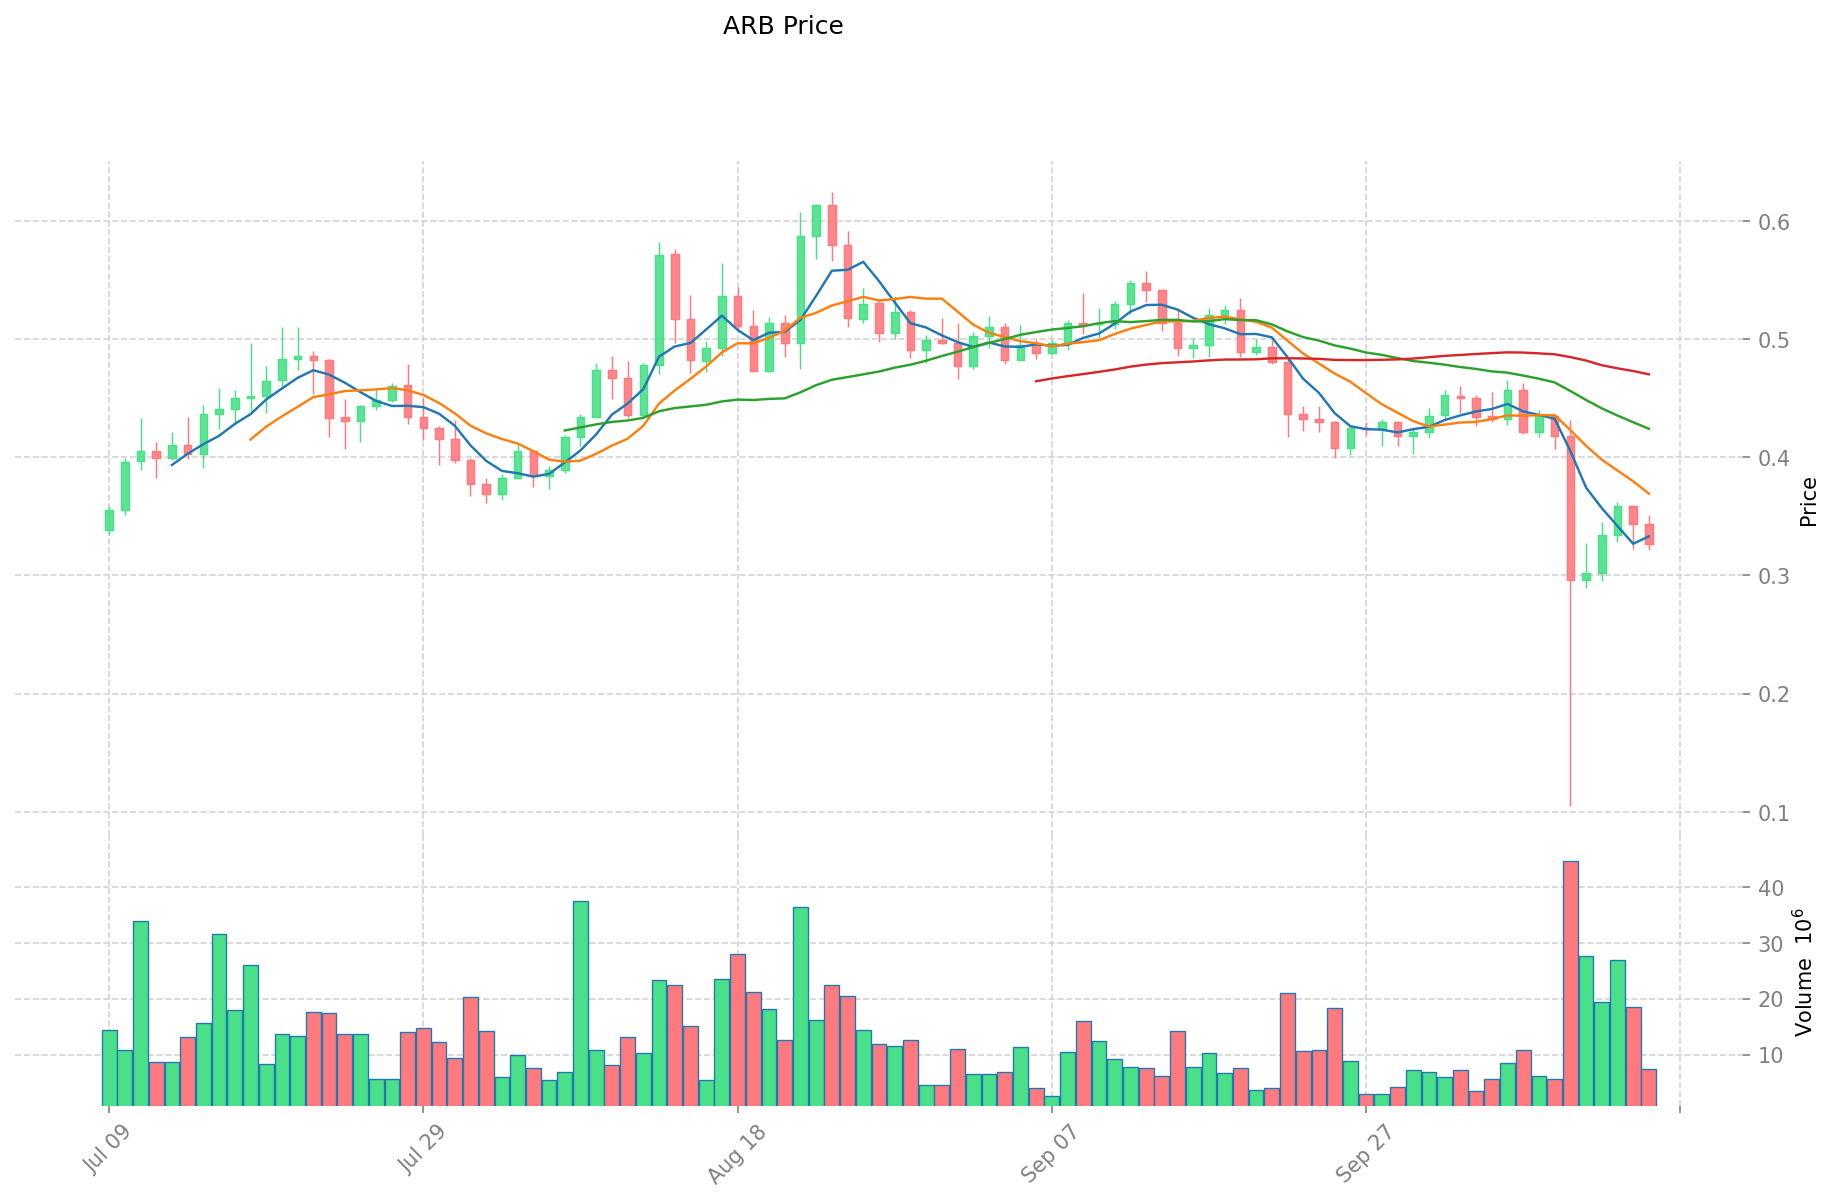
ARB Tarihsel Fiyat Hareketleri
- 2023: ARB token piyasaya sürüldü, 23 Mart'ta fiyatı $4,00 ile zirveye ulaştı
- 2024: Piyasa dalgalıydı, fiyat hareketlerinde oynaklık yaşandı
- 2025: Düşüş eğilimi, 10 Ekim'de fiyat $0,1054 ile tabana indi
ARB Mevcut Piyasa Durumu
16 Ekim 2025 itibarıyla ARB, $0,3268 fiyatla işlem görüyor ve kripto para piyasasında 65. sırada yer alıyor. Son 24 saatte %4,22 değer kaybeden tokenin işlem hacmi $2.509.957,53. Piyasa değeri $1.765.906.483 olan ARB, toplam pazarın %0,081'ini temsil ediyor. Dolaşımdaki arz 5.403.630.609 ARB ile toplam arzın %54,04’üne denk. Haftalık kayıp %24,33, son 30 gün ve 1 yıl fiyat değişimleri ise sırasıyla -%33,32 ve -%42,3. Son saatlik işlemlerde ise ARB %1,04 oranında toparlanma gösteriyor.
Güncel ARB piyasa fiyatını görüntüleyin
ARB Piyasa Duyarlılığı Göstergesi
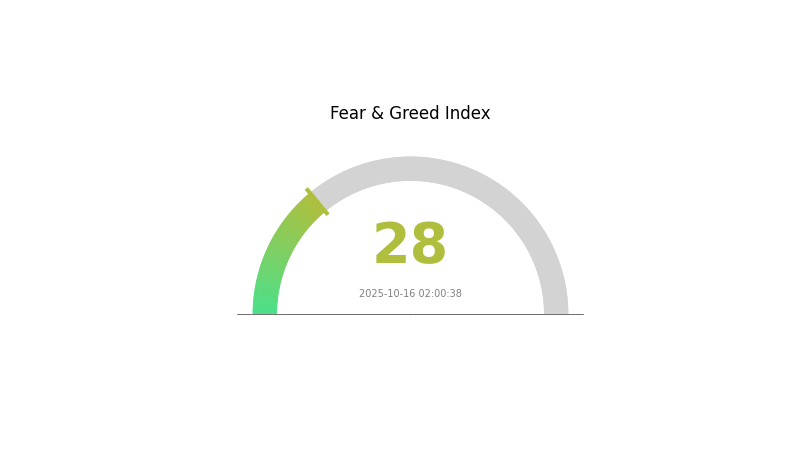
16 Ekim 2025 Korku ve Açgözlülük Endeksi: 28 (Korku)
Güncel Korku & Açgözlülük Endeksi'ni görüntüleyin
Kripto piyasasında şu anda korku hakim; Korku ve Açgözlülük Endeksi 28 seviyesinde. Son volatilite veya olumsuz haberler yatırımcıları temkinli davranmaya yöneltiyor. Böyle dönemlerde bazı yatırımcılar karşıt yatırım stratejisiyle alım fırsatı arayabilir; ancak, yatırım yapmadan önce mutlaka kapsamlı araştırma yapılmalı ve kişisel risk toleransı dikkate alınmalıdır. Gate.com araçları ile piyasa trendlerini yakından takip edin.
ARB Varlık Dağılımı
Adres bazlı varlık dağılımı verileri, ARB tokenlerinin cüzdanlar arasında ne kadar yoğunlaştığını ortaya koyuyor. Analizler, ARB arzının %45,96'sının en büyük adreste toplandığını gösteriyor. İlk beş adres toplamda %57,66'lık hakimiyet ile merkeziyet oranının yüksek olduğunu kanıtlıyor.
Böyle bir yoğunlaşma, olası piyasa manipülasyonu ve fiyat oynaklığı riskini artırıyor. En büyük adresin, toplam arzın neredeyse yarısına sahip olması, büyük işlemlerle piyasayı ciddi şekilde etkileyebilir. Diğer adreslerdeki dağılımın düşük olması (%42,34), piyasa likiditesinin ve dolaşımının sınırlı olabileceğine işaret ediyor.
Kripto piyasalarında belirli derecede yoğunlaşma doğal olsa da, mevcut ARB dağılımı merkeziyetsizlik açısından ideal değil. Bu yapı, tokenin piyasa şoklarına karşı dayanıklılığı ve uzun vadeli istikrarını olumsuz etkileyebilir. Zaman içindeki dağılım değişimi, ARB'nin piyasa yapısı ve on-chain istikrarı için yakından izlenmeli.
Güncel ARB Varlık Dağılımı'nı görüntüleyin
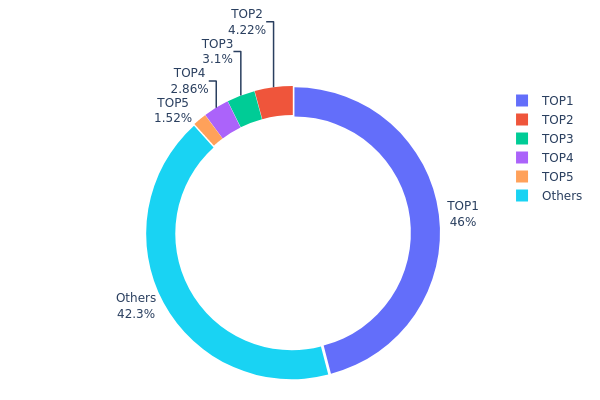
| En Üst | Adres | Varlık Miktarı | Varlık (%) |
|---|---|---|---|
| 1 | 0x611f...dfb09d | 88.610,92K | 45,96% |
| 2 | 0x91d4...c8debe | 8.138,21K | 4,22% |
| 3 | 0x0529...c553b7 | 5.985,39K | 3,10% |
| 4 | 0xb0a2...113d64 | 5.521,88K | 2,86% |
| 5 | 0x92ea...e3d4ea | 2.939,25K | 1,52% |
| - | Diğerleri | 81.594,52K | 42,34% |
II. ARB'nin Gelecekteki Fiyatını Etkileyecek Temel Unsurlar
Arz Mekanizması
- Token Kilidinin Açılması: 16 Ekim 2025’te, 92,65 milyon ARB tokenin kilidi açılacak ve yaklaşık $31,09 milyon değerinde piyasaya sürülecek; bu miktar dolaşımdaki arzın %1,99’u.
- Kısa Vadeli Etki: Bu kilit açılımı, kısa vadede satış baskısını artırabilir ve fiyatı aşağı çekebilir.
Teknik Gelişim ve Ekosistem Büyümesi
- Ethereum Ölçeklendirme Çözümü: Arbitrum’un Ethereum için Layer 2 ölçeklendirme çözümü olarak işlevi, fiyat performansının ana itici gücü. İşlem maliyetlerini ve ağ tıkanıklığını azaltma yeteneği, benimsenme ve değer açısından belirleyici.
- DeFi Entegrasyonu: Arbitrum, SushiSwap ve Curve gibi önde gelen DeFi protokolleri ile entegre. 31 Ağustos 2023’te akıllı kontratlarında yaklaşık $5,65 milyar değerinde kripto para kitliydi.
- Ekosistem Uygulamaları: DeFi, oyun ve kurumsal çözümler başta olmak üzere Arbitrum üzerinde dApp’lerin büyümesi, ARB değerine kayda değer katkı sağlayabilir.
III. ARB 2025-2030 Fiyat Öngörüleri
2025 Beklentisi
- Tedbirli tahmin: $0,23309 - $0,3283
- Tarafsız tahmin: $0,3283 - $0,40
- İyimser tahmin: $0,40 - $0,45634 (güçlü ekosistem büyümesi ve yaygın benimsenme gerektirir)
2027-2028 Beklentisi
- Piyasa aşaması: Konsolidasyonun ardından yükseliş
- Tahmini fiyat aralığı:
- 2027: $0,2321 - $0,58824
- 2028: $0,2817 - $0,72648
- Temel katalizörler: Layer 2 çözümleri, DeFi büyümesi, kurumsal benimseme
2029-2030 Uzun Vadeli Beklenti
- Temel senaryo: $0,61034 - $0,72325 (istikrarlı piyasa ve benimsenme varsayımıyla)
- İyimser senaryo: $0,72325 - $1,07042 (hızlı ekosistem büyümesi ve piyasada yaygın kabul ile)
- Dönüştürücü senaryo: $1,07042 üzeri (büyük iş birlikleri veya teknolojik atılımlar gibi olağanüstü olumlu koşullarda)
- 2030-12-31: ARB $1,07042 (iyimser projeksiyonlara göre mümkün olan zirve)
| Yıl | Tahmini En Yüksek Fiyat | Tahmini Ortalama Fiyat | Tahmini En Düşük Fiyat | Değişim Oranı |
|---|---|---|---|---|
| 2025 | 0,45634 | 0,3283 | 0,23309 | 0 |
| 2026 | 0,40801 | 0,39232 | 0,36093 | 20 |
| 2027 | 0,58824 | 0,40016 | 0,2321 | 22 |
| 2028 | 0,72648 | 0,4942 | 0,2817 | 51 |
| 2029 | 0,83617 | 0,61034 | 0,58593 | 86 |
| 2030 | 1,07042 | 0,72325 | 0,51351 | 121 |
IV. ARB Profesyonel Yatırım Stratejileri ve Risk Yönetimi
ARB Yatırım Yaklaşımı
(1) Uzun Vadeli Tutma Stratejisi
- Kimler için: Uzun vadeli yatırımcılar ve Arbitrum ekosistemine inananlar
- Operasyonel öneriler:
- Piyasa düşüşlerinde ARB biriktirin
- Arbitrum yönetimine katılarak ek ödül kazanın
- Tokenleri güvenli ve saklama hizmeti olmayan cüzdanlarda tutun
(2) Aktif Al-Sat Stratejisi
- Teknik analiz araçları:
- Hareketli Ortalamalar: Trend ve dönüş noktalarını belirlemek için kullanılır
- RSI (Göreli Güç Endeksi): Aşırı alım/satım koşullarını tespit etmeye yardımcı olur
- Salınım ticareti için önemli noktalar:
- Arbitrum’u etkileyebilecek Ethereum ağ güncellemelerini takip edin
- Arbitrum ekosistemindeki gelişmeleri ve iş birliklerini izleyin
ARB Risk Yönetimi Çerçevesi
(1) Varlık Dağılımı İlkeleri
- Tedbirli yatırımcılar: Kripto portföyünün %1-3’ü
- Agresif yatırımcılar: Kripto portföyünün %5-10’u
- Profesyonel yatırımcılar: Kripto portföyünün %15’ine kadar
(2) Riskten Korunma Yöntemleri
- Çeşitlendirme: Farklı Layer 2 çözümlerine yatırım yapın
- Stop-loss emirleri: Olası zararları sınırlamak için kullanın
(3) Güvenli Saklama Çözümleri
- Sıcak cüzdan önerisi: Gate Web3 Wallet
- Soğuk saklama: Donanım cüzdanları ile uzun vadeli saklama
- Güvenlik önlemleri: İki faktörlü kimlik doğrulamayı etkinleştirin, benzersiz şifreler kullanın
V. ARB için Olası Riskler ve Zorluklar
ARB Piyasa Riskleri
- Yüksek volatilite: ARB fiyatında ani ve büyük dalgalanmalar yaşanabilir
- Rekabet: Diğer Layer 2 projeleri pazar payı kazanabilir
- Ethereum güncellemeleri: Ethereum’daki değişiklikler Arbitrum’un değerini etkileyebilir
ARB Düzenleyici Riskler
- Belirsiz regülasyonlar: Layer 2 projelerine yönelik daha sıkı düzenlemeler gündeme gelebilir
- Ülke bazlı kısıtlamalar: Farklı coğrafyalarda değişen regülasyonlar benimsenmeyi sınırlayabilir
- Uyum gereklilikleri: Ek uyum önlemleri gerekebilir
ARB Teknik Riskler
- Akıllı kontrat açıkları: Arbitrum protokolünde saldırı riski oluşabilir
- Ölçeklenebilirlik sorunları: Artan işlem hacmini yönetmede beklenmeyen problemler
- İşbirliği sorunları: Diğer blokzincirlerle sorunsuz entegrasyonda zorluklar yaşanabilir
VI. Sonuç ve Eylem Önerileri
ARB Yatırım Değeri Değerlendirmesi
Arbitrum (ARB), Ethereum Layer 2 ölçeklendirme alanında uzun vadeli güçlü bir değer sunuyor. Ancak kısa vadeli volatilite ve rakip projeler önemli riskler oluşturuyor.
ARB Yatırım Tavsiyeleri
✅ Yeni başlayanlar: Portföyünüzün %1-3’ünü ARB’ye ayırabilirsiniz ✅ Deneyimli yatırımcılar: Ortalama maliyetle alım stratejisi izleyin ve yönetime aktif olarak katılın ✅ Kurumsal yatırımcılar: Kapsamlı araştırma yaparak ARB’yi çeşitlendirilmiş Layer 2 yatırım portföyüne dahil etmeyi değerlendirin
ARB Alım-Satım Katılım Yöntemleri
- Spot işlemler: Gate.com’da ARB token alım-satımı yapın
- Staking: Arbitrum ekosisteminde staking programlarına katılın
- Yönetim: Arbitrum DAO oylamalarına katılarak protokolü şekillendirin
Kripto varlık yatırımları son derece yüksek risk taşır. Bu makale yatırım tavsiyesi değildir; yatırımcılar kendi risk profillerine göre karar vermeli ve profesyonel finansal danışmanlara başvurmalıdır. Kaybetmeyi göze alamayacağınız tutarlarda yatırım yapmayın.
Sıkça Sorulan Sorular
2025’te Arbitrum’un fiyatı ne olur?
Piyasa tahminlerine göre, planlanan token kilit açılımları ve artan arzla birlikte Arbitrum (ARB) 2025’te yaklaşık $1,50 seviyesine ulaşabilir.
ARB $100’a çıkabilir mi?
Mevcut fiyatı $100’dan oldukça uzak olsa da, uzun vadede tamamen imkansız değil. Ancak bu; pazarın güçlü büyümesi ve Arbitrum teknolojisinin yaygın benimsenmesini gerektirir. Bu hedef halen oldukça spekülatiftir.
2030’da ARB için fiyat beklentisi nedir?
Mevcut projeksiyonlara göre, ARB 2030’da $0,42094 seviyesine ulaşabilir ve bu, bugünkü fiyatlara göre %5’lik olası bir artış anlamına gelir.
ARB kripto para biriminin geleceği var mı?
Evet, ARB kripto para birimi umut vaat ediyor. Ölçeklenebilirliği ve verimliliği, gelişen blokzincir dünyasında büyüme için güçlü bir zemin sunuyor.
Share
Content
Giriş: ARB'nin Piyasa Konumu ve Yatırım Potansiyeli
I. ARB Fiyat Geçmişi ve Güncel Piyasa Durumu
II. ARB'nin Gelecekteki Fiyatını Etkileyecek Temel Unsurlar
III. ARB 2025-2030 Fiyat Öngörüleri
IV. ARB Profesyonel Yatırım Stratejileri ve Risk Yönetimi
V. ARB için Olası Riskler ve Zorluklar
VI. Sonuç ve Eylem Önerileri
Sıkça Sorulan Sorular
How to Buy Cryptocurrency


Trending Cryptocurrencies


2025 ETH Fiyat Tahmini: Kurumsal Benimsenme ve Layer 2 Ölçeklendirme Çözümleri, Ethereum'un Yeni Zirvelere Ulaşmasını Sağlayabilir

2025 ARB Fiyat Tahmini: Arbitrum'un Yerel Token'ı İçin Gelecek Trendler, Piyasa Dinamikleri ve Büyüme Potansiyeli Analizi
On-chain veri analizi, Ethereum’un piyasa eğilimlerini nasıl gözler önüne serer?

2025 BOBA Fiyat Tahmini: Layer-2 Ölçeklendirme Çözümü Ekosisteminde Piyasa Trendleri ve Büyüme Potansiyelinin Değerlendirilmesi

On-Chain Veri Analizi, Kripto Piyasa Davranışındaki Eğilimleri Nasıl Açığa Çıkarır?

2025 OP Fiyat Tahmini: Yükseliş Trendleri ve Optimism'in Gelecekteki Değerini Etkileyen Temel Unsurlar

Kripto Dolandırıcılıklarını Tespit Etmeye Yönelik Meme Rehberi: Tespit ve Önleme Araçları
Zincirler Arası Varlık Transferini Kolaylaştırın: Polygon Network için Kapsamlı Rehber

Sanal Araziye Yatırımın Kapsamlı Rehberi

En İyi DeFi Yield Farming Stratejileriyle Getirileri Maksimuma Çıkarma Rehberi
EIP 4337'yi Anlamak: Hesap Soyutlamasına Kapsamlı Bir Rehber