2025 INTER Price Prediction: Expert Analysis and Market Forecast for the Coming Year
Introduction: INTER's Market Position and Investment Value
INTER (INTER), as the official Inter Milan fan token, has established itself since its launch in 2021 as a unique digital asset in the sports fan token ecosystem. As of 2025, INTER has achieved a market capitalization of approximately $6.62 million USD, with a circulating supply of 11,093,041 tokens, trading at around $0.3354 per token. This innovative asset, recognized as a "never-expiring digital membership with voting rights," enables fans to engage with their beloved team through governance participation and exclusive opportunities.
This article will conduct a comprehensive analysis of INTER's price trajectory from 2025 through 2030, integrating historical performance patterns, market supply-demand dynamics, ecosystem development, and macroeconomic factors to provide investors with professional price forecasting and actionable investment strategies.
Inter Milan Fan Token (INTER) Market Analysis Report
I. INTER Price History Review and Current Market Status
INTER Historical Price Evolution Timeline
- 2021: Project launch and initial market entry, INTER reached its all-time high of $13.21 on October 22, 2021, marking the peak of early investor enthusiasm in the fan token space.
- 2021-2025: Extended market downturn phase, with the token experiencing significant depreciation as broader market conditions shifted and fan token adoption faced headwinds.
- December 2, 2025: INTER reached its all-time low of $0.324799, reflecting continued downward pressure and accumulated losses over the multi-year period.
INTER Current Market Posture
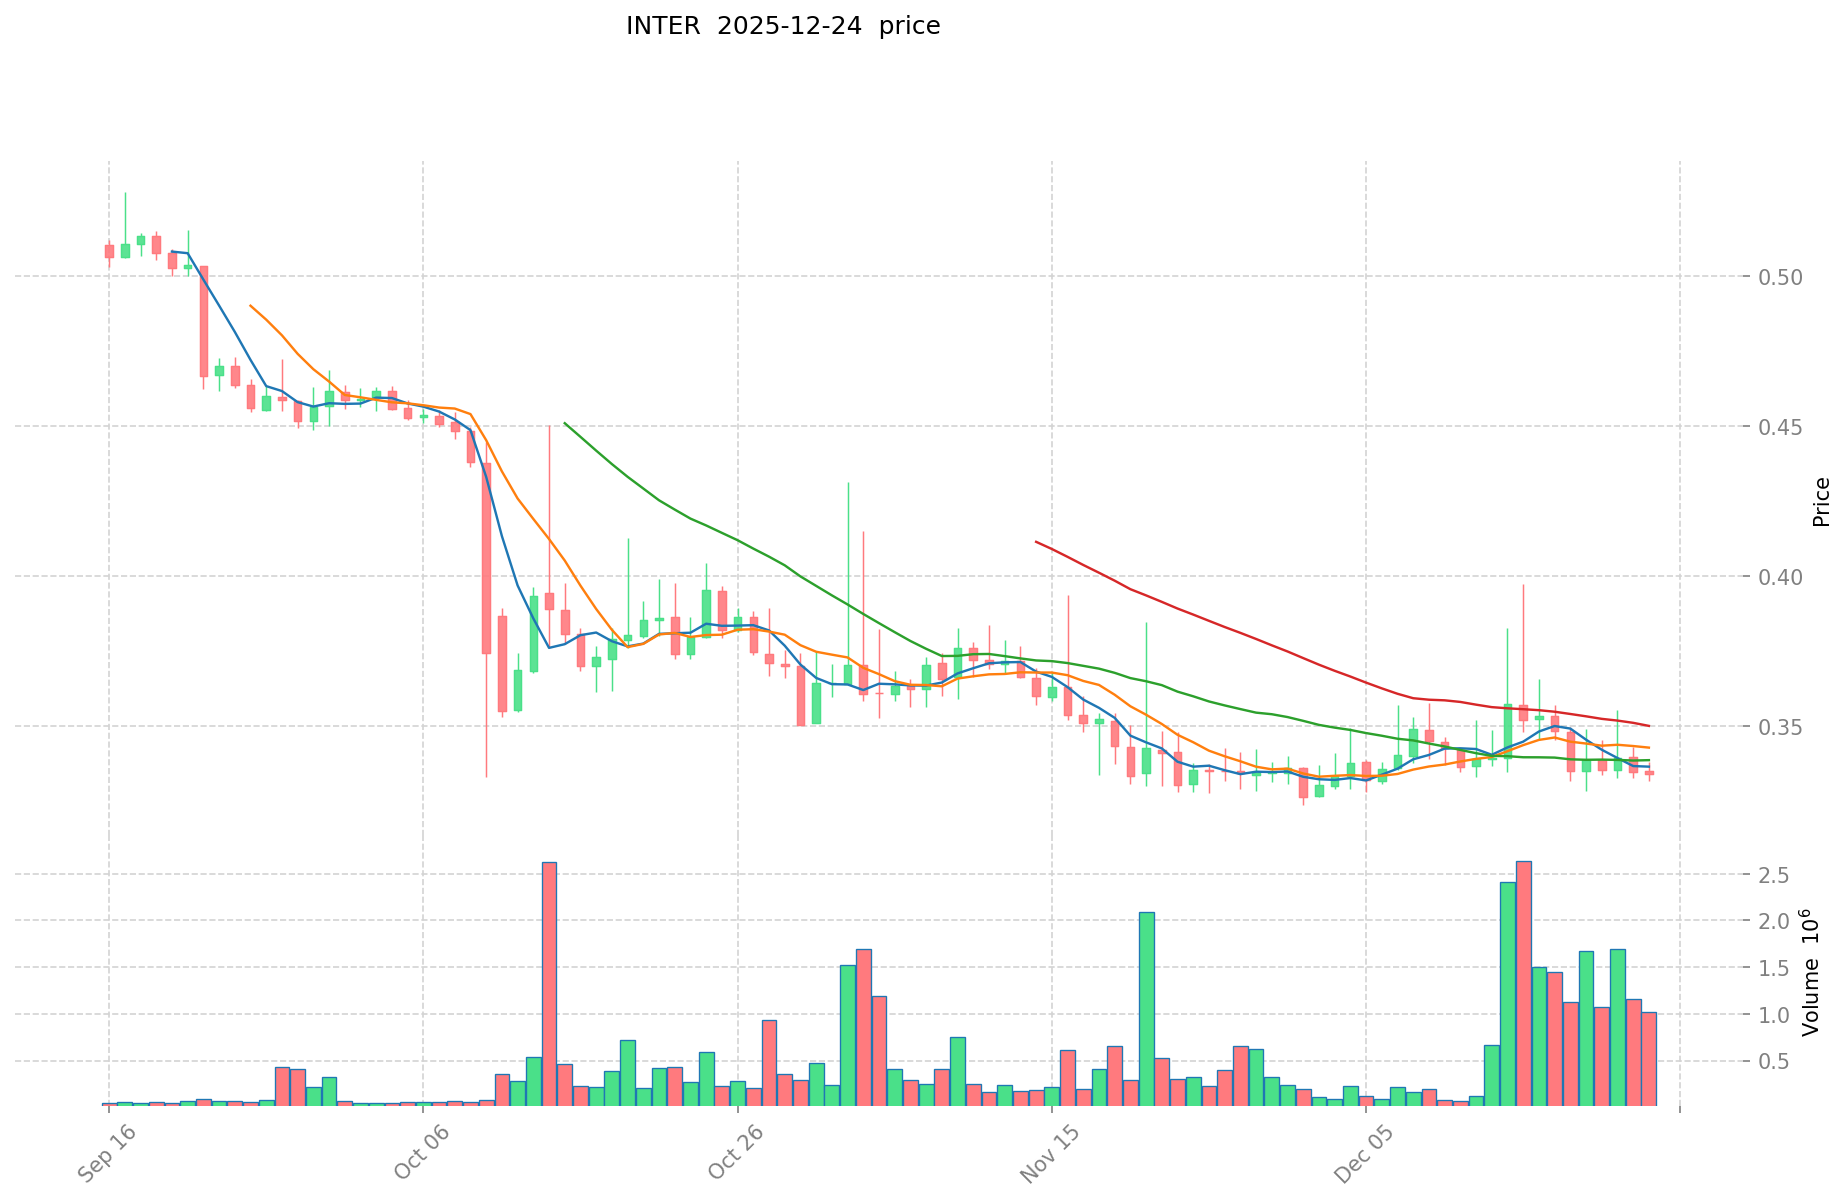
As of December 24, 2025, INTER is trading at $0.3354, representing a marginal recovery of 0.11% over the past 24 hours. The token exhibits the following key metrics:
Price Performance Metrics:
- 1-hour change: +0.03%
- 24-hour change: +0.11%
- 7-day change: -5.04%
- 30-day change: +0.51%
- 1-year change: -72.22%
Market Capitalization Metrics:
- Current market cap (circulating): $3,720,605.95
- Fully diluted valuation: $6,616,771.20
- Market dominance: 0.00021%
- Market cap to FDV ratio: 56.23%
Supply and Volume Data:
- Circulating supply: 11,093,041 INTER
- Total supply: 19,728,000 INTER
- Circulating supply ratio: 56.23%
- 24-hour trading volume: $360,824.38
- Available on 6 exchanges
Price Range (24-hour):
- High: $0.3379
- Low: $0.3316
INTER maintains a market ranking of 1,720 among all cryptocurrencies. The token continues to function as the official Inter Milan fan token, providing holders with governance rights and exclusive access to club experiences. Despite the substantial year-over-year decline of 72.22%, the token has stabilized near its recent bottom established on December 2, 2025.
Check current INTER market price
INTER Market Sentiment Index
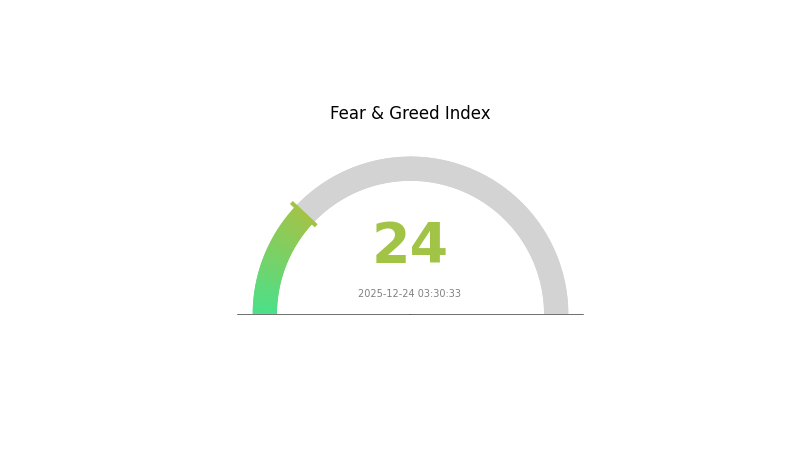
2025-12-24 Fear and Greed Index: 24 (Extreme Fear)
Click to view current Fear & Greed Index
The crypto market is currently experiencing extreme fear with a Fear and Greed Index reading of 24. This exceptionally low reading indicates significant market pessimism and heightened investor anxiety. When fear reaches such extreme levels, it often signals potential capitulation and possible oversold conditions. Savvy traders may view this as a contrarian opportunity, as historically, extreme fear periods have preceded market recoveries. However, caution remains warranted as the underlying factors driving this sentiment should be carefully evaluated before making investment decisions on Gate.com.
INTER Holdings Distribution
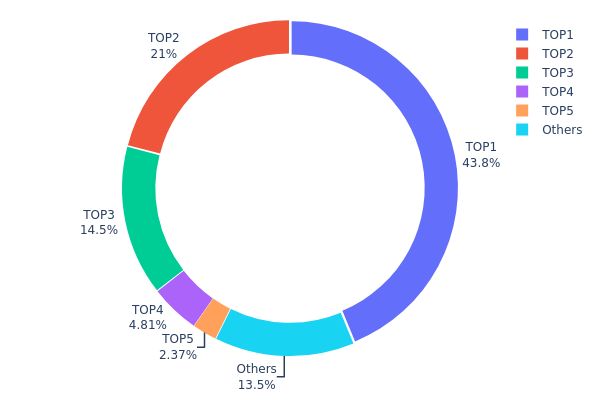
The address holdings distribution chart illustrates the concentration of INTER tokens across blockchain addresses, revealing the wealth distribution pattern and potential centralization risks within the token ecosystem. By analyzing the top holders and their proportional stakes, we can assess market structure, liquidity dynamics, and vulnerability to potential price manipulation.
INTER demonstrates notable concentration characteristics, with the top three addresses controlling approximately 79.28% of total circulating supply. The leading address (0x6F45...41a33D) alone holds 43.77%, representing a significant single-point concentration risk. The second and third largest holders maintain 20.99% and 14.52% respectively, creating a pronounced top-heavy distribution pattern. While the fourth and fifth addresses show more moderate holdings at 4.81% and 2.37%, the remaining 13.54% scattered across other addresses indicates limited decentralization at the protocol level. This configuration suggests moderate to elevated centralization risk, as coordinated action among the top three addresses could theoretically influence market movements.
The current address distribution structure presents meaningful implications for market stability and price dynamics. The substantial concentration among leading holders creates potential vulnerability to liquidity shocks should these addresses initiate large-scale selling activity. Additionally, the distribution pattern indicates that retail participation remains fragmented, limiting organic price support during downturns. However, the presence of meaningful holdings outside the top five addresses provides some cushion against extreme centralization scenarios. Overall, INTER's current on-chain structure reflects a moderately centralized token ecosystem requiring monitoring, particularly regarding large holder accumulation or distribution patterns that could signal shifting market sentiment.
Click to view current INTER holdings distribution
| Top | Address | Holding Qty | Holding (%) |
|---|---|---|---|
| 1 | 0x6F45...41a33D | 8634.96K | 43.77% |
| 2 | 0xc368...816880 | 4140.23K | 20.99% |
| 3 | 0x76eC...78Fbd3 | 2864.93K | 14.52% |
| 4 | 0xc80A...e92416 | 948.19K | 4.81% |
| 5 | 0x3bad...c8D986 | 467.46K | 2.37% |
| - | Others | 2672.23K | 13.54% |
Core Factors Affecting INTER's Future Price Trajectory
Based on the provided research materials, the available information primarily focuses on semiconductor industry dynamics and macroeconomic factors rather than specific cryptocurrency supply mechanisms or institutional adoption patterns for INTER tokens.
Macroeconomic Environment
Monetary Policy Impact
The U.S. Federal Reserve's policy stance significantly influences risk asset performance, including cryptocurrencies. In December 2025, the Fed announced a 25 basis point rate cut to 3.5%-3.75%, ceased quantitative tightening (QT) on December 1st, and launched a Reverse Repurchase (RMP) program purchasing $40 billion in short-term Treasury bonds over 30 days. However, internal Fed divisions regarding future rate cut trajectories remain substantial, with some officials maintaining a hawkish stance.
Geopolitical Factors
Elevated geopolitical tensions have created significant uncertainty in global markets. These tensions support demand for alternative assets and correlate with broader risk-on/risk-off market dynamics that affect cryptocurrency valuations. Central banks continue accumulating gold as a hedge, with geopolitical instability expected to persist through 2026.
Interest Rate and Inflation Dynamics
Higher interest rates generally increase opportunity costs for holding non-yielding assets like cryptocurrencies, redirecting capital toward fixed-income securities. Conversely, lower inflation expectations and accommodative monetary policy create more favorable conditions for risk assets. Market expectations for multiple Fed rate cuts in the second half of 2026 could provide support for cryptocurrency prices if inflation remains contained.
Note: The provided materials do not contain specific information regarding INTER's supply mechanisms, institutional holdings, major enterprise adoption, technology upgrades, or ecosystem applications. To provide a comprehensive analysis of INTER's price drivers, additional data on these specific factors would be required.
III. INTER Price Forecast 2025-2030
2025 Outlook
- Conservative Forecast: $0.2786 - $0.3357
- Neutral Forecast: $0.3357 - $0.3786
- Optimistic Forecast: $0.3786 - $0.4163 (requires sustained market momentum and positive ecosystem developments)
2026-2028 Medium-term Outlook
- Market Stage Expectation: Gradual accumulation phase with incremental adoption and network expansion, transitioning toward moderate growth momentum by 2028
- Price Range Forecasts:
- 2026: $0.3346 - $0.4775
- 2027: $0.3883 - $0.5974
- 2028: $0.4455 - $0.6606
- Key Catalysts: Enhanced protocol functionalities, increased institutional adoption, strategic partnerships, and broader market sentiment improvements
2029-2030 Long-term Outlook
- Base Case: $0.4574 - $0.6567 (assumes steady market conditions and continuous but moderate growth trajectory)
- Optimistic Scenario: $0.4724 - $0.8888 (assumes accelerated adoption rates and favorable macroeconomic environment)
- Transformational Scenario: $0.5000+ (requires breakthrough technological innovations, significant mainstream adoption, or major institutional inflows)
- December 24, 2025: INTER trading at recovery phase with 12-27% cumulative upside potential through 2027
Note: These forecasts are based on historical data analysis and should be monitored regularly on platforms like Gate.com. Market conditions remain subject to volatility and unforeseen developments.
| 年份 | 预测最高价 | 预测平均价格 | 预测最低价 | 涨跌幅 |
|---|---|---|---|---|
| 2025 | 0.41627 | 0.3357 | 0.27863 | 0 |
| 2026 | 0.4775 | 0.37598 | 0.33463 | 12 |
| 2027 | 0.59744 | 0.42674 | 0.38834 | 27 |
| 2028 | 0.6606 | 0.51209 | 0.44552 | 52 |
| 2029 | 0.6567 | 0.58634 | 0.45735 | 74 |
| 2030 | 0.88878 | 0.62152 | 0.47236 | 85 |
Inter Milan Fan Token (INTER) Professional Investment Report
IV. INTER Professional Investment Strategy and Risk Management
INTER Investment Methodology
(1) Long-Term Holding Strategy
Target Investors: Sports fans and cryptocurrency enthusiasts seeking exposure to sports-related digital assets with voting rights on club decisions.
Operational Recommendations:
- Accumulate INTER tokens during market pullbacks, particularly when prices decline below $0.35, as current valuations remain significantly below historical highs of $13.21 (from October 22, 2021)
- Maintain a 12-24 month holding horizon to benefit from potential fan engagement initiatives and club partnership announcements
- Reinvest any governance rewards or voting benefits obtained through INTER token holdings
Storage Solutions:
- Utilize Gate.com Wallet for secure custodial storage with full access to trading features and staking opportunities
- Implement multi-signature cold storage approaches for holdings exceeding $10,000 in value
- Enable two-factor authentication across all account access points
(2) Active Trading Strategy
Technical Analysis Tools:
- Support and Resistance Levels: Track the recent trading range between $0.3316 (24-hour low) and $0.3379 (24-hour high) as immediate technical indicators for entry and exit signals
- Moving Average Convergence: Monitor 7-day price momentum, which currently shows -5.04% decline to identify potential reversal points
Wave Trading Key Points:
- Capitalize on 24-hour volatility of 0.11% by setting limit orders at psychological support levels near $0.33
- Execute position exits during upside breakouts above $0.35, targeting 5-8% profit taking opportunities
- Monitor daily trading volume of $360,824 for liquidity confirmation before entering larger positions
INTER Risk Management Framework
(1) Asset Allocation Principles
- Conservative Investors: 1-2% of total cryptocurrency portfolio allocation to INTER tokens
- Active Investors: 3-5% of total cryptocurrency portfolio allocation to diversify sports-related token exposure
- Professional Investors: 5-8% of total cryptocurrency portfolio allocation with structured entry/exit protocols
(2) Risk Hedging Solutions
- Volatility Hedging: Offset INTER holdings through complementary positions in more stable fan token alternatives or sports entertainment tokens listed on Gate.com
- Profit-Taking Protocol: Establish graduated selling targets at 20%, 50%, and 80% position levels to lock in gains during market rallies above $0.40
(3) Secure Storage Solutions
- Custodial wallet: Gate.com Web3 Wallet provides institutional-grade security infrastructure with real-time transaction monitoring and insurance coverage for digital assets
- Non-Custodial Approach: Store INTER tokens on CHZ2 blockchain using the contract address 0xc727c9C0f2647CB90B0FCA64d8ddB14878716BeD with hardware backup verification
- Security Precautions: Maintain backup seed phrases in physically separated secure locations, disable email forwarding on associated accounts, and never share private keys or recovery phrases under any circumstances
V. INTER Potential Risks and Challenges
INTER Market Risks
- Extreme Historical Volatility: INTER has experienced -72.22% decline over the past year and trades 97.46% below its all-time high of $13.21, indicating substantial concentration risk and speculative positioning
- Liquidity Constraints: Daily trading volume of $360,824 across only six exchanges may result in significant price impact for large orders and potential exit difficulties during market stress periods
- Regulatory Uncertainty for Sports Tokens: Sports fan tokens operate in emerging regulatory frameworks; unforeseen restrictions on voting mechanisms or club partnership terms could materially impact token utility and value
INTER Regulatory Risks
- Sports Industry Compliance: Changes in European sports regulations or EU directives regarding fan engagement mechanisms could restrict INTER token voting rights or distribution channels
- Financial Classification Uncertainty: If regulators reclassify sports fan tokens as securities rather than community engagement tools, INTER may face additional compliance burdens and trading restrictions
- Club Partnership Dependencies: Inter Milan's business decisions regarding fan token programs or partnership transitions could significantly impact INTER's fundamental value proposition
INTER Technical Risks
- Blockchain Infrastructure Risk: INTER operates on the CHZ2 blockchain; network degradation, security vulnerabilities, or protocol changes could compromise token accessibility and transaction settlement
- Smart Contract Vulnerability: Potential undiscovered vulnerabilities in the token contract at 0xc727c9C0f2647CB90B0FCA64d8ddB14878716BeD could result in fund loss or token supply manipulation
- Limited Developer Activity: Absence of visible GitHub repositories or active development documentation raises concerns about ongoing technical maintenance and feature enhancement roadmaps
VI. Conclusion and Action Recommendations
INTER Investment Value Assessment
Inter Milan Fan Token operates at only 2.54% of its historical valuation peak, presenting a highly speculative recovery opportunity balanced against substantial downside risk. The token's utility is primarily derived from voting rights and club engagement opportunities rather than traditional cryptocurrency utility, making it a niche asset class appealing specifically to Inter Milan supporters. Current market capitalization of $6.6 million indicates minimal institutional adoption and significant liquidity constraints that could amplify price volatility during both positive and negative market catalysts.
INTER Investment Recommendations
✅ Beginners: Limit INTER allocation to 1% of total cryptocurrency holdings as an experimental position; participate through Gate.com with dollar-cost averaging over 6-12 months to reduce entry price volatility risk
✅ Experienced Investors: Deploy 3-5% position using technical level breakouts above $0.35 as confirmation signals; establish predetermined exit targets at 20%, 40%, and 80% position levels to systematically harvest gains
✅ Institutional Investors: Consider INTER only as micro-allocation (0.5-1% of sports-focused crypto strategies) with structured hedging protocols and mandatory quarterly position reviews tied to Inter Milan partnership developments
INTER Trading Participation Methods
- Gate.com Direct Trading: Execute spot purchases of INTER against USDT or stablecoin pairs with real-time order book visibility and institutional-grade execution protocols
- Accumulation During Weakness: Build positions incrementally when INTER trades below $0.33, maintaining dry powder reserves to capitalize on sustained weakness toward the $0.32 support level
- Governance Participation: Engage with club voting initiatives through token holdings to derive non-financial utility benefits that may justify extended holding periods despite price volatility
Cryptocurrency investments carry extreme risk. This report does not constitute investment advice. All investors must conduct independent research and consult qualified financial advisors before making investment decisions. Never invest capital that exceeds your personal financial loss tolerance or emergency fund requirements.
FAQ
How high will ICP go in 2025?
Based on market analysis, ICP is projected to reach between $4.4 to $20.2 in 2025, with the Fibonacci resistance level at $20.96 presenting a potential target for strong bullish momentum.
What is the ICP coin prediction for 2030?
Based on current market analysis, ICP is projected to potentially reach maximum levels around $202.33 by 2030. This forecast reflects optimistic growth scenarios driven by network development and adoption trends.
Will ICP go up?
Yes, ICP is expected to rise with strong upward momentum. Market analysts predict continued growth potential, with price targets suggesting significant appreciation ahead for long-term holders.
Share
Content
Introduction: INTER's Market Position and Investment Value
I. INTER Price History Review and Current Market Status
2025 Outlook
2026-2028 Medium-term Outlook
2029-2030 Long-term Outlook
IV. INTER Professional Investment Strategy and Risk Management
V. INTER Potential Risks and Challenges
VI. Conclusion and Action Recommendations
FAQ
How to Buy Cryptocurrency


Trending Cryptocurrencies


How Will HOLO Price Evolve by 2030 Based on Current Market Trends?

2025 TCT Price Prediction: Navigating the Future of Cryptocurrency Investments
2025 TRUST Price Prediction: Expert Analysis and Market Forecast for the Coming Year

2025 COS Price Prediction: Expert Analysis and Market Forecast for the Decentralized Storage Token

2025 10SET Price Prediction: Expert Analysis and Market Forecast for the Coming Year

2025 TONC Price Prediction: Expert Analysis and Market Forecast for the Coming Year
Top Bitcoin Mining Apps for Android & iOS

How to Buy BIM in Egypt

Tether TRC20 Wallet and USDT on TRON Network

What is Quant (QNT)? An Overview of the QNT Token

Cryptocurrency Exchange Security Achievements: Successfully Defended Over $150 Million in Crypto Assets