2025 JPrice Prediction: Analyzing Market Trends and Future Valuation of J-Assets in the Post-Pandemic Economy


Introduction: J's Market Position and Investment Value
Jambo (J), as a project committed to building the world's largest mobile-first crypto network, has made significant strides since its inception. As of 2025, Jambo's market capitalization has reached $13,666,900, with a circulating supply of approximately 130,000,000 tokens, and a price hovering around $0.10513. This asset, known for its focus on mobile crypto solutions, is playing an increasingly crucial role in the mobile-first crypto ecosystem.
This article will provide a comprehensive analysis of Jambo's price trends from 2025 to 2030, considering historical patterns, market supply and demand, ecosystem development, and macroeconomic factors to offer professional price predictions and practical investment strategies for investors.
I. J Price History Review and Current Market Status
J Historical Price Evolution
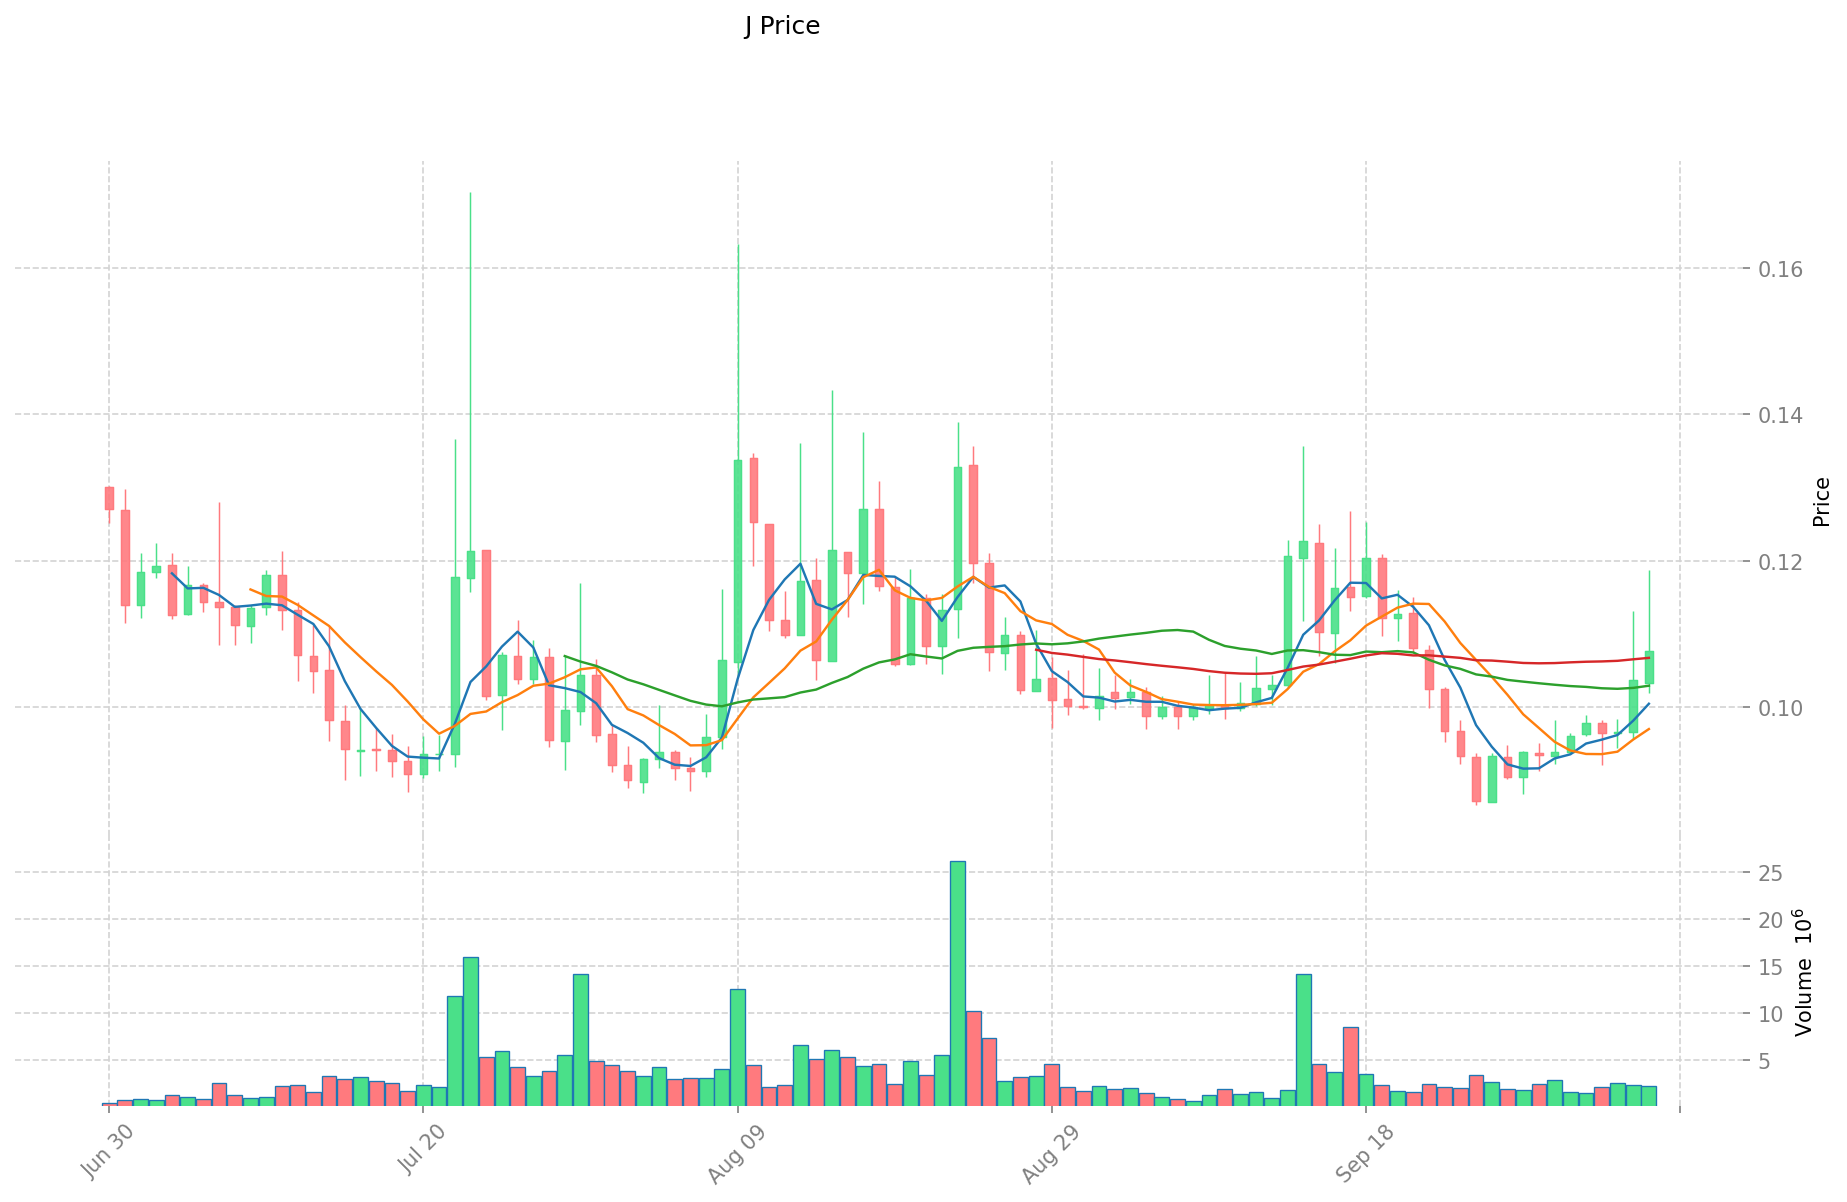
- 2025 (January): J reached its all-time high of $1.5, marking a significant milestone in its price history
- 2025 (September): The price hit its all-time low of $0.08655, indicating a substantial market correction
- 2025 (October): J has shown signs of recovery, with the price stabilizing around $0.10513
J Current Market Situation
As of October 7, 2025, J is trading at $0.10513. The token has experienced a slight decline of 0.83% in the past 24 hours, with a trading volume of $257,460.77. Despite the short-term dip, J has shown strong performance over the past week, with a 12.22% increase. The market capitalization currently stands at $13,666,900, ranking J at 1280th position in the crypto market.
The circulating supply of J is 130,000,000 tokens, which represents 13% of the total supply of 1,000,000,000. This relatively low circulating supply ratio suggests potential for future growth as more tokens enter circulation.
J's price performance over different time frames presents a mixed picture. While it has seen significant gains of 12.22% over the past week and 6.17% over the past month, the year-to-date performance shows a substantial decline of 85.35%. This indicates that while J has experienced a recent uptrend, it is still recovering from a broader market downturn.
The current market sentiment for J appears to be cautiously optimistic, with the recent positive price momentum potentially attracting more investor interest. However, the token's price is still significantly below its all-time high, suggesting room for potential growth if market conditions continue to improve.
Click to view the current J market price
J Market Sentiment Indicator
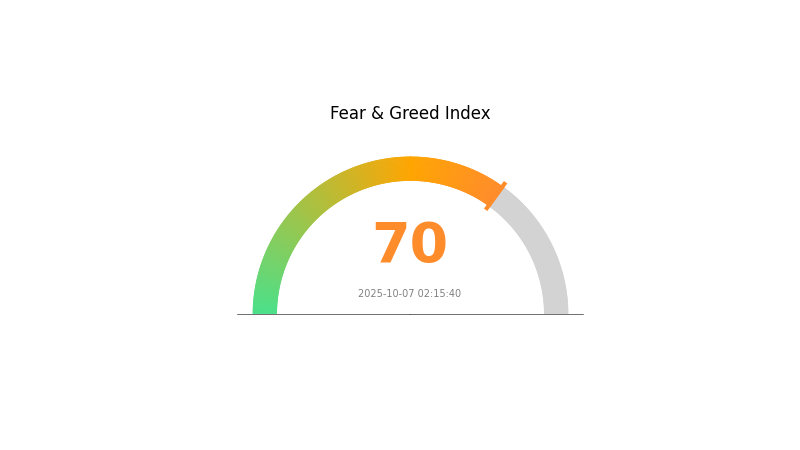
2025-10-07 Fear and Greed Index: 70 (Greed)
Click to view the current Fear & Greed Index
The crypto market is currently experiencing a surge of optimism, with the Fear and Greed Index reaching 70, indicating strong greed. This sentiment often signals a bullish trend, with investors feeling confident about potential gains. However, it's crucial to remain cautious during such periods, as extreme greed can lead to overvaluation and increased volatility. Savvy traders on Gate.com are likely keeping a close eye on this indicator, balancing their strategies between capitalizing on the positive momentum and preparing for potential market corrections.
J Holdings Distribution
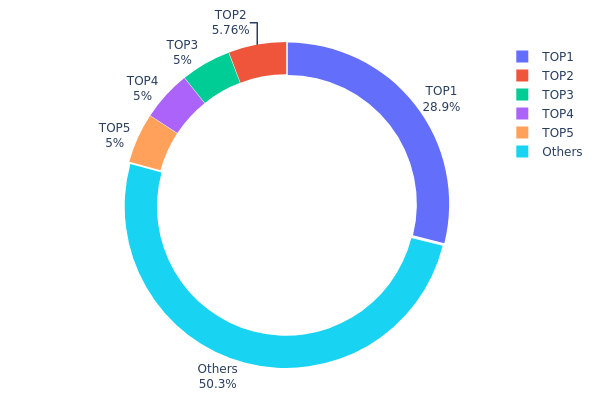
The address holdings distribution data reveals significant concentration in J token ownership. The top address holds a substantial 28.89% of the total supply, indicating a high level of centralization. The next four largest addresses each hold 5% or slightly more, collectively accounting for another 20.76% of the supply. This means that the top 5 addresses control nearly half (49.65%) of all J tokens, while the remaining 50.35% is distributed among other holders.
This concentration pattern raises concerns about potential market manipulation and price volatility. With such a large portion of tokens held by a few addresses, there's an increased risk of significant price swings if these major holders decide to sell or move their assets. Moreover, this level of centralization may impact J's market structure, potentially allowing for easier price manipulation or coordinated actions by large holders.
From a broader perspective, this distribution suggests a relatively low degree of decentralization for J, which could affect its perception among investors and its overall market stability. While some concentration is common in many cryptocurrencies, this level of consolidation may warrant closer monitoring of large holder activities and their potential impact on J's market dynamics.
Click to view the current J Holdings Distribution
| Top | Address | Holding Qty | Holding (%) |
|---|---|---|---|
| 1 | A5gsRX...Qky4N5 | 288991.99K | 28.89% |
| 2 | 3LzmBq...Bwq3b1 | 57617.86K | 5.76% |
| 3 | 9nESh7...x5smmn | 50000.01K | 5.00% |
| 4 | 3ukaaH...q6QZu1 | 50000.01K | 5.00% |
| 5 | Ftrnwk...wxWori | 50000.01K | 5.00% |
| - | Others | 503389.87K | 50.35% |
II. Key Factors Influencing Future J Prices
Supply Mechanism
- Historical patterns: Past supply changes have shown a significant impact on prices. When supply decreases and demand increases, prices tend to rise; conversely, when supply is abundant and demand weakens, prices may fall.
Institutional and Major Player Dynamics
- National policies: Government policies at the national level can have a substantial impact on J prices.
Macroeconomic Environment
- Impact of monetary policies: Central bank policies, especially those of major economies, are expected to influence J prices significantly.
- Inflation hedging properties: J has shown characteristics of an inflation hedge, with its performance often correlating with inflationary environments.
- Geopolitical factors: International tensions and conflicts can drive investors towards J as a safe-haven asset.
Technical Development and Ecosystem Building
- Ecosystem applications: The development of major DApps and ecosystem projects related to J can affect its value and adoption.
III. J Price Prediction for 2025-2030
2025 Outlook
- Conservative prediction: $0.0602 - $0.10561
- Neutral prediction: $0.10561 - $0.11089
- Optimistic prediction: $0.11089 - $0.12665 (requires strong market momentum)
2027 Mid-term Outlook
- Market phase expectation: Potential growth phase
- Price range forecast:
- 2027: $0.07869 - $0.15739
- 2028: $0.1278 - $0.18964
- Key catalysts: Increasing adoption and technological advancements
2030 Long-term Outlook
- Base scenario: $0.17185 - $0.18479 (assuming steady market growth)
- Optimistic scenario: $0.18479 - $0.24577 (assuming favorable market conditions)
- Transformative scenario: $0.24577 - $0.30000 (assuming breakthrough innovations and widespread adoption)
- 2030-12-31: J $0.24577 (potential peak for the year)
| 年份 | 预测最高价 | 预测平均价格 | 预测最低价 | 涨跌幅 |
|---|---|---|---|---|
| 2025 | 0.11089 | 0.10561 | 0.0602 | 0 |
| 2026 | 0.12665 | 0.10825 | 0.07036 | 2 |
| 2027 | 0.15739 | 0.11745 | 0.07869 | 11 |
| 2028 | 0.18964 | 0.13742 | 0.1278 | 30 |
| 2029 | 0.20604 | 0.16353 | 0.0834 | 55 |
| 2030 | 0.24577 | 0.18479 | 0.17185 | 75 |
IV. Professional Investment Strategies and Risk Management for J
J Investment Methodology
(1) Long-term Holding Strategy
- Suitable for: Long-term crypto investors and blockchain technology enthusiasts
- Operation suggestions:
- Accumulate J tokens during market dips
- Set price alerts for significant price movements
- Store tokens in a secure hardware wallet
(2) Active Trading Strategy
- Technical analysis tools:
- Moving Averages: Monitor short-term and long-term trends
- Relative Strength Index (RSI): Identify overbought and oversold conditions
- Key points for swing trading:
- Monitor market sentiment and news related to Jambo
- Set stop-loss orders to manage risk
J Risk Management Framework
(1) Asset Allocation Principles
- Conservative investors: 1-3%
- Aggressive investors: 5-10%
- Professional investors: 10-15%
(2) Risk Hedging Solutions
- Diversification: Spread investments across multiple cryptocurrencies
- Stop-loss orders: Implement to limit potential losses
(3) Secure Storage Solutions
- Hardware wallet recommendation: Gate Web3 Wallet
- Cold storage solution: Paper wallet for long-term holdings
- Security precautions: Enable two-factor authentication, use strong passwords
V. Potential Risks and Challenges for J
J Market Risks
- High volatility: Crypto market can experience sudden price swings
- Limited adoption: Jambo's success depends on widespread user acceptance
- Competition: Other mobile-first crypto networks may emerge
J Regulatory Risks
- Uncertain regulations: Crypto regulations vary by country and are subject to change
- Potential restrictions: Governments may impose limitations on crypto usage
- Tax implications: Evolving tax laws may impact J token holders
J Technical Risks
- Smart contract vulnerabilities: Potential for exploits in the token's code
- Network congestion: Solana blockchain may experience periods of high traffic
- Integration challenges: Issues with JamboPhone implementation
VI. Conclusion and Action Recommendations
J Investment Value Assessment
Jambo (J) presents an innovative approach to mobile-first crypto networks, offering long-term potential in the evolving digital economy. However, investors should be aware of short-term volatility and adoption challenges.
J Investment Recommendations
✅ Beginners: Start with small positions and focus on learning about the technology ✅ Experienced investors: Consider allocating a portion of their crypto portfolio to J ✅ Institutional investors: Conduct thorough due diligence and consider J as part of a diversified crypto strategy
J Trading Participation Methods
- Spot trading: Buy and sell J tokens on Gate.com
- Staking: Participate in staking programs if available
- DeFi integration: Explore decentralized finance opportunities involving J tokens
Cryptocurrency investments carry extremely high risks, and this article does not constitute investment advice. Investors should make decisions based on their own risk tolerance and are advised to consult professional financial advisors. Never invest more than you can afford to lose.
FAQ
What meme coin will explode in 2025 price prediction?
Pepe Coin is predicted to explode in 2025, with its deflationary nature and growing popularity potentially driving its value to new heights.
Is Johnson and Johnson stock expected to rise?
Yes, Johnson and Johnson stock is expected to rise. Forecasts suggest it will reach $191.04 per share by November 4, 2025, a 1.27% increase from current levels.
Is Jacobs stock a buy or sell?
Jacobs stock is currently rated as a Moderate Buy. Analysts suggest a mix of buy and hold recommendations, making it a potentially attractive investment option.
How volatile is J Stock?
J Stock has shown relatively low volatility, with a weekly volatility of around 3%. Its share price has remained stable over the past three months compared to the market.
Share
Content
Introduction: J's Market Position and Investment Value
I. J Price History Review and Current Market Status
II. Key Factors Influencing Future J Prices
III. J Price Prediction for 2025-2030
IV. Professional Investment Strategies and Risk Management for J
V. Potential Risks and Challenges for J
VI. Conclusion and Action Recommendations
FAQ
How to Buy Cryptocurrency


Trending Cryptocurrencies


NEON vs THETA: A Comparative Analysis of Next-Generation Neural Network Architectures for AI Applications
ROOT vs SOL: The Battle for Blockchain Supremacy in Cross-Chain Interoperability

WEN vs XLM: Comparing Performance and Tokenization Efficiency in Large Language Models
PUSH vs SOL: The Battle of Blockchain Scalability Solutions

How Will Solana (SOL) Price Volatility Evolve in 2025?

XYRO vs SOL: Comparing the Future of Decentralized Finance Platforms

How does macroeconomic policy impact cryptocurrency prices in 2026: Fed policy, inflation data, and stock market correlation explained

What is FLOKI market overview: price, market cap ranking, trading volume and liquidity in 2026?

What Are the Key Derivatives Market Signals for Crypto: Open Interest, Funding Rates, and Liquidation Data Explained?

What Is XLM Community and Ecosystem Activity: Twitter Followers, Developer Contributions, and DApp Growth in 2026?

How to Analyze On-Chain Data: Active Address Count, Transaction Volume, Whale Distribution, and Fee Trends in 2026