2025 MARSH Price Prediction: Expert Analysis and Market Outlook for the Coming Year

Introduction: Market Position and Investment Value of MARSH
Unmarshal (MARSH) serves as a utility token powering a multi-chain DeFi indexing network that provides seamless access to blockchain data for decentralized finance applications. Since its launch in 2021, MARSH has established itself as an infrastructure asset within the DeFi ecosystem. As of January 2026, MARSH maintains a market capitalization of approximately $127,273.60, with a circulating supply of around 66.84 million tokens, currently trading at $0.001283 per token. This utility token, recognized for its essential role in incentivizing network contributors and enabling data access payments, continues to play an increasingly important function in supporting decentralized data indexing infrastructure.
This article will provide a comprehensive analysis of MARSH's price trajectory through 2031, integrating historical performance patterns, market supply-demand dynamics, ecosystem development, and macroeconomic factors to deliver professional price forecasts and practical investment strategies for investors.
I. MARSH Price History Review and Current Market Status
MARSH Historical Price Evolution
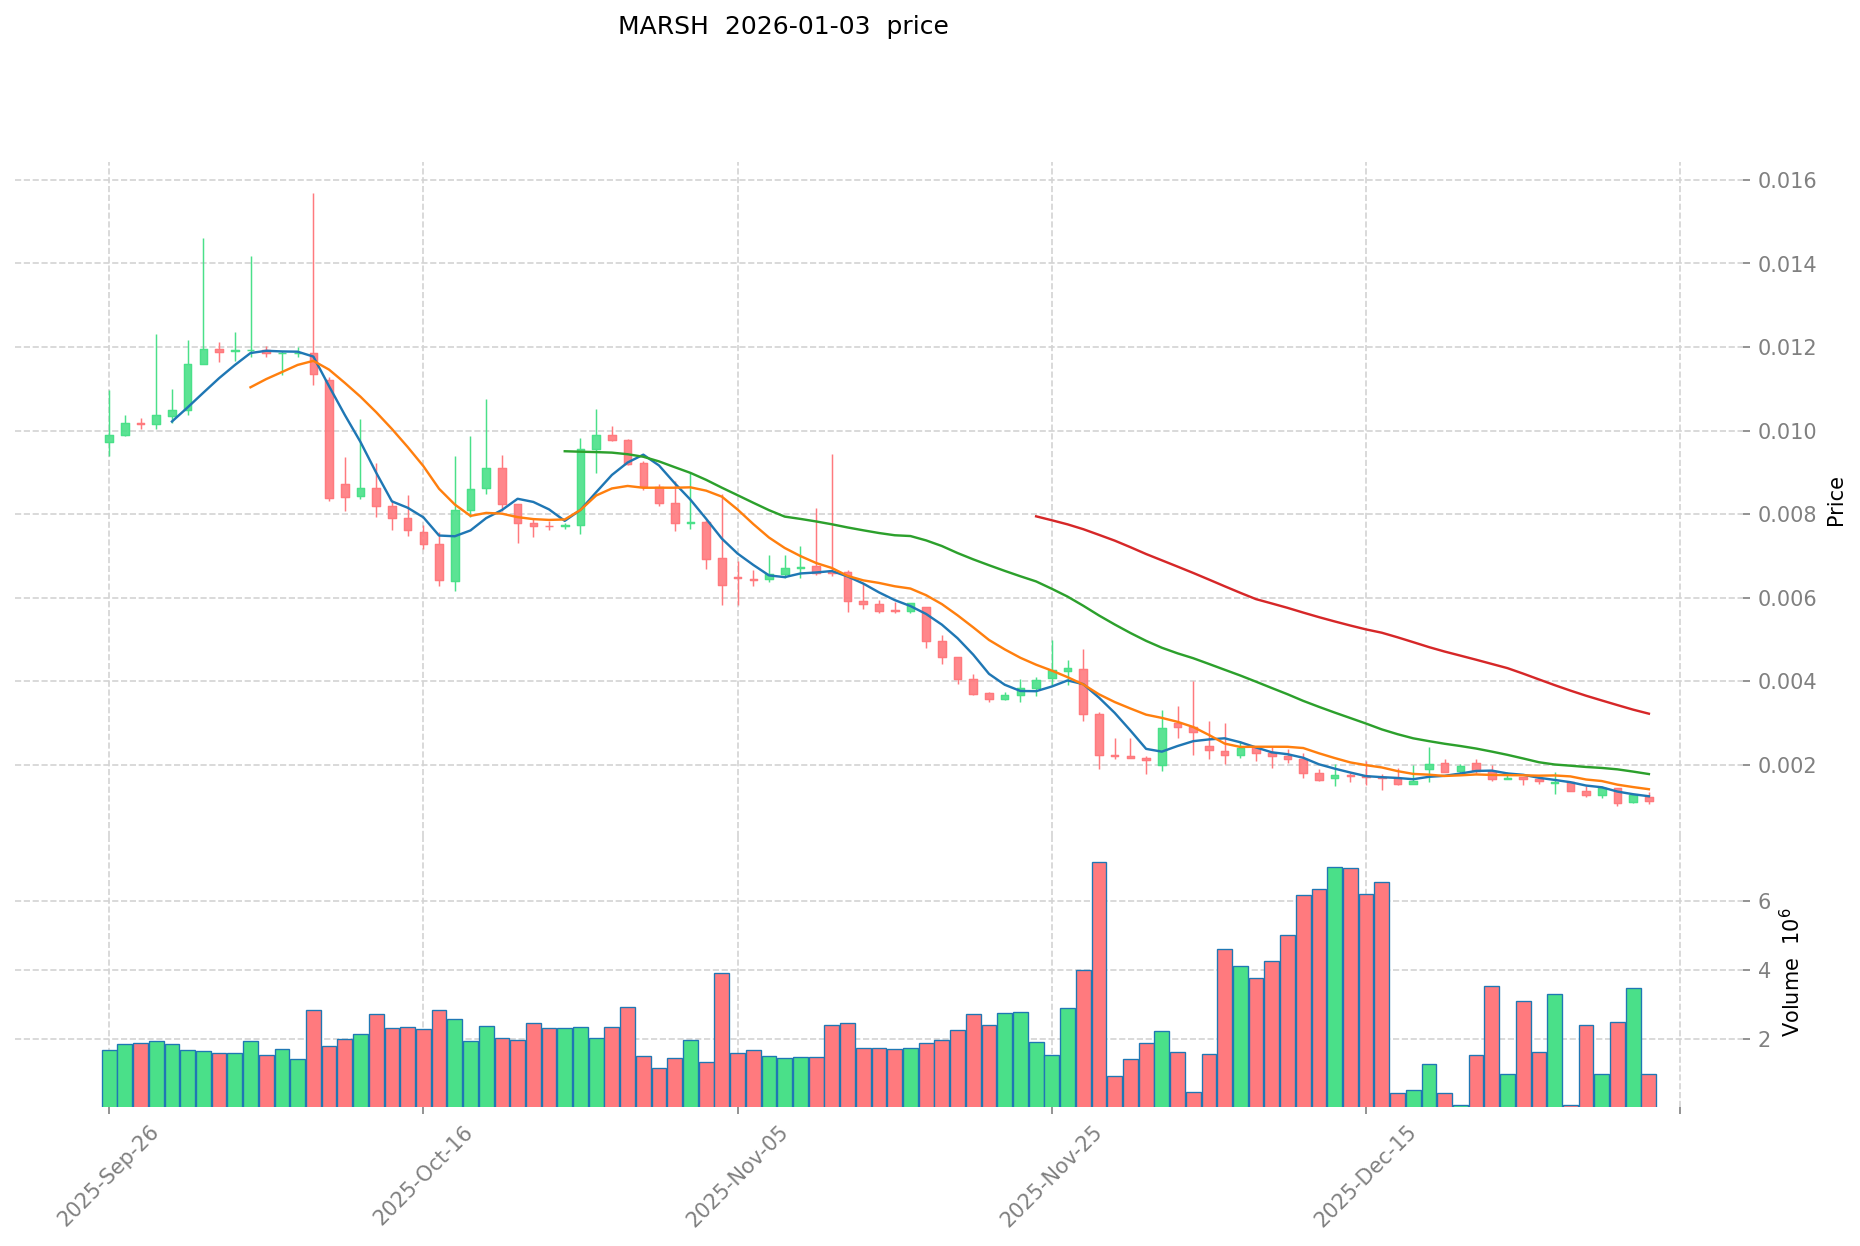
- March 2021: Project launch and initial trading phase, reaching an all-time high of $11.89 on March 30, 2021, marking the peak of early market enthusiasm.
- 2021-2025: Extended bearish cycle, with MARSH experiencing a significant decline from its historical peak, reflecting the broader cryptocurrency market downturn and shifting investor sentiment toward indexing infrastructure protocols.
- January 2026: Price reached an all-time low of $0.00103534 on January 1, 2026, representing a cumulative decline of 98.55% from the all-time high, indicating sustained pressure on the token's valuation.
MARSH Current Market Status
As of January 4, 2026, MARSH is trading at $0.001283 with a 24-hour trading volume of $7,299.39. The token demonstrates notable 24-hour price volatility, recording a gain of 15.37% over the past 24 hours while showing weakness over longer timeframes with a 7-day decline of 18.90% and a 30-day loss of 46.18%.
The circulating supply stands at 66,842,378.86 MARSH tokens out of a total supply of 99,200,000, with a maximum supply capped at 100,000,000 tokens. The current circulating supply ratio is 66.84%, indicating that approximately one-third of total tokens remain to be released into circulation.
Market capitalization is valued at $85,758.77, with a fully diluted valuation of $127,273.60. The token maintains a market dominance of 0.0000039%, reflecting its relatively small position within the broader cryptocurrency market. MARSH maintains liquidity on Gate.com and holds 4,130 unique token holders.
Click to view current MARSH market price
MARSH Market Sentiment Index
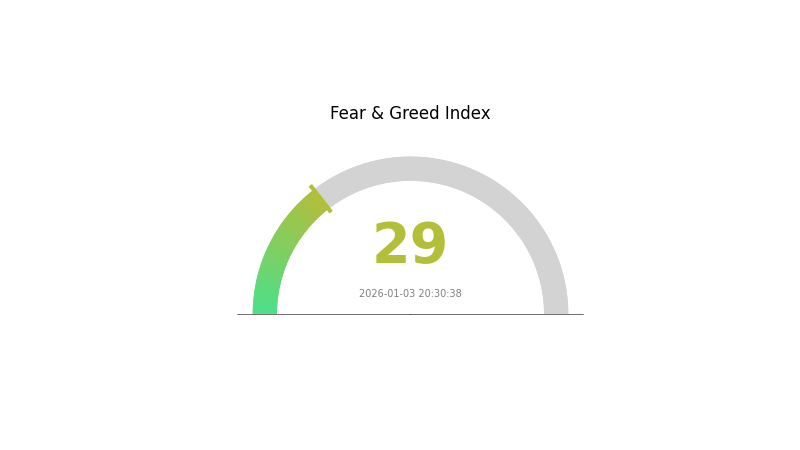
2026-01-03 Fear and Greed Index: 29 (Fear)
Click to view current Fear & Greed Index
The cryptocurrency market is currently experiencing a fear sentiment with an index reading of 29. This indicates significant market pessimism and heightened investor anxiety. When the Fear and Greed Index drops to this level, it typically reflects concerns about potential price declines and market volatility. Investors should exercise caution and avoid impulsive trading decisions. This environment may present opportunities for long-term investors to accumulate assets at lower valuations. Monitor market developments closely and consider your risk tolerance before making any investment decisions on Gate.com.
MARSH Holdings Distribution
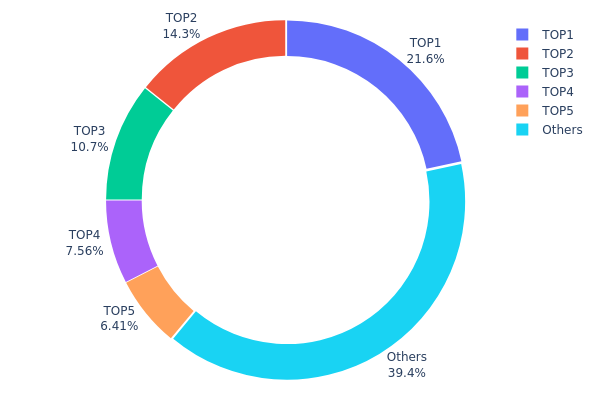
The holdings distribution chart illustrates the concentration of MARSH tokens across blockchain addresses, providing critical insights into the token's decentralization status and market structure. By analyzing the top holders and their respective ownership percentages, we can assess the degree of token concentration and evaluate potential systemic risks associated with wealth inequality within the ecosystem.
Current data reveals moderate concentration characteristics in MARSH's holder base. The top five addresses collectively control approximately 60.6% of total token supply, with the largest holder commanding 21.63% and the second-largest holding 14.28%. While this concentration level is not uncommon in emerging tokens, it warrants attention. The top three addresses alone account for 46.63% of the total supply, indicating significant governance and market influence concentrated among a limited number of stakeholders. However, the "Others" category representing 39.4% of holdings demonstrates that a substantial portion of tokens remains distributed across the broader holder base, suggesting the project has achieved a degree of decentralization beyond purely institutional or early investor control.
From a market dynamics perspective, this distribution structure presents both opportunities and considerations. The concentration among top holders could facilitate coordinated decision-making and project governance, potentially enabling faster implementation of protocol improvements. Conversely, concentrated holdings increase vulnerability to potential market manipulation and price volatility triggered by large-scale transactions from major holders. The current distribution suggests MARSH maintains a relatively balanced ecosystem where neither extreme centralization nor full fragmentation dominates, positioning the token within a reasonable risk profile for a mid-stage blockchain asset.
Click to view current MARSH holdings distribution
| Top | Address | Holding Qty | Holding (%) |
|---|---|---|---|
| 1 | 0x56ee...f120ba | 21635.00K | 21.63% |
| 2 | 0xef38...07a897 | 14283.03K | 14.28% |
| 3 | 0x3bee...2e0f5d | 10722.62K | 10.72% |
| 4 | 0x9642...2f5d4e | 7563.49K | 7.56% |
| 5 | 0x58ed...a36a51 | 6414.82K | 6.41% |
| - | Others | 39381.04K | 39.4% |
II. Core Factors Impacting MARSH's Future Price
Supply Mechanism
- Total Supply Cap: MARSH has a maximum total supply of 100 million tokens, which directly influences price and investment value.
- Historical Patterns: Historical data demonstrates that supply dynamics are a primary driver of price fluctuations.
- Current Impact: Scarcity serves as a fundamental support for long-term investment sustainability.
Macroeconomic Environment
- Monetary Policy Impact: Monetary policy and interest rate fluctuations affect investment attractiveness. As a cryptocurrency asset, MARSH exhibits certain inflation-hedging capabilities under specific economic conditions, though actual effectiveness is influenced by multiple market factors.
- Inflation Hedge Attributes: In inflationary environments, MARSH demonstrates potential safe-haven properties that may enhance investment demand.
- Geopolitical Factors: Geopolitical uncertainty can potentially increase demand for MARSH as investors seek alternative asset protection strategies.
Three、2026-2031 MARSH Price Forecast
2026 Outlook
- Conservative Forecast: $0.00101 - $0.00128
- Neutral Forecast: $0.00128
- Optimistic Forecast: $0.00144 (requiring sustained market sentiment and positive ecosystem developments)
2027-2029 Medium-term Outlook
- Market Stage Expectation: Gradual recovery and consolidation phase with moderate growth trajectory as the project establishes stronger market presence and utility adoption.
- Price Range Forecast:
- 2027: $0.00099 - $0.00192 (6% upside potential)
- 2028: $0.0009 - $0.00185 (27% cumulative growth)
- 2029: $0.0014 - $0.00243 (36% cumulative growth)
- Key Catalysts: Ecosystem expansion, partnership announcements, increased token utility, and broader market recovery trends in the cryptocurrency sector.
2030-2031 Long-term Outlook
- Base Case Scenario: $0.00129 - $0.00263 (assumes steady adoption and moderate market conditions)
- Optimistic Scenario: $0.00226 - $0.00313 (assumes accelerated protocol development and increased institutional interest, representing 62-83% cumulative growth from 2026)
- Transformative Scenario: $0.00313+ (extreme favorable conditions including major exchange listings on platforms like Gate.com, significant DeFi integration, and substantial user base expansion)
- 2026-01-04: MARSH trading at baseline levels with considerable upside potential through 2031
| 年份 | 预测最高价 | 预测平均价格 | 预测最低价 | 涨跌幅 |
|---|---|---|---|---|
| 2026 | 0.00144 | 0.00128 | 0.00101 | 0 |
| 2027 | 0.00192 | 0.00136 | 0.00099 | 6 |
| 2028 | 0.00185 | 0.00164 | 0.0009 | 27 |
| 2029 | 0.00243 | 0.00175 | 0.0014 | 36 |
| 2030 | 0.00263 | 0.00209 | 0.00129 | 62 |
| 2031 | 0.00313 | 0.00236 | 0.00226 | 83 |
MARSH Token Professional Investment Strategy and Risk Management Report
IV. MARSH Professional Investment Strategy and Risk Management
MARSH Investment Methodology
(1) Long-term Holding Strategy
- Target Audience: Institutional investors and long-term believers in multi-chain DeFi infrastructure development
- Operational Recommendations:
- Accumulate during market downturns when MARSH trades below historical support levels, taking advantage of the token's current 98.55% one-year decline
- Establish a dollar-cost averaging (DCA) plan to reduce timing risk, given the token's high volatility profile
- Maintain positions through network development milestones and ecosystem expansion announcements
(2) Active Trading Strategy
-
Market Dynamics Observation:
- Monitor 24-hour trading volume patterns on Gate.com, currently averaging $7,299 daily volume
- Track price action within the 24-hour range of $0.001112 to $0.00145
- Observe momentum indicators during periods of positive price movement like the recent 15.37% 24-hour gain
-
Wave Trading Considerations:
- Capitalize on short-term volatility while maintaining strict stop-loss discipline
- Document entry and exit points relative to 30-day performance baseline (-46.18% monthly decline)
- Use technical resistance levels established by historical price data
MARSH Risk Management Framework
(1) Asset Allocation Principles
- Conservative Investors: 0.5-1% of total crypto portfolio
- Active Investors: 1-3% of total crypto portfolio
- Professional Investors: 3-5% of total crypto portfolio
(2) Risk Hedging Approaches
- Position Sizing: Allocate only capital that can withstand complete loss, given MARSH's extreme volatility and illiquidity profile
- Portfolio Diversification: Balance MARSH holdings with more established multi-chain infrastructure tokens and stablecoins
(3) Secure Storage Solutions
- Cold Storage Recommendation: Gate Web3 Wallet for convenient access while maintaining security standards
- Self-Custody Management: Utilize hardware wallet protocols for holdings exceeding 6 months maintenance threshold
- Security Precautions: Enable multi-signature authentication, maintain private key backups in secure locations, implement regular security audits of wallet addresses
V. MARSH Potential Risks and Challenges
MARSH Market Risks
- Extreme Volatility: MARSH has experienced a devastating 98.55% decline over the past year, demonstrating severe price instability and limited market stability mechanisms
- Severe Liquidity Constraints: With only $7,299 in 24-hour trading volume and a circulating market cap of $85,758, MARSH faces significant liquidity challenges that could result in substantial slippage on larger trades
- Market Capitalization Deterioration: The token ranks 5,078 globally with minimal market dominance (0.0000039%), indicating limited institutional adoption and market recognition
MARSH Regulatory Risks
- Multi-chain Compliance Complexity: As an indexing infrastructure token deployed across multiple blockchains, MARSH may face varying regulatory interpretations across different jurisdictions
- DeFi Regulatory Uncertainty: Increasing global scrutiny of decentralized finance infrastructure could impact token utility and operational viability
- Utility Token Classification: Potential regulatory reclassification of MARSH could affect its market status and trading accessibility
MARSH Technical Risks
- Smart Contract Vulnerability: Multi-chain deployment increases exposure to potential security vulnerabilities across different blockchain environments
- Data Indexing Reliability: Dependence on distributed node operators may create inconsistencies or service interruptions affecting data accuracy
- Ecosystem Adoption Pressure: Limited integration with major DeFi protocols could constrain token utility and demand
VI. Conclusions and Action Recommendations
MARSH Investment Value Assessment
MARSH presents a highly speculative opportunity within the blockchain data indexing sector. While Unmarshal addresses a critical infrastructure need for seamless blockchain data access across multiple chains, the token's current market position reflects significant challenges. The 98.55% annual decline, minimal trading liquidity, and low market capitalization indicate either substantial undervaluation or fundamental adoption challenges. Investors should recognize this as an early-stage, high-risk protocol token suitable only for risk-tolerant participants with extended investment horizons and conviction in multi-chain DeFi infrastructure solutions.
MARSH Investment Recommendations
✅ Beginners: Avoid MARSH trading entirely until you have substantial crypto market experience. The extreme volatility and minimal liquidity create unfavorable conditions for portfolio building. Consider this asset only after establishing positions in more established infrastructure tokens.
✅ Experienced Investors: Conduct extensive research into Unmarshal's node operator ecosystem and data provider partnerships before considering any position. If pursuing exposure, implement strict position sizing (1-2% maximum) and maintain disciplined exit strategies based on predetermined loss thresholds.
✅ Institutional Investors: Evaluate MARSH only after conducting comprehensive due diligence on the Unmarshal protocol's competitive positioning, technical viability, and regulatory compliance framework. Consider engagement with protocol developers to assess infrastructure maturity and long-term sustainability.
MARSH Trading Participation Methods
- Gate.com Direct Trading: Access MARSH trading pairs directly through Gate.com spot trading markets with transparent pricing and reliable order execution
- DCA Investment Programs: Implement systematic accumulation strategies through Gate.com's tools to reduce timing risk and average purchase costs over extended periods
- Staking and Network Participation: Explore opportunities to participate in Unmarshal's indexing network as a contributor, potentially earning MARSH token rewards through node operation or data provision services
Cryptocurrency investment carries extreme risk. This report does not constitute investment advice. Investors must make decisions based on their risk tolerance and conduct independent analysis. Consult with professional financial advisors before making investment decisions. Never invest funds you cannot afford to lose completely.
FAQ
How has MARSH token performed historically and what is the current price trend?
MARSH is currently trading at $0.0012 with a market cap of $89,284.80. The token experienced a 10.10% decline over the past 7 days. 24-hour trading volume reached $7,750.77, showing increased market activity recently.
What are the main factors affecting MARSH price and how to conduct fundamental analysis?
MARSH price is driven by insurance market demand, competitive dynamics, economic conditions, and technology innovation. Fundamental analysis should focus on financial health, market share growth, and strategic developments in the insurance sector.
What are common methods for MARSH price prediction, and how are technical analysis and on-chain data applied?
MARSH price prediction uses technical analysis examining charts, trends, and indicators combined with on-chain data analyzing blockchain transaction volume, holder distribution, and network activity to forecast price movements.
What is the basic situation of MARSH token project, and how are its application scenarios and ecological development prospects?
MARSH token powers digital transformation in the insurance industry, enabling risk management and data analytics. With accelerating industry digitalization, the ecosystem shows strong growth potential and promising long-term prospects.
What risks should I be aware of when investing in MARSH, and how is market liquidity and volatility?
MARSH exhibits significant price volatility requiring careful monitoring. Market liquidity remains moderate with stable trading volume. Key risks include price fluctuations and market sentiment shifts. Long-term prospects depend on protocol adoption and ecosystem development.
What are MARSH's advantages and disadvantages compared to similar tokens?
MARSH excels in decentralized data storage with high efficiency and low costs. However, it faces lower market recognition compared to established competitors, which may impact adoption rates.
Share
Content
Introduction: Market Position and Investment Value of MARSH
I. MARSH Price History Review and Current Market Status
II. Core Factors Impacting MARSH's Future Price
Three、2026-2031 MARSH Price Forecast
IV. MARSH Professional Investment Strategy and Risk Management
V. MARSH Potential Risks and Challenges
VI. Conclusions and Action Recommendations
FAQ
How to Buy Cryptocurrency


2025 EULPrice Prediction: Market Analysis and Future Trends for Euler Finance Token in the DeFi Ecosystem

2025 EDGEPrice Prediction: Analysis of Growth Potential and Market Factors Influencing the Future Value

2025 BENQI Price Prediction: Analyzing Market Trends and Future Valuation for the DeFi Protocol

2025 ASTER Price Prediction: Analyzing Market Trends and Growth Potential for the Emerging Cryptocurrency

2025 OMG Price Prediction: Analyzing Market Trends and Future Potential of the Token in a Maturing Crypto Ecosystem

2025 MORPHO Price Prediction: Analyzing Market Trends and Growth Potential for the DeFi Token

Popular English-Language Telegram Groups and Channels for Finance and Cryptocurrency
What Is the Long/Short Ratio? How to View Long/Short Ratio Data in Futures Trading?

TradFi Opens the Door to Cryptocurrencies: What It Means for Markets in 2026

TradFi Embraces Digital Assets as Japan Signals a New Era of Financial Integration

Is cryptocurrency mining legal in Germany?