2025 SAHARA Price Prediction: Expert Analysis and Market Forecast for the Upcoming Year
Introduction: SAHARA's Market Position and Investment Value
Sahara AI (SAHARA) is the first full-stack, AI-native blockchain platform where anyone can create, contribute to, and monetize AI development, making the future of AI more accessible, equitable, and open to all. Since its launch in 2025, the project has emerged as an innovative solution in the intersection of artificial intelligence and blockchain technology. As of December 2025, SAHARA's market capitalization has reached $269 million with a circulating supply of approximately 2.04 billion tokens, currently trading at $0.0269 per token. This emerging digital asset is playing an increasingly vital role in democratizing AI development and enabling community-driven innovation in the blockchain ecosystem.
This article will comprehensively analyze SAHARA's price trends from 2025 through 2030, integrating historical patterns, market supply and demand dynamics, ecosystem developments, and macroeconomic factors to provide investors with professional price forecasts and practical investment strategies. Whether you are a seasoned cryptocurrency trader or exploring opportunities on Gate.com, this guide will equip you with the insights needed to make informed decisions in the evolving SAHARA market landscape.
I. SAHARA Price History Review and Current Market Status
SAHARA Historical Price Evolution
Based on the available data, SAHARA has experienced significant price volatility since its launch:
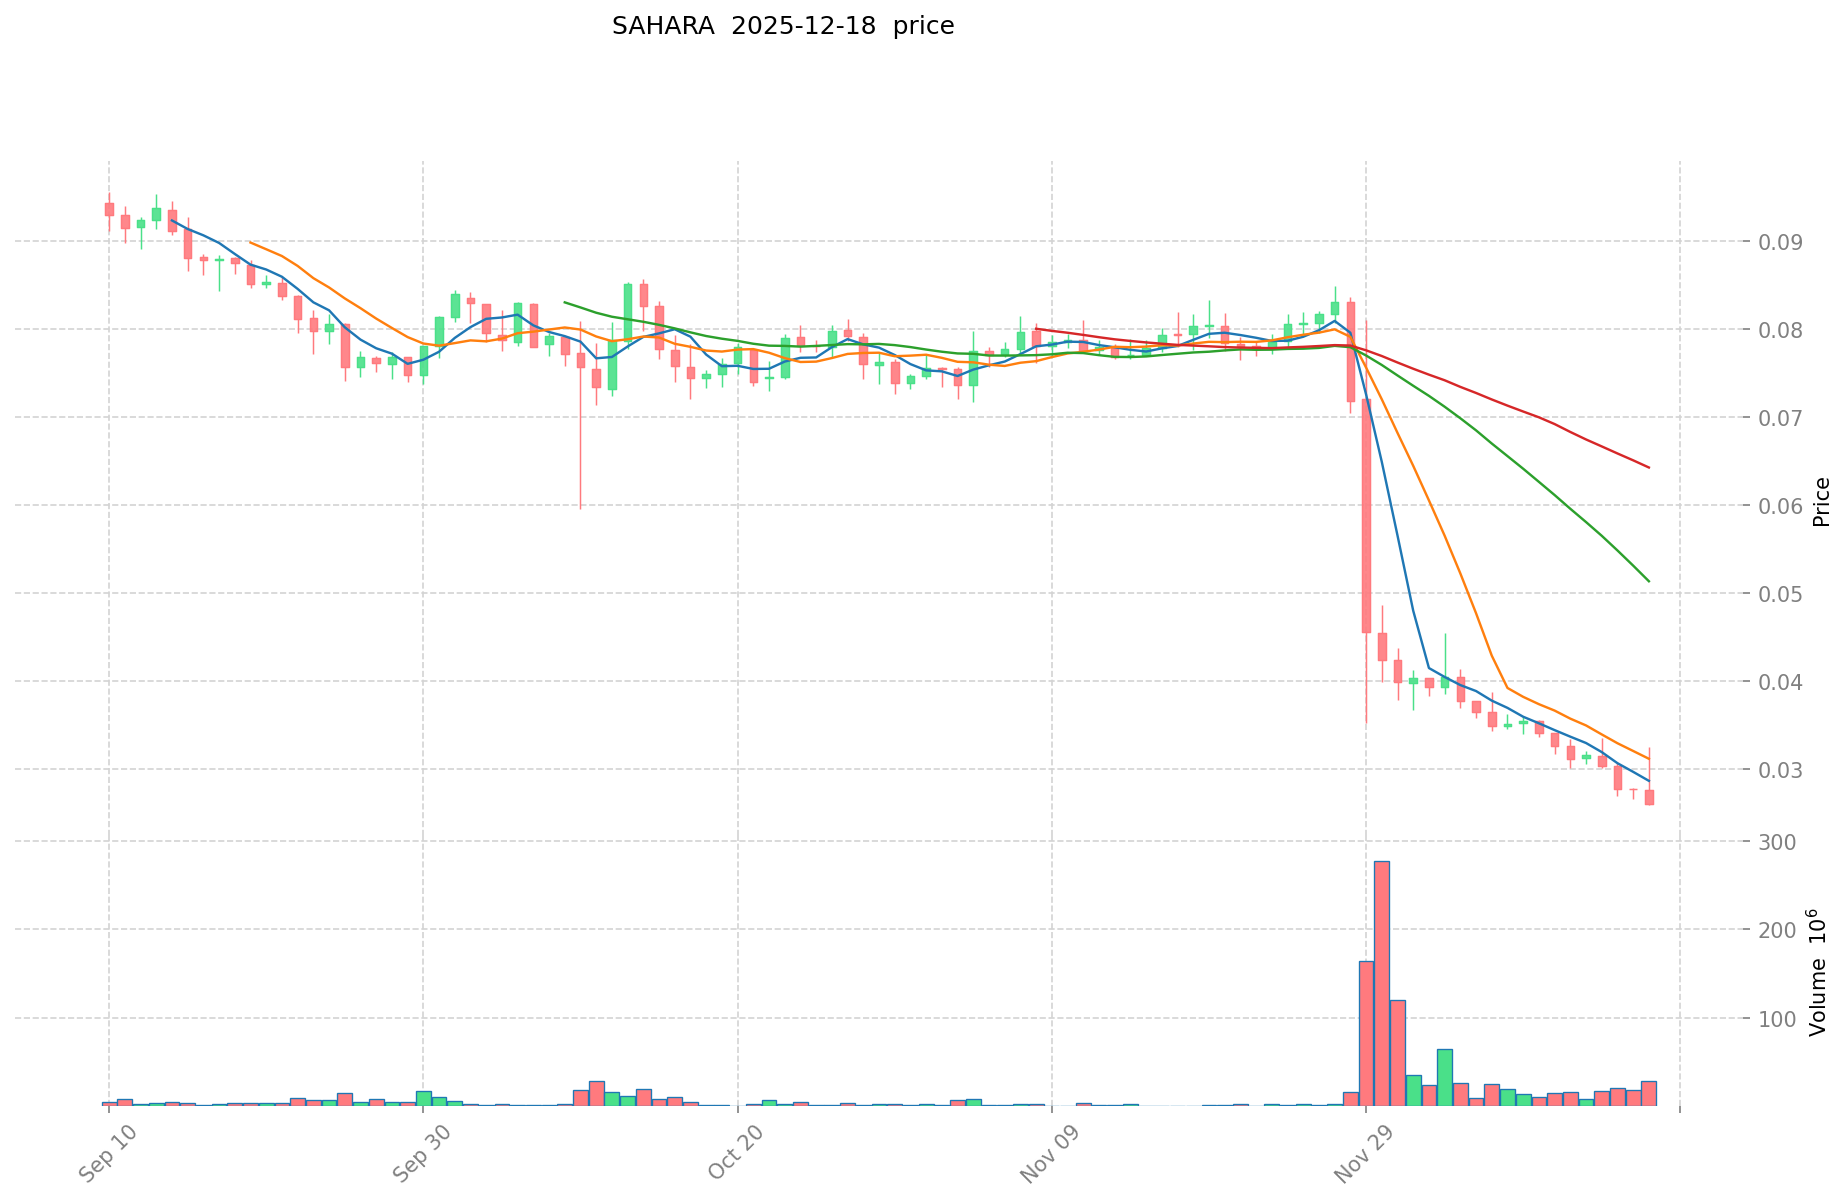
- July 24, 2025: SAHARA reached its all-time high of $0.16712, marking the peak of investor enthusiasm during the early trading period.
- December 18, 2025: SAHARA hit its all-time low of $0.02574, representing a substantial decline from its peak and marking a critical support level in its trading history.
The token has declined approximately 84.6% from its all-time high to its current low, reflecting the substantial correction experienced over this period.
SAHARA Current Market Position
As of December 18, 2025, SAHARA is trading at $0.0269, demonstrating continued volatility in the short term:
- 24-hour performance: The token declined by 2.67%, closing with a range between $0.02574 (low) and $0.03249 (high).
- 7-day trajectory: SAHARA experienced a 16.91% decline over the past week, indicating sustained downward pressure.
- 30-day performance: The token has fallen 65.8% over the month, reflecting a broader correction phase in its valuation.
- Trading volume: 24-hour volume stands at approximately $1.15 million, with the token trading across 37 exchanges.
Market Fundamentals:
- Market capitalization: $54.88 million (circulating supply basis)
- Fully diluted valuation: $269 million
- Circulating supply: 2.04 billion SAHARA (20.4% of total supply)
- Total supply: 10 billion SAHARA tokens
- Active holders: 1,707 addresses
- Market dominance: 0.0086%
Click to view current SAHARA market price
SAHARA Market Sentiment Indicator
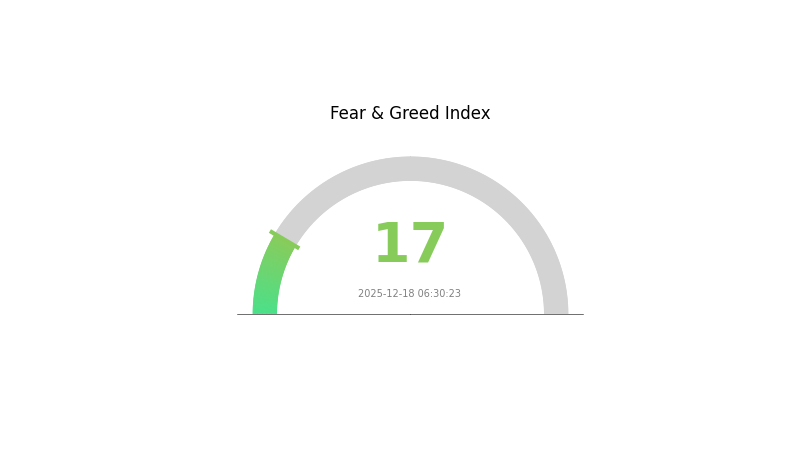
2025-12-18 Fear and Greed Index: 17 (Extreme Fear)
Click to view the current Fear & Greed Index
The cryptocurrency market is currently experiencing extreme fear, with the Fear and Greed Index standing at 17. This exceptionally low reading indicates widespread panic and pessimism among investors. Such extreme fear often presents contrarian opportunities, as markets typically recover from these oversold conditions. However, investors should exercise caution and conduct thorough research before making trading decisions. Consider dollar-cost averaging strategies and maintaining a long-term investment perspective during periods of market uncertainty. Monitor key support levels and market developments closely on Gate.com for potential entry points.
SAHARA Holdings Distribution
An address holdings distribution map reveals the concentration of token ownership across blockchain addresses, serving as a critical indicator of decentralization, market structure, and potential manipulation risks. By analyzing the top holders and their proportional stakes, investors and analysts can assess the degree of wealth concentration and evaluate the stability of the token's on-chain ecosystem.
The SAHARA token exhibits considerable concentration risk, with the top five addresses collectively controlling approximately 70.33% of the total supply. The leading address (0xb9d9...d79c66) dominates with 34.80% of holdings, representing a single point of significant influence over market dynamics. The second-largest holder (0xc92f...35dfd3) commands 19.75%, further amplifying concentration concerns. While the remaining addresses among the top five maintain more moderate positions ranging from 4.99% to 5.79%, their combined influence alongside the two dominant holders creates a highly centralized ownership structure. The dispersed "Others" category accounts for 29.67%, indicating that nearly 70% of tokens remain fragmented across numerous smaller holders.
This pronounced concentration pattern carries meaningful implications for market stability and price volatility. The substantial holdings by top addresses create potential for coordinated capital movements that could trigger sharp price fluctuations, particularly in lower liquidity environments. The concentration degree suggests limited decentralization at present, with governance and market direction heavily influenced by a small number of stakeholders. Monitoring these major address movements through platforms like Gate.com remains essential for assessing on-chain structural risks and anticipating potential market-moving actions by principal holders.
Click to view current SAHARA holdings distribution
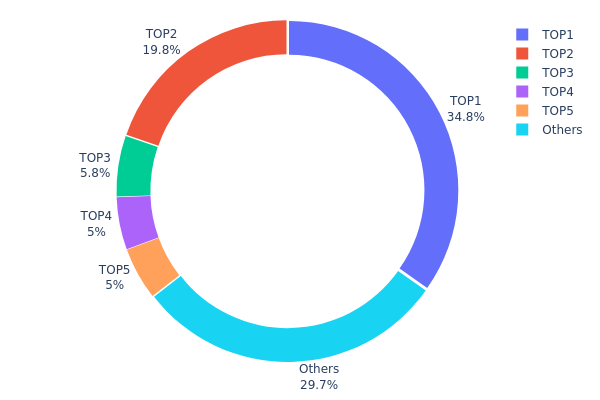
| Top | Address | Holding Qty | Holding (%) |
|---|---|---|---|
| 1 | 0xb9d9...d79c66 | 3480000.00K | 34.80% |
| 2 | 0xc92f...35dfd3 | 1975000.00K | 19.75% |
| 3 | 0xca51...61e222 | 579916.17K | 5.79% |
| 4 | 0x1700...6a8a73 | 500000.00K | 5.00% |
| 5 | 0x5df2...02affd | 500000.00K | 4.99% |
| - | Others | 2965083.83K | 29.67% |
II. Core Factors Affecting SAHARA's Future Price
Technology Development and Ecosystem Construction
-
x402 Protocol Implementation: The x402 protocol enables machine-to-machine model calls and data queries to become instant, micro-transactional automated settlements within the Sahara ecosystem. This innovative mechanism transforms computing power from fixed assets into tradeable on-chain commodities, facilitating real-time value exchange between network participants.
-
Ecosystem Development: Long-term value of the SAHARA token is fundamentally dependent on technical progress and ecosystem development. Post-TGE (Token Generation Event), short-term price volatility is common in InfoFi projects, but sustainable value creation relies on continuous technological advancement and expanding ecosystem applications.
Market Sentiment and Liquidity Dynamics
-
Market Maker Operations: Recent price movements have been significantly influenced by market maker activities. The SAHARA token experienced a sharp decline exceeding 55% due to automated market makers facing liquidation across other projects, resulting in forced position closures. This highlights the vulnerability of token prices to liquidity provider dynamics and exchange-level operational events.
-
TGE Volatility Patterns: Historical data from similar InfoFi projects demonstrates that price fluctuations immediately following token launches are typical market behavior. Rational investment strategies and proper risk management are essential for participants navigating this period.
III. 2025-2030 SAHARA Price Forecast
2025 Outlook
- Conservative Forecast: $0.01732 - $0.02707
- Base Case Forecast: $0.02707
- Optimistic Forecast: $0.03167 (requiring sustained market interest and positive ecosystem developments)
2026-2028 Mid-term Perspective
- Market Stage Expectation: Gradual accumulation phase with incremental price appreciation driven by expanding adoption and ecosystem maturation
- Price Range Forecast:
- 2026: $0.01527 - $0.03201 (9% upside potential)
- 2027: $0.02946 - $0.03192 (14% upside potential)
- 2028: $0.02505 - $0.04508 (16% upside potential)
- Key Catalysts: Protocol upgrades, institutional participation growth, market sentiment improvement, and increasing utility within the ecosystem
2029-2030 Long-term Outlook
- Base Case Scenario: $0.03056 - $0.04736 (41% appreciation from 2025 levels, assuming steady market conditions and moderate adoption expansion)
- Optimistic Scenario: $0.04736 - $0.06331 (59% appreciation by 2030, contingent on accelerated network growth and mainstream recognition)
- Transformative Scenario: Above $0.06331 (extreme bull case requiring breakthrough technological developments, major partnership announcements, or significant macroeconomic tailwinds)
Note: All price forecasts should be monitored through reputable market data sources like Gate.com and adjusted as market conditions evolve. Past performance and predictions do not guarantee future results.
| 年份 | 预测最高价 | 预测平均价格 | 预测最低价 | 涨跌幅 |
|---|---|---|---|---|
| 2025 | 0.03167 | 0.02707 | 0.01732 | 0 |
| 2026 | 0.03201 | 0.02937 | 0.01527 | 9 |
| 2027 | 0.03192 | 0.03069 | 0.02946 | 14 |
| 2028 | 0.04508 | 0.03131 | 0.02505 | 16 |
| 2029 | 0.04736 | 0.03819 | 0.03056 | 41 |
| 2030 | 0.06331 | 0.04278 | 0.02695 | 59 |
SAHARA Professional Investment Strategy and Risk Management Report
I. SAHARA Token Overview
Basic Information
- Token Name: Sahara AI (SAHARA)
- Current Price: $0.0269 (as of December 18, 2025)
- Market Capitalization: $54,876,000
- Fully Diluted Valuation: $269,000,000
- Circulating Supply: 2,040,000,000 SAHARA
- Total Supply: 10,000,000,000 SAHARA
- Market Ranking: #476
- Contract Address: 0xfdffb411c4a70aa7c95d5c981a6fb4da867e1111 (Ethereum)
- Token Standard: ERC-20
Price Performance
- 24H Change: -2.67%
- 7D Change: -16.91%
- 30D Change: -65.8%
- All-Time High: $0.16712 (July 24, 2025)
- All-Time Low: $0.02574 (December 18, 2025)
- 24H Trading Volume: $1,151,317.78
II. SAHARA Project Introduction
Project Overview
Sahara AI is the first full-stack, AI-native blockchain platform where anyone can create, contribute to, and monetize AI development, making the future of AI more accessible, equitable, and open to all.
Key Metrics
- Holders: 1,707 token holders
- Listed Exchanges: 37 trading pairs
- Market Share: 0.0086%
- Circulation Ratio: 20.4%
III. SAHARA Professional Investment Strategy and Risk Management
SAHARA Investment Methodology
(1) Long-Term Holding Strategy
- Target Audience: Investors with strong belief in AI-native blockchain infrastructure and decentralized AI development paradigms
- Operational Recommendations:
- Accumulate during market downturns when SAHARA experiences significant price corrections (currently down 65.8% in 30 days)
- Dollar-cost averaging (DCA) approach to reduce entry point volatility
- Secure holdings in institutional-grade custody solutions
(2) Active Trading Strategy
- Technical Analysis Considerations:
- Monitor support levels near the all-time low of $0.02574
- Identify resistance zones based on historical price action
- Swing Trading Points:
- Watch for oversold conditions following recent 65.8% monthly decline
- Trade around key support and resistance levels identified through chart analysis
SAHARA Risk Management Framework
(1) Asset Allocation Principles
- Conservative Investors: 1-3% of diversified portfolio allocation
- Aggressive Investors: 5-10% of speculative allocation
- Professional Investors: Position sizing based on risk tolerance and portfolio correlation analysis
(2) Risk Hedging Approaches
- Portfolio Diversification: Maintain SAHARA as a small portion of broader cryptocurrency holdings alongside established digital assets
- Position Scaling: Gradually increase exposure through staged entries rather than lump-sum investments
(3) Secure Storage Solution
- Hot Wallet Options: Gate.com Web3 Wallet for active trading and frequent transactions
- Cold Storage Approach: Transfer long-term holdings to hardware security devices with air-gapped security architecture
- Security Best Practices:
- Enable multi-signature authentication where applicable
- Maintain backup recovery phrases in secure, offline locations
- Verify smart contract addresses before any token transfers
- Never share private keys or seed phrases with any third parties
IV. SAHARA Potential Risks and Challenges
SAHARA Market Risk
- High Price Volatility: SAHARA has experienced extreme price swings, declining 65.8% over 30 days and currently trading near all-time lows, indicating significant market instability
- Limited Liquidity Depth: Trading volume of $1.15 million combined with relatively few token holders (1,707) suggests potential liquidity constraints during large trading positions
- Early-Stage Project Risk: As a recently launched token (published November 2025), SAHARA lacks the historical price data and proven market adoption that more established projects demonstrate
SAHARA Regulatory Risk
- Evolving Regulatory Environment: AI-focused blockchain platforms face uncertain regulatory treatment across major jurisdictions
- Jurisdictional Uncertainty: Governments have not yet established clear frameworks for regulating AI-native blockchain platforms
- Compliance Risk: Changes in cryptocurrency regulations could impact token valuation and operational viability
SAHARA Technology Risk
- Execution Risk: The success of the platform depends on flawless technical implementation of complex AI-blockchain integration features
- Smart Contract Vulnerability: All ERC-20 contract interactions carry inherent smart contract risk despite audit history
- Adoption Uncertainty: Achieving meaningful adoption of the AI development platform is critical but unproven
V. Conclusion and Action Recommendations
SAHARA Investment Value Assessment
SAHARA operates in the emerging intersection of artificial intelligence and blockchain technology. While the project presents an innovative vision for decentralized AI development, it faces significant challenges including extreme price volatility, limited liquidity, early-stage operational risk, and uncertain regulatory treatment. The recent 65.8% monthly decline positions the token at all-time lows, potentially indicating either capitulation selling or fundamental concerns about the project's viability. Investors should approach this asset with substantial caution and appropriate position sizing.
SAHARA Investment Recommendations
✅ Beginners: Start with micro-positions (0.5-1% of portfolio) through dollar-cost averaging over extended periods; focus on understanding the project fundamentals before committing capital
✅ Experienced Investors: Consider tactical accumulation at significant support levels while maintaining strict stop-loss discipline; utilize technical analysis to identify asymmetric risk-reward setups
✅ Institutional Investors: Conduct comprehensive due diligence on team credentials, technical architecture, and regulatory compliance; allocate only to specialized innovation or venture funds with appropriate risk disclosure
SAHARA Trading Participation Methods
- Direct Purchase on Gate.com: Access SAHARA trading pairs on Gate.com with professional-grade order types including limit orders, stop-losses, and advanced charting tools
- Gate.com Spot Trading: Buy and hold SAHARA directly through spot market purchases for long-term value accumulation strategies
- Gate.com Wallet Integration: Seamlessly transfer SAHARA between trading accounts and Gate.com Web3 Wallet for self-custody management
Disclaimer: Cryptocurrency investment carries extreme risk, including potential for total capital loss. This report does not constitute investment advice. All investors must conduct independent research and consult qualified financial advisors before making investment decisions. Never invest capital you cannot afford to lose. Past performance does not guarantee future results. Regulatory status and project fundamentals may change rapidly in the cryptocurrency sector.
FAQ
How much will Sahara AI coin cost in 2030?
Based on current market trends and predictions, Sahara AI coin is forecasted to reach approximately $0.258719 in early 2030, with potential fluctuations ranging between $0.251577 and $0.258719 throughout the year.
How much is a Sahara AI worth?
Sahara AI (SAHARA) is currently worth $0.02709 as of December 18, 2025. The price has experienced recent fluctuations, with a 1.9% decline in the last hour and 1.2% decline since yesterday.
How much is Sahara AI coin worth today?
Sahara AI coin is currently worth $0.0278 today. It has risen by 1.41% in the last 24 hours with a trading volume of $15.26 million.
Which coin price prediction 2025?
SAHARA's 2025 price trajectory depends on market conditions and adoption rates. Based on technical analysis, potential targets range from $0.50 to $2.00, with strong support levels at $0.35. Monitor trading volume and ecosystem developments for confirmation signals.
Share
Content
Introduction: SAHARA's Market Position and Investment Value
I. SAHARA Price History Review and Current Market Status
II. Core Factors Affecting SAHARA's Future Price
III. 2025-2030 SAHARA Price Forecast
I. SAHARA Token Overview
II. SAHARA Project Introduction
III. SAHARA Professional Investment Strategy and Risk Management
IV. SAHARA Potential Risks and Challenges
V. Conclusion and Action Recommendations
FAQ
How to Buy Cryptocurrency


Trending Cryptocurrencies


2025 TAO Price Prediction: Analyzing Market Trends and Growth Potential in the Evolving Crypto Ecosystem
2025 FET Price Prediction: Bullish Trends and Key Factors Driving Fetch.ai's Future Value

Is Bittensor (TAO) a good investment?: Analyzing the potential and risks of this AI-powered cryptocurrency

Is Act I: The AI Prophecy (ACT) a Good Investment?: Analyzing Risks and Potential Returns in the Emerging AI Token Market

What is AITECH: Exploring the Frontier of Artificial Intelligence Technology

2025 IQPrice Prediction: Analyzing Market Trends and Growth Potential for the Next Bull Cycle
How does LAB token price volatility compare to Bitcoin and Ethereum in 2026?
What Is FTN Price Volatility: Why Did FTN Drop From $4.4 to $1.95 in 2025?
Goerli Testnet
The Rise of AI Linked Debt: What Investors Should Know in 2026
Boinkers 2025 Airdrop: The Complete Guide – How to Get Free BOINK Tokens