2025 SAHARA Price Prediction: Expert Analysis and Market Outlook for the Coming Year
Introduction: Market Position and Investment Value of SAHARA
Sahara AI (SAHARA), the first full-stack, AI-native blockchain platform, has established itself as a pioneering solution enabling anyone to create, contribute to, and monetize AI development since its launch in 2025. As of December 2025, SAHARA has achieved a market capitalization of approximately $267.3 million, with a circulating supply of 2.04 billion tokens, currently trading at $0.02673 per token. This innovative asset, recognized for democratizing access to AI infrastructure on the blockchain, is playing an increasingly critical role in reshaping the intersection of artificial intelligence and decentralized technology.
This article provides a comprehensive analysis of SAHARA's price trajectory from 2025 through 2030, integrating historical market patterns, supply-demand dynamics, ecosystem development, and macroeconomic factors to deliver professional price forecasts and actionable investment strategies for market participants.
I. SAHARA Price History Review and Market Status
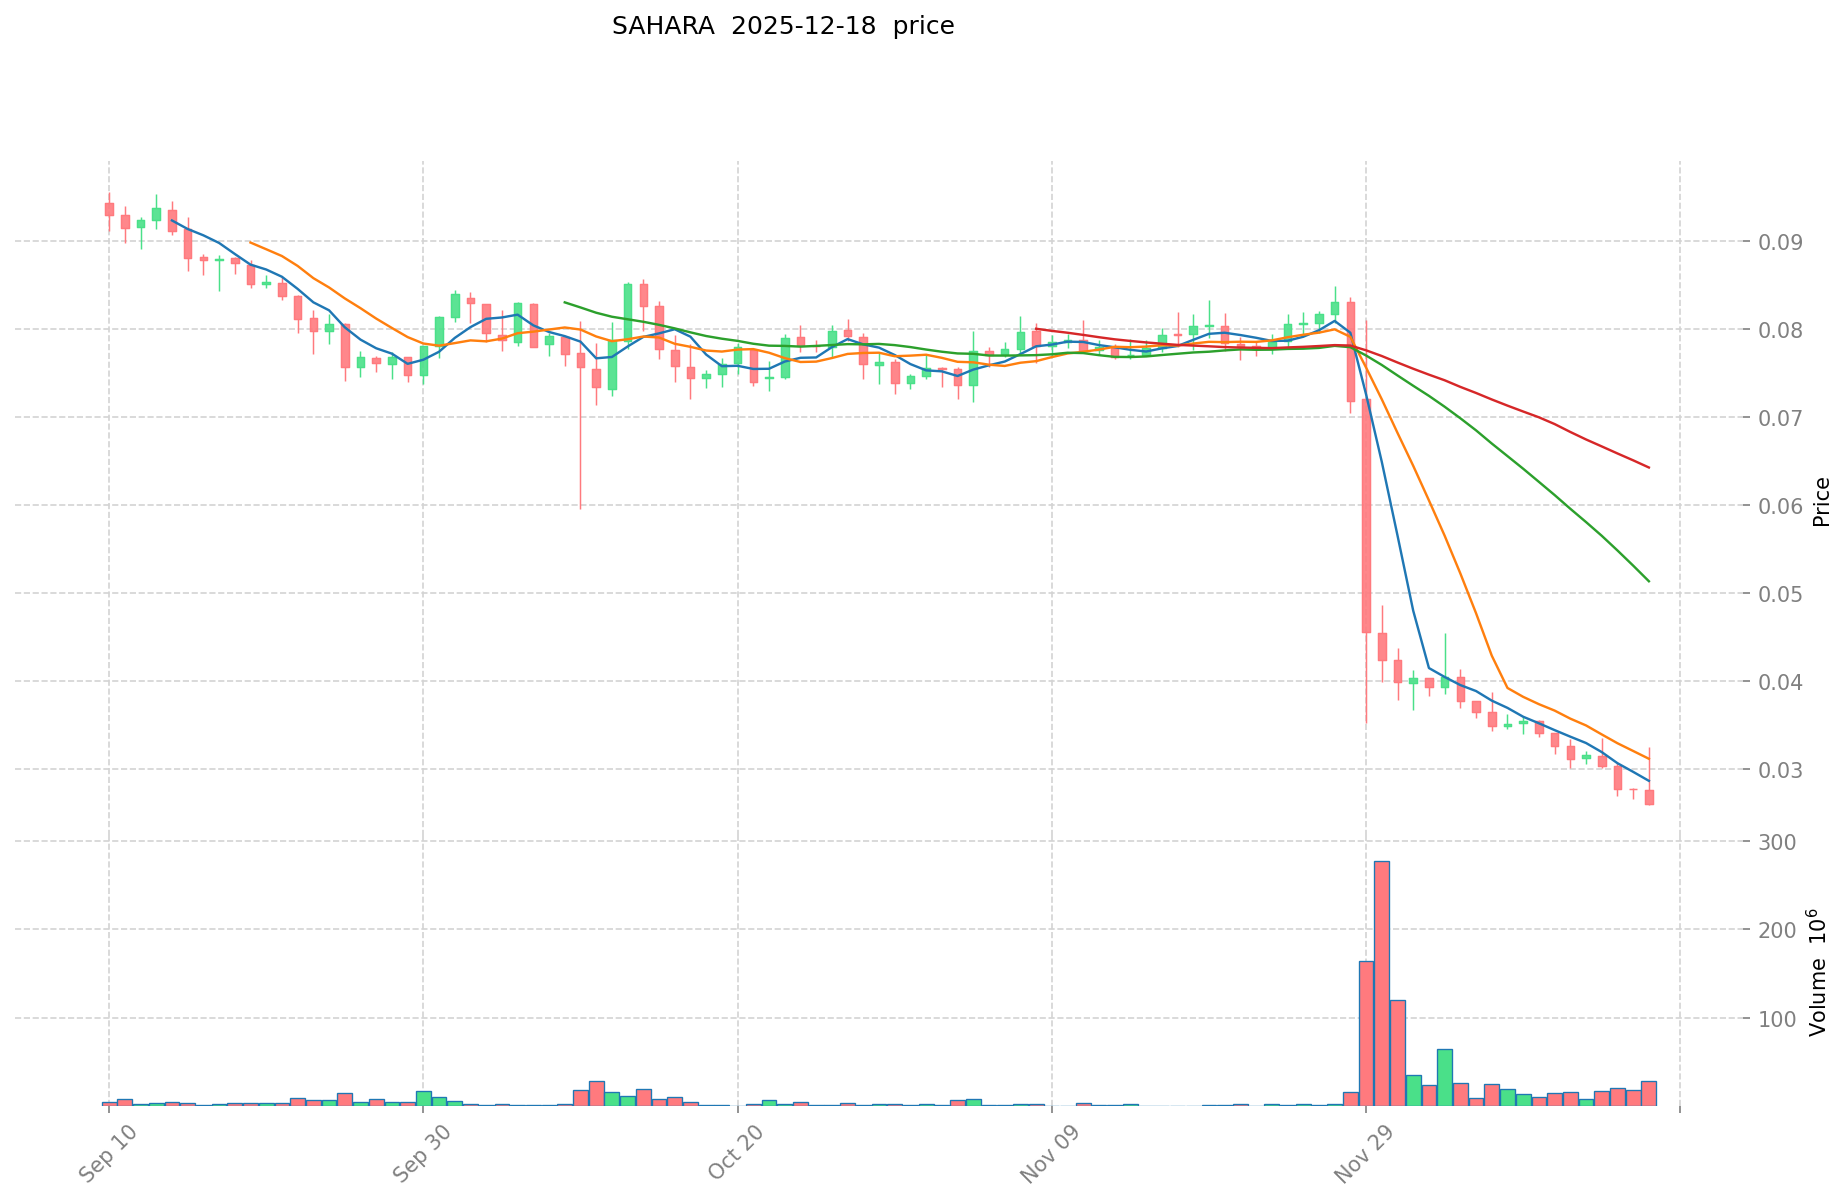
SAHARA Historical Price Development Trajectory
Based on available data, SAHARA experienced significant price movement since its launch:
- July 24, 2025: Token reached its all-time high (ATH) of $0.16712, marking peak market enthusiasm during the early trading period.
- December 18, 2025: Token reached its all-time low (ATL) of $0.02574, representing a substantial correction from peak levels.
SAHARA Current Market Situation
As of December 18, 2025, SAHARA is trading at $0.02673, reflecting ongoing market volatility and bearish sentiment. Key market metrics include:
Price Performance:
- 1-hour change: -0.55%
- 24-hour change: -2.72%
- 7-day change: -17.09%
- 30-day change: -65.78%
Market Capitalization and Supply:
- Market cap: $54,529,200 USD
- Fully diluted valuation: $267,300,000 USD
- Circulating supply: 2,040,000,000 SAHARA (20.4% of total supply)
- Total supply: 10,000,000,000 SAHARA
- Market dominance: 0.0086%
Trading Activity:
- 24-hour trading volume: $1,166,442.41 USD
- Token holders: 1,707
- Listed on 37 exchanges globally
- Available on Gate.com for trading
Market Sentiment: The current market environment reflects extreme fear (VIX: 17), with SAHARA exhibiting significant downward pressure over the month, having declined 65.78% over the past 30 days from its launch price of $0.06.
Click to view current SAHARA market price
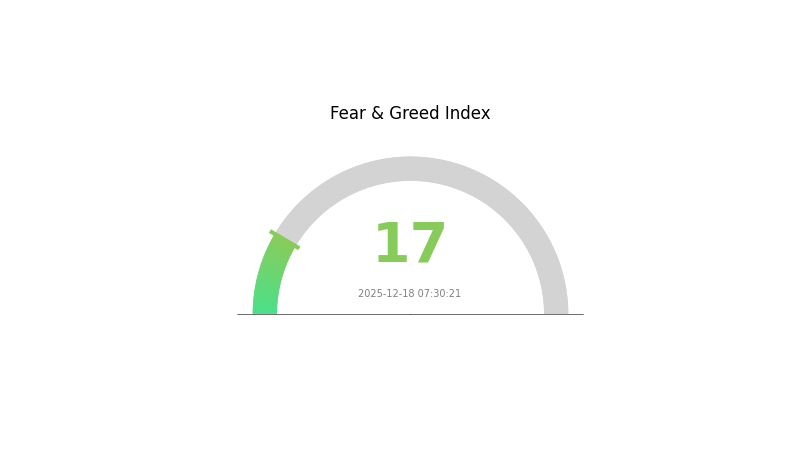
SAHARA Market Sentiment Index
2025-12-18 Fear and Greed Index: 17 (Extreme Fear)
Click to view current Fear & Greed Index
The crypto market is currently experiencing extreme fear, with the Fear and Greed Index plummeting to 17. This indicates heightened market anxiety and risk aversion among investors. Such extreme fear conditions often present contrarian opportunities, as excessive pessimism can precede market reversals. However, caution remains warranted as downward momentum may continue. Investors should carefully assess their risk tolerance and portfolio allocation. Consider dollar-cost averaging strategies rather than making large lump-sum investments during such volatile periods. Monitor key support levels and market catalysts closely for potential turning points.
SAHARA Token Holdings Distribution
The address holdings distribution represents the concentration of SAHARA tokens across blockchain addresses, serving as a critical indicator of token ownership structure and potential market concentration risks. This metric helps investors assess the decentralization level of the project and evaluate the likelihood of coordinated market movements or price manipulation.
The current distribution data reveals a notably concentrated holder landscape. The top two addresses collectively control 54.55% of all SAHARA tokens in circulation, with the leading address (0xb9d9...d79c66) alone commanding 34.80% of total supply. This level of concentration presents significant structural imbalances in token distribution. When combined with the third and fourth largest holders, the top four addresses account for approximately 65.34% of all holdings, indicating that a relatively small number of stakeholders possess decisive control over the asset's supply dynamics. The remaining 29.67% distributed among other addresses suggests moderate dispersion beyond the primary holders, though this fragmentation does not substantially offset the pronounced concentration at the top tier.
Such concentration patterns carry material implications for market structure stability. High token concentration among a limited set of addresses elevates the theoretical risk of coordinated selling pressure or price volatility triggered by large holders' decisions. This distribution underscores SAHARA's current positioning within the broader market, where decentralization remains incomplete and token ownership exhibits characteristics typical of projects in developmental or early institutional accumulation phases. Monitoring shifts in this distribution profile will be essential for assessing whether the project progresses toward more balanced token dispersion over time.
Access current SAHARA Holdings Distribution
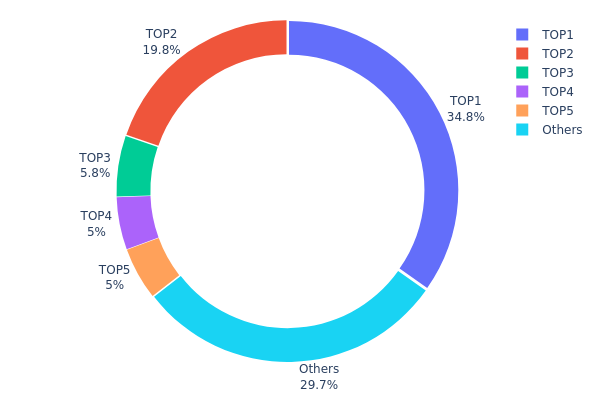
| Top | Address | Holding Qty | Holding (%) |
|---|---|---|---|
| 1 | 0xb9d9...d79c66 | 3480000.00K | 34.80% |
| 2 | 0xc92f...35dfd3 | 1975000.00K | 19.75% |
| 3 | 0xca51...61e222 | 579916.17K | 5.79% |
| 4 | 0x1700...6a8a73 | 500000.00K | 5.00% |
| 5 | 0x5df2...02affd | 500000.00K | 4.99% |
| - | Others | 2965083.83K | 29.67% |
II. Core Factors Affecting SAHARA's Future Price
Technology Development and Ecosystem Construction
-
X402 Protocol: This protocol enables machine-to-machine interactions for model invocations and data queries to become real-time, micro-transaction automatic settlements. Computing power transforms from a fixed asset into an on-chain tradable commodity within Sahara's ecosystem.
-
Ecosystem Applications: The project's long-term value depends on continuous technological advancement and ecosystem development. Post-TGE (Token Generation Event), price volatility in the short term is common, but sustainable growth is driven by robust technical infrastructure and expanding ecosystem applications.
Market Dynamics and Sentiment
-
Market Volatility: SAHARA token experienced a price crash exceeding 55%, caused by its market maker's forced liquidation on other projects by exchanges, resulting in position liquidation. Current market sentiment significantly influences price movements.
-
Price Fluctuation Patterns: As an InfoFi protocol token following TGE launch, historical precedents show that short-term price fluctuations are typical. Investor sentiment and market dynamics play crucial roles in near-term price discovery.
Risk Management Note: Rational investment practices and comprehensive risk management are essential for participants navigating SAHARA's post-launch volatility. Investors should focus on the project's technical development and ecosystem expansion rather than short-term price movements.
Three、2025-2030 SAHARA Price Forecast
2025 Outlook
- Conservative Prediction: $0.02005 - $0.02673
- Neutral Prediction: $0.02673 (average price)
- Optimistic Prediction: $0.03635 (peak potential)
2026-2028 Mid-term Outlook
- Market Phase Expectation: Gradual recovery and consolidation phase, with the asset showing steady appreciation potential as market sentiment stabilizes and adoption metrics improve.
- Price Range Forecast:
- 2026: $0.02082 - $0.03533 (18% upside potential)
- 2027: $0.03243 - $0.04413 (25% upside potential)
- 2028: $0.02909 - $0.04344 (45% upside potential)
- Key Catalysts: Enhanced ecosystem development, increased institutional interest, improved liquidity conditions on trading platforms like Gate.com, and positive regulatory developments in major markets.
2029-2030 Long-term Outlook
- Base Case Scenario: $0.02138 - $0.04275 (53% appreciation from current levels, assuming steady market conditions and consistent project execution)
- Optimistic Scenario: $0.03438 - $0.04445 (56% appreciation, assuming accelerated adoption and broader market expansion)
- Transformational Scenario: $0.04445+ (with extreme favorable conditions including mainstream adoption, significant partnership announcements, and positive macroeconomic catalysts)
Note: All price predictions are subject to market volatility and should be considered as reference points rather than guaranteed outcomes. Investors are advised to conduct independent research and risk management through reputable platforms like Gate.com.
| 年份 | 预测最高价 | 预测平均价格 | 预测最低价 | 涨跌幅 |
|---|---|---|---|---|
| 2025 | 0.03635 | 0.02673 | 0.02005 | 0 |
| 2026 | 0.03533 | 0.03154 | 0.02082 | 18 |
| 2027 | 0.04413 | 0.03343 | 0.03243 | 25 |
| 2028 | 0.04344 | 0.03878 | 0.02909 | 45 |
| 2029 | 0.04275 | 0.04111 | 0.02138 | 53 |
| 2030 | 0.04445 | 0.04193 | 0.03438 | 56 |
Sahara AI (SAHARA) Professional Investment Strategy and Risk Management Report
IV. SAHARA Professional Investment Strategy and Risk Management
SAHARA Investment Methodology
(1) Long-term Holding Strategy
-
Target Investors: Crypto enthusiasts interested in AI-native blockchain infrastructure, risk-tolerant investors with 2-5 year investment horizons, and those believing in decentralized AI development platforms.
-
Operational Recommendations:
- Accumulate positions during market downturns (DCA strategy): Given SAHARA's 65.78% decline over 30 days and current all-time low of $0.02574, consider dollar-cost averaging to reduce timing risk while building long-term positions.
- Hold through technology maturation cycles: Monitor platform development milestones and ecosystem growth before evaluating exit points.
- Reinvest rewards and governance tokens: Participate in protocol incentives to maximize long-term value capture from AI development monetization features.
-
Storage Solution:
- For quantities under 10,000 SAHARA: Use Gate.com Web3 Wallet for convenient access to trading and staking features.
- For quantities over 10,000 SAHARA: Consider cold storage solutions on Ethereum-compatible networks with hardware wallet backups for enhanced security.
(2) Active Trading Strategy
-
Technical Analysis Tools:
- Moving Averages (MA): Use 7-day and 30-day MAs to identify trend reversals; current price $0.02673 trades near 30-day lows, suggesting potential oversold conditions.
- Relative Strength Index (RSI): Monitor for oversold conditions (RSI below 30) and overbought conditions (RSI above 70) to time entry and exit points.
- Volume Analysis: Track 24-hour volume of $1.17M against total supply to gauge market interest and liquidity conditions.
-
Range Trading Key Points:
- Support Level: $0.02574 (24-hour low and all-time low as of current date).
- Resistance Level: $0.03249 (24-hour high).
- Trading Range: Execute buy orders near support and sell orders near resistance; maintain 3-5% position sizing per trade.
- Monitor catalyst events: Watch for announcements regarding AI development platform updates, partnerships, or ecosystem expansions.
SAHARA Risk Management Framework
(1) Asset Allocation Principles
-
Conservative Investors: 1-2% of diversified portfolio - SAHARA exposure should be limited given the high-volatility nature of AI-native blockchain projects and recent significant drawdowns.
-
Active Investors: 3-5% of portfolio - Suitable for investors comfortable with 65.78% monthly volatility and seeking exposure to emerging AI infrastructure trends.
-
Professional Investors: 5-10% of portfolio - May allocate higher percentages while implementing sophisticated hedging strategies and conducting deep technical due diligence on the platform's development progress.
(2) Risk Hedging Solutions
-
Stablecoin Reserves: Maintain 40-60% of investment capital in USDC or USDT to capitalize on flash crashes and reduce forced liquidation risks during market downturns.
-
Portfolio Diversification: Balance SAHARA holdings with established AI tokens and broader crypto infrastructure assets to reduce concentration risk; consider 20-30% allocation to Bitcoin or Ethereum as portfolio stabilizers.
(3) Security Storage Solutions
-
Hot Wallet Recommendation: Gate.com Web3 Wallet - Enables direct trading on Gate.com platform with built-in security features, 2FA protection, and easy access to liquidity when needed.
-
Cold Storage Option: Transfer SAHARA tokens to Ethereum cold wallets or hardware-secured addresses when holding more than 6 months; ensure private keys are stored in secure offline locations with multi-signature backup.
-
Security Precautions: Never share seed phrases or private keys; enable all available security features on Gate.com; verify contract address (0xfdffb411c4a70aa7c95d5c981a6fb4da867e1111) before any token transactions; avoid clicking suspicious links from social media or email.
V. SAHARA Potential Risks and Challenges
SAHARA Market Risks
-
Severe Price Volatility: SAHARA has experienced a 65.78% decline over 30 days and trades at all-time lows ($0.02574), indicating extreme market sentiment deterioration and high potential for further liquidations.
-
Low Trading Liquidity: 24-hour volume of $1.17M against $267.3M market cap suggests thin order books and potential slippage on large orders; exit liquidity may be challenging during market stress.
-
Concentrated Holder Distribution: With only 1,707 token holders against 10 billion total supply (20.4% circulation), large holders possess significant sell-side pressure potential; whale movements could trigger cascading losses.
SAHARA Regulatory Risks
-
ERC-20 Classification Uncertainty: Regulatory clarity on whether SAHARA functions as a utility token, security, or commodity remains ambiguous; future SEC or international regulatory actions could restrict trading or cause delistings.
-
Decentralized AI Governance Compliance: As an AI-native platform enabling monetization of AI development, regulators may scrutinize data privacy, algorithmic bias accountability, and potential misuse of AI models.
-
Geographic Trading Restrictions: Certain jurisdictions may restrict SAHARA trading or restrict platform access; investors in regulated regions should verify local compliance before trading.
SAHARA Technology Risks
-
Platform Adoption Risk: Success depends on developer adoption and user engagement; if the AI development marketplace fails to attract creators, tokenomics may deteriorate.
-
Smart Contract Vulnerabilities: New AI-focused blockchain infrastructure may contain undiscovered bugs or security vulnerabilities; a major exploit could lead to 50%+ value destruction.
-
Competition from Established Platforms: Major blockchain projects and Web3 platforms are rapidly adding AI features; SAHARA's first-mover advantage may erode as competitors scale.
VI. Conclusion and Action Recommendations
SAHARA Investment Value Assessment
Sahara AI represents a speculative bet on AI-native blockchain infrastructure with significant downside risk and speculative upside potential. The 65.78% monthly decline reflects either market repricing of fundamentals or panic selling of early positions. The project's long-term value depends on ecosystem adoption, regulatory clarity, and successful platform monetization. Current conditions suggest a highly volatile environment unsuitable for risk-averse investors but potentially attractive for experienced traders with extended time horizons and capital preservation strategies.
SAHARA Investment Recommendations
✅ Beginners: Start with 0.5-1% portfolio allocation through Gate.com; purchase only amounts you can afford to lose entirely; use Gate.com Web3 Wallet for secure storage; focus on understanding the AI-native blockchain concept before expanding exposure.
✅ Experienced Investors: Consider 2-5% allocation using laddered entry strategy (buying at multiple price points); implement stop-loss orders at -15% to -20% below entry points; actively trade the 20-30% range between $0.02574-$0.03249 support and resistance; monitor platform development announcements closely.
✅ Institutional Investors: Conduct comprehensive technical audit of platform smart contracts; negotiate OTC block trades on Gate.com to minimize slippage; establish position limits at 5-10% of portfolio with quarterly rebalancing; require legal review of token classification before trading.
SAHARA Trading Participation Methods
-
Spot Trading on Gate.com: Direct purchase of SAHARA tokens using USDT, USDC, or other stablecoins; available 24/7 with competitive fees and high liquidity for most order sizes.
-
Grid Trading Strategy: Utilize automated Gate.com trading bots to execute multiple buy/sell orders within the $0.02574-$0.03249 range, capturing incremental profits from volatility.
-
DCA (Dollar-Cost Averaging): Set up recurring purchases of fixed USDT amounts converted to SAHARA on Gate.com weekly or monthly to reduce timing risk and accumulate positions systematically.
Cryptocurrency investment carries extreme risk. This report does not constitute investment advice. Investors must make decisions based on their individual risk tolerance and financial situation. Strongly recommend consulting professional financial advisors before investing. Never invest more capital than you can afford to lose completely. Past performance does not guarantee future results. Market conditions are subject to rapid change without notice.
FAQ
How much will Sahara AI coin cost in 2030?
Sahara AI coin is predicted to reach approximately $0.258719 in early 2030, with potential fluctuations to around $0.251577 by month's end, based on current market trend analysis.
How much is a Sahara AI worth?
Sahara AI (SAHARA) is currently worth $0.02709 as of December 18, 2025. The price has declined 1.9% in the past hour and 1.2% over the last 24 hours, reflecting recent market movements in the cryptocurrency sector.
How much is Sahara AI coin worth today?
Sahara AI coin is currently worth $0.0278 as of today. It has increased by 1.41% in the last 24 hours, with a 24-hour trading volume of $15.26 million.
Which coin price prediction 2025?
SAHARA's 2025 price outlook depends on market dynamics and adoption growth. Based on current trends, analysts project potential upside with increased utility. Monitor key support levels and trading volume for confirmation of bullish momentum in the coming months.
Share
Content
Introduction: Market Position and Investment Value of SAHARA
I. SAHARA Price History Review and Market Status
II. Core Factors Affecting SAHARA's Future Price
Three、2025-2030 SAHARA Price Forecast
IV. SAHARA Professional Investment Strategy and Risk Management
V. SAHARA Potential Risks and Challenges
VI. Conclusion and Action Recommendations
FAQ
How to Buy Cryptocurrency


Trending Cryptocurrencies


why is crypto crashing and will it recover ?
2025 US Price Prediction: Expert Analysis of Market Trends and Economic Forecasts for the Coming Year
2025 AITECH Price Prediction: Expert Analysis and Market Forecast for the Coming Year
2025 PAAL Price Prediction: Expert Analysis and Market Forecast for the Coming Year

Where to Find Alpha in the 2025 Crypto Spot Market

Sahara AI (SAHARA) Price Analysis: Recent Volatility Trends and Market Correlations

How does macro economy impact crypto prices: Fed policy, inflation data, and traditional market effects on Bitcoin and Dogecoin in 2026
How to Use Technical Indicators (MACD, RSI, KDJ, Bollinger Bands) for Crypto Price Prediction in 2026
How to Analyze Pi Network On-Chain Data: Active Addresses, Transaction Volume, and Whale Movements in 2026
FEG Token 2026 Deep Market Analysis and Investment Risk Assessment — Comprehensive Breakdown of Price Trends and Contract Developments
# What Is Solana (SOL) Price Volatility: History, Support & Resistance Levels in 2026