2025 SAROS Price Prediction: Analyzing Market Trends and Potential Growth Factors
Introduction: SAROS's Market Position and Investment Value
Saros (SAROS), as a comprehensive web3 application on the Solana blockchain, has made significant strides since its inception. As of 2025, SAROS's market capitalization has reached $617,924,959, with a circulating supply of approximately 2,624,999,826 tokens, and a price hovering around $0.2354. This asset, often referred to as the "Solana ecosystem enhancer," is playing an increasingly crucial role in decentralized finance (DeFi), identity solutions, and mobile consumer applications.
This article will provide a comprehensive analysis of SAROS's price trends from 2025 to 2030, considering historical patterns, market supply and demand, ecosystem development, and macroeconomic factors to offer professional price predictions and practical investment strategies for investors.
I. SAROS Price History Review and Current Market Status
SAROS Historical Price Evolution
- 2024: Initial launch on DEX, price started at $0.01
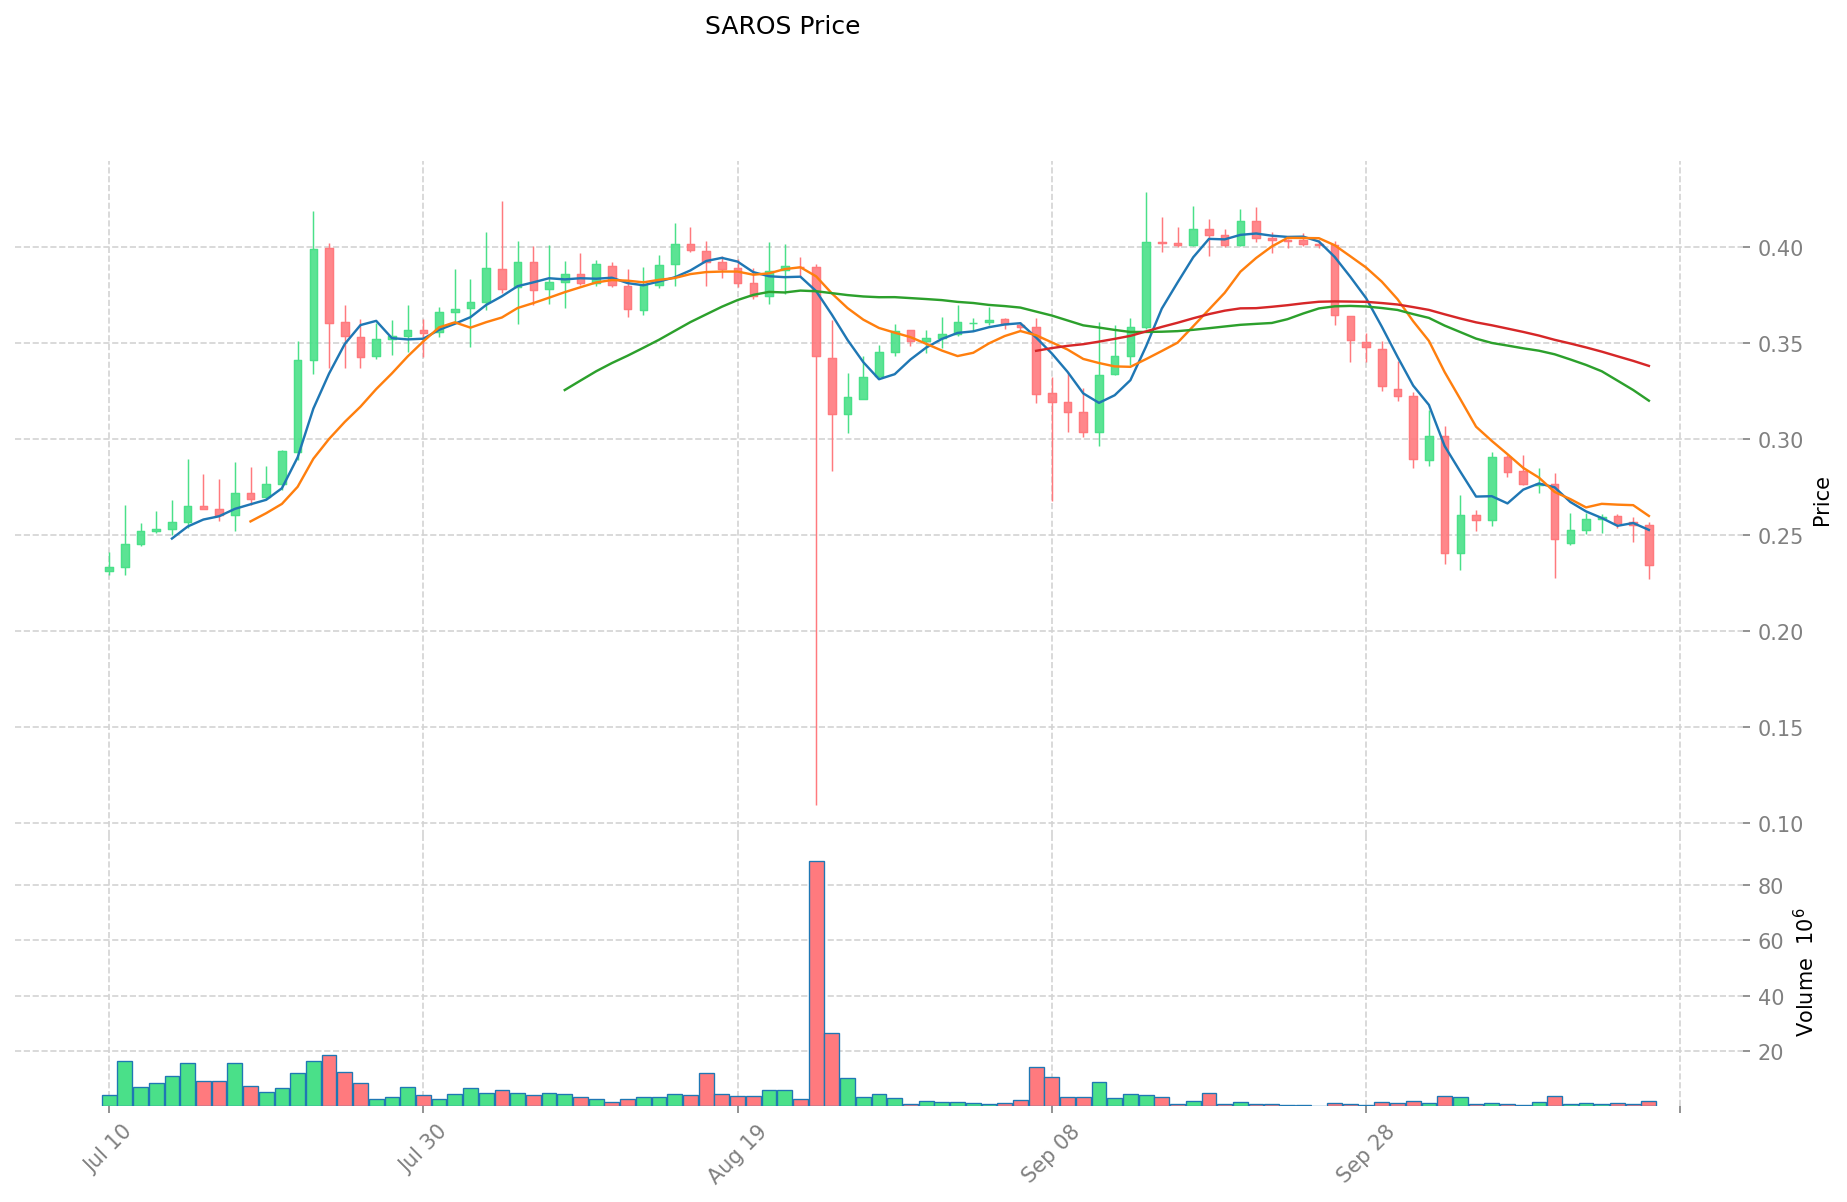
- 2025: Strategic evolution into a comprehensive product, price reached all-time high of $0.429 on September 14
SAROS Current Market Situation
As of October 17, 2025, SAROS is trading at $0.2354, experiencing a 24-hour decline of 8.02%. The token has seen significant volatility in recent periods, with a 7-day decrease of 15.079% and a 30-day drop of 41.51%. Despite these short-term downtrends, SAROS has shown remarkable growth over the past year, with a 11,948.13% increase from its previous year's price.
The current market capitalization stands at $617,924,959.04, ranking SAROS at 129th in the global cryptocurrency market. With a circulating supply of 2,624,999,826 SAROS tokens out of a total supply of 10 billion, the project has a circulating ratio of 26.25%. The fully diluted valuation is $2,354,000,000.
Trading volume in the last 24 hours reached $482,551.24, indicating active market participation. The token's all-time high of $0.429 was achieved recently on September 14, 2025, while its all-time low of $0.001029 was recorded on August 5, 2024, showcasing the token's significant price appreciation since its inception.
Click to view the current SAROS market price
SAROS Market Sentiment Indicator
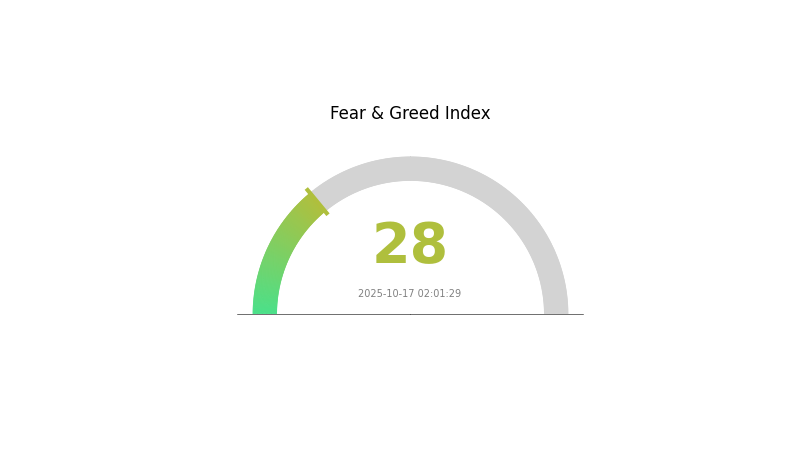
2025-10-17 Fear and Greed Index: 28 (Fear)
Click to view the current Fear & Greed Index
The crypto market is currently experiencing a period of fear, with the Fear and Greed Index at 28. This indicates a cautious sentiment among investors, potentially driven by market uncertainties or recent price fluctuations. During such times, some traders view it as an opportunity to accumulate assets, following the contrarian approach of "be fearful when others are greedy, and greedy when others are fearful." However, it's crucial to conduct thorough research and exercise caution before making any investment decisions in this volatile market.
SAROS Holdings Distribution
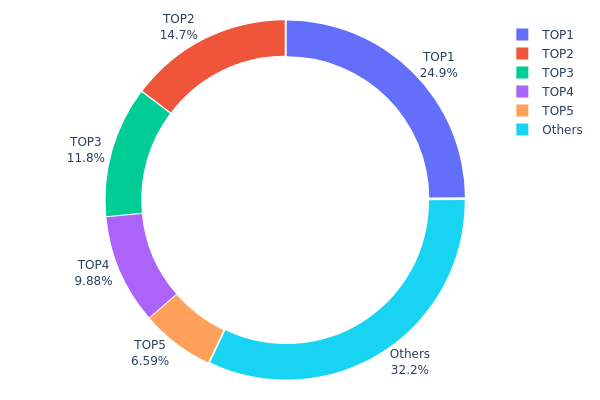
The address holdings distribution data for SAROS reveals a significant concentration of tokens among the top holders. The largest address holds 24.87% of the total supply, with the top 5 addresses collectively controlling 67.8% of SAROS tokens. This high concentration suggests a relatively centralized ownership structure, which could potentially impact market dynamics.
Such a concentrated distribution raises concerns about market volatility and susceptibility to price manipulation. Large holders, often referred to as "whales," have the capacity to influence token prices through substantial buy or sell orders. The current distribution indicates that a small number of entities could exert considerable influence over SAROS's market performance.
However, it's worth noting that 32.2% of tokens are distributed among other addresses, indicating some level of broader participation. While this provides a degree of decentralization, the overall structure suggests that SAROS's on-chain stability and market behavior may be significantly influenced by the actions of its top holders.
Click to view the current SAROS Holdings Distribution
| Top | Address | Holding Qty | Holding (%) |
|---|---|---|---|
| 1 | GMHPeJ...k7fPGc | 528563.42K | 24.87% |
| 2 | 9VAPor...2YYynQ | 312519.61K | 14.70% |
| 3 | DQiSLo...f5xeS9 | 250314.01K | 11.77% |
| 4 | FQEmsV...uW1M9f | 210000.01K | 9.88% |
| 5 | CSSJFg...V195Jb | 140000.01K | 6.58% |
| - | Others | 683600.15K | 32.2% |
II. Key Factors Affecting SAROS's Future Price
Supply Mechanism
- Buyback Plan: Future buyback plans will utilize up to 20% of quarterly revenue, aiming to reduce selling pressure and provide implicit price support.
- Current Impact: The buyback plan is expected to have a positive impact on SAROS price by reducing supply and increasing demand.
Technical Development and Ecosystem Building
- HyperRadiance: The release of HyperRadiance marked a significant milestone in the platform's development, introducing advanced features and enhancing overall user experience.
- SarosSwap: The launch of this DEX aggregator allows users to efficiently access and manage decentralized exchanges within the Solana ecosystem, establishing Saros as a key player in the DeFi space.
- SolanaPay Integration: The integration of SolanaPay and internal payment modules provides seamless and efficient transaction capabilities, demonstrating Saros's commitment to offering comprehensive financial services within the Solana ecosystem.
- NFT Hub: The native NFT store and minting capabilities, powered by advanced AI technology, position Saros as a significant player in the NFT space, attracting artists and collectors.
- Ecosystem Applications: Saros is used for receiving platform fees, participating in airdrops, and joining various gamified activities, making it an integral part of the Solana ecosystem.
III. SAROS Price Prediction for 2025-2030
2025 Outlook
- Conservative prediction: $0.21657 - $0.23540
- Neutral prediction: $0.23540 - $0.25188
- Optimistic prediction: $0.25188 - $0.26836 (requires favorable market conditions)
2026-2028 Outlook
- Market phase expectation: Gradual growth with potential volatility
- Price range forecast:
- 2026: $0.17128 - $0.31737
- 2027: $0.25331 - $0.33301
- 2028: $0.20691 - $0.41690
- Key catalysts: Increasing adoption, technological advancements, and overall crypto market trends
2029-2030 Long-term Outlook
- Base scenario: $0.31931 - $0.50074 (assuming steady market growth)
- Optimistic scenario: $0.50074 - $0.62179 (assuming strong bullish trends)
- Transformative scenario: Above $0.62179 (exceptional market conditions and widespread adoption)
- 2030-12-31: SAROS $0.43180 (potential average price based on projections)
| 年份 | 预测最高价 | 预测平均价格 | 预测最低价 | 涨跌幅 |
|---|---|---|---|---|
| 2025 | 0.26836 | 0.2354 | 0.21657 | 0 |
| 2026 | 0.31737 | 0.25188 | 0.17128 | 7 |
| 2027 | 0.33301 | 0.28462 | 0.25331 | 20 |
| 2028 | 0.4169 | 0.30882 | 0.20691 | 31 |
| 2029 | 0.50074 | 0.36286 | 0.31931 | 54 |
| 2030 | 0.62179 | 0.4318 | 0.3109 | 83 |
IV. SAROS Professional Investment Strategies and Risk Management
SAROS Investment Methodology
(1) Long-term Holding Strategy
- Suitable for: Long-term value investors and believers in Solana ecosystem
- Operation suggestions:
- Accumulate SAROS tokens during market dips
- Set price targets and review holdings periodically
- Store tokens in a secure wallet with backup
(2) Active Trading Strategy
- Technical analysis tools:
- Moving Averages: Use to identify trends and potential reversals
- RSI (Relative Strength Index): Monitor overbought/oversold conditions
- Key points for swing trading:
- Monitor Solana ecosystem developments closely
- Set stop-loss orders to manage downside risk
SAROS Risk Management Framework
(1) Asset Allocation Principles
- Conservative investors: 1-3% of crypto portfolio
- Aggressive investors: 5-10% of crypto portfolio
- Professional investors: Up to 15% of crypto portfolio
(2) Risk Hedging Solutions
- Diversification: Spread investments across different Solana projects
- Use of stablecoins: Convert a portion to stablecoins during high volatility
(3) Secure Storage Solutions
- Hot wallet recommendation: Gate Web3 Wallet
- Cold storage solution: Hardware wallet for large holdings
- Security precautions: Enable two-factor authentication, use strong passwords
V. Potential Risks and Challenges for SAROS
SAROS Market Risks
- High volatility: Crypto market fluctuations can lead to significant price swings
- Competition: Other Solana-based projects may gain market share
- Market sentiment: Negative news in the Solana ecosystem could impact SAROS
SAROS Regulatory Risks
- Uncertain regulations: Potential changes in crypto regulations globally
- Compliance challenges: Adapting to evolving regulatory requirements
- Cross-border restrictions: Possible limitations on international transactions
SAROS Technical Risks
- Smart contract vulnerabilities: Potential bugs or exploits in the protocol
- Scalability issues: Challenges in handling increased user adoption
- Dependency on Solana: Technical issues on Solana could affect SAROS
VI. Conclusion and Action Recommendations
SAROS Investment Value Assessment
SAROS shows potential as a comprehensive Web3 application on Solana, but faces significant competition and market volatility. Long-term value proposition is tied to Solana's growth and SAROS's ability to deliver on its roadmap.
SAROS Investment Recommendations
✅ Beginners: Start with small positions, focus on learning about the Solana ecosystem ✅ Experienced investors: Consider SAROS as part of a diversified Solana portfolio ✅ Institutional investors: Conduct thorough due diligence and consider OTC options for large positions
SAROS Trading Participation Methods
- Spot trading: Buy and sell SAROS on Gate.com
- Staking: Participate in staking programs if available
- DeFi integration: Explore liquidity provision or yield farming opportunities within the Saros ecosystem
Cryptocurrency investments carry extremely high risks, and this article does not constitute investment advice. Investors should make decisions carefully based on their own risk tolerance and are advised to consult professional financial advisors. Never invest more than you can afford to lose.
FAQ
What will XRP be in 2030 price prediction?
Analysts predict XRP could range between $4.67 and $26.97 in 2030, depending on adoption and regulatory factors. Strong institutional adoption and favorable market conditions are needed for higher prices.
What is a realistic price prediction for shiba inu in 2050?
Based on current trends, Shiba Inu's price in 2050 is projected to range between $0.00361 and $0.02020.
What is the price prediction for Tezos 2025?
Tezos is expected to reach $0.9209 to $1.66 in 2025, based on current market trends and analyst forecasts.
What crypto has the highest price prediction?
Bitcoin is predicted to have the highest price in 2026, potentially reaching several trillion dollars in market cap due to mass adoption and current trends.
Share
Content