2025 SCA Price Prediction: Expert Analysis and Market Forecast for Siacoin in the Coming Year
Introduction: Market Position and Investment Value of SCA
Scallop (SCA) stands as a pioneering next-generation peer-to-peer money market protocol within the Sui ecosystem, having established itself as the first DeFi protocol to receive an official grant from the Sui Foundation. Since its inception in March 2023, Scallop has demonstrated significant institutional-grade quality and robust security architecture. As of December 2025, SCA maintains a market capitalization of approximately $4.68 million with a circulating supply of around 106.4 million tokens, currently trading at $0.044. This innovative asset, characterized as an "institutional-grade DeFi protocol," is playing an increasingly critical role in reshaping the Sui ecosystem through its unified platform offering high-interest lending, low-fee borrowing, automated market making (AMM), and programmable transaction tools for professional traders.
This article will provide a comprehensive analysis of SCA's price trajectory through 2030, integrating historical performance patterns, market supply dynamics, ecosystem development milestones, and macroeconomic considerations to deliver professional price forecasts and practical investment strategies for investors.
Scallop (SCA) Market Analysis Report
I. SCA Price History Review and Market Status
SCA Historical Price Trajectory
- March 2024: Scallop reached its all-time high of $1.5477 on March 9, 2024, marking the peak of its price performance since launch.
- 2024-2025: Extended bear market phase, with SCA experiencing significant depreciation as market conditions deteriorated.
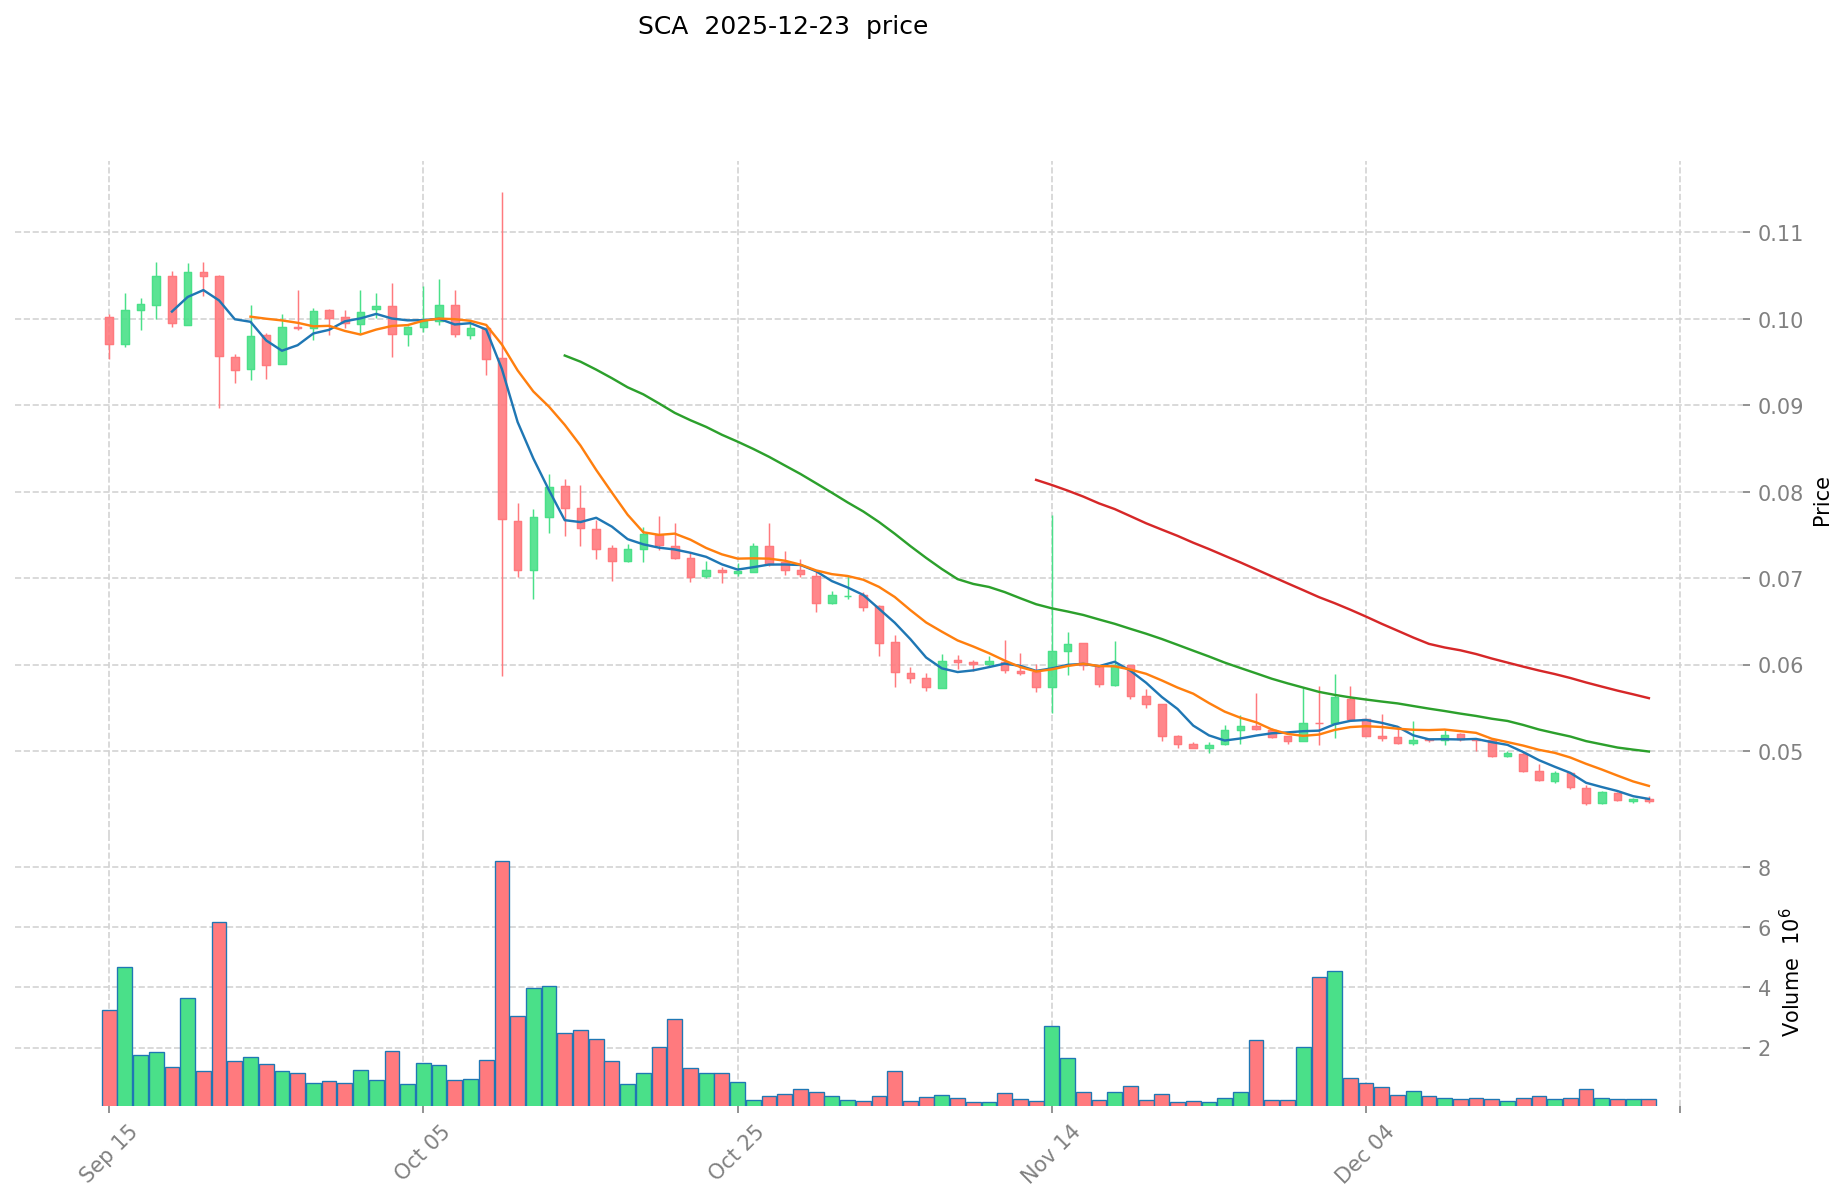
- December 2025: SCA reached its all-time low of $0.04371 on December 18, 2025, representing an 84.26% decline over the past year.
SCA Current Market Status
As of December 23, 2025, Scallop (SCA) is trading at $0.044, reflecting a slight positive movement of +0.09% in the last hour. However, the token demonstrates weakness over longer timeframes, with a 24-hour decline of -0.76% and a 7-day loss of -7.33%.
Key Market Metrics:
- 24-Hour Price Range: $0.04392 - $0.04446
- Trading Volume (24H): $12,492.88
- Market Capitalization: $4,681,713.08
- Fully Diluted Valuation: $11,000,000
- Circulating Supply: 106,402,570 SCA (42.56% of total supply)
- Total Supply: 250,000,000 SCA
- Token Holders: 6,705
- Market Rank: #1567
The token is currently listed on 17 exchanges and demonstrates significant long-term depreciation, with a 1-year decline of -84.26%. The 30-day performance shows a -13.38% loss, indicating continued downward pressure. Current market sentiment reflects extreme fear conditions, with limited trading activity relative to the token's market cap.
Click to view current SCA market price
SCA Market Sentiment Index
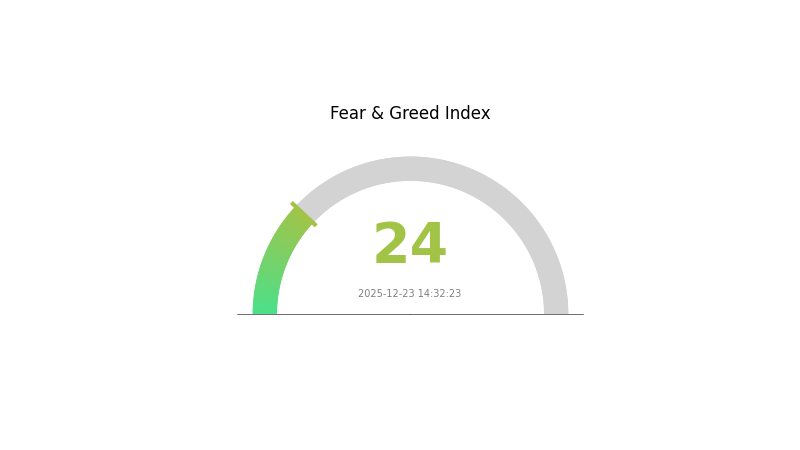
2025-12-23 Fear and Greed Index: 24 (Extreme Fear)
Click to view the current Fear & Greed Index
The crypto market is experiencing extreme fear with an index reading of 24. This significant downturn reflects widespread investor anxiety and pessimism across digital assets. During periods of extreme fear, risk-averse investors typically reduce exposure, while contrarian traders may see potential opportunities in oversold conditions. Market volatility remains elevated as sentiment continues to deteriorate. Monitoring this indicator on Gate.com can help traders gauge overall market psychology and make informed decisions about their portfolio positioning during this bearish phase.
SCA Holdings Distribution
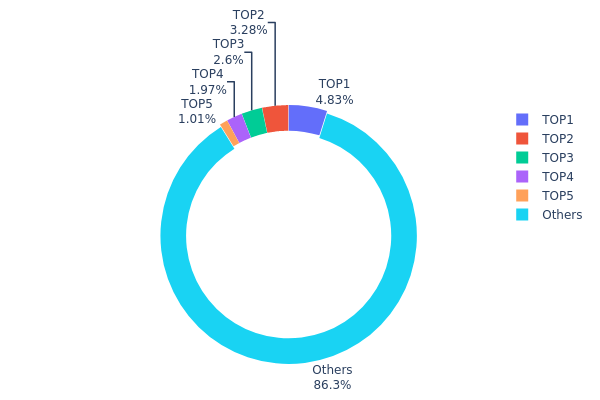
The address holdings distribution chart illustrates the concentration of token ownership across the blockchain network by tracking the proportion of total supply held by individual addresses. This metric serves as a critical indicator of decentralization, market structure vulnerability, and potential manipulation risks within the ecosystem.
Current analysis of SCA's top holder distribution reveals a relatively healthy decentralization profile. The top five addresses collectively account for only 13.69% of total supply, with the leading holder controlling 4.83%. This distribution pattern demonstrates notable resistance to extreme concentration, as no single entity commands a dominant market position. The remaining 86.31% dispersed across other addresses indicates a broad-based holder base, suggesting that decision-making power and price discovery mechanisms remain distributed across numerous participants rather than concentrated in the hands of a few whale holders.
This decentralized structure significantly mitigates risks associated with coordinated market manipulation or sudden liquidation events that could trigger sharp price volatility. The relatively modest holdings of top addresses implies that individual stakeholders lack sufficient capital concentration to single-handedly influence market direction, thereby supporting more organic and resilient price dynamics. The token's distribution architecture reflects a mature market structure characterized by institutional and retail participation diversity, contributing to enhanced market stability and reduced systemic risk exposure.
To view current SCA holdings distribution, click here.
| Top | Address | Holding Qty | Holding (%) |
|---|---|---|---|
| 1 | 0x60dd...b0984d | 12082.51K | 4.83% |
| 2 | 0x62f3...fa53ad | 8212.04K | 3.28% |
| 3 | 0xa7be...d0de0b | 6500.00K | 2.60% |
| 4 | 0x4558...3b2baa | 4937.40K | 1.97% |
| 5 | 0x9995...90d25d | 2529.13K | 1.01% |
| - | Others | 215738.92K | 86.31% |
Core Factors Influencing SCA's Future Price
Macroeconomic Environment
-
Inflation Hedge Characteristics: As a cryptocurrency asset, SCA possesses inherent properties that may serve as a hedge against inflation in certain economic environments. The asset's performance in inflationary contexts remains an important consideration for investors evaluating long-term value retention.
-
Global Economic Dynamics: The broader macroeconomic landscape, including currency policies and international economic trends, influences cryptocurrency market sentiment and capital allocation decisions that directly impact SCA's price trajectory.
Institutional and Market Dynamics
-
Institutional Capital Inflows: Institutional participation represents a key price driver for SCA. The attraction of institutional-grade funding and capital flows is expected to significantly influence price movements, particularly during market expansion phases.
-
Market Sentiment and Trends: Overall market trends and investor sentiment play crucial roles in determining SCA's price direction. The convergence of multiple market participants' strategies and expectations creates momentum that affects valuation levels.
Growth Stage Development
- Primary Drivers (2027 Medium-term Forecast): According to market analysis, SCA is anticipated to enter a growth stage by 2027, with projected price ranges of $0.0302 to $0.0670. The primary catalysts driving this growth phase include institutional fund inflows, ETF product developments, and ecosystem expansion initiatives.
Note: This analysis is based on available market data as of December 23, 2025. Investors should conduct additional research and consult with financial advisors before making investment decisions. Information can be accessed through Gate.com for cryptocurrency trading and analysis tools.
III. 2025-2030 SCA Price Forecast
2025 Outlook
- Conservative Forecast: $0.03876 - $0.04405
- Neutral Forecast: $0.04405 - $0.0533
- Optimistic Forecast: $0.0533 (requires sustained market momentum and positive ecosystem developments)
2026-2028 Medium-term Outlook
- Market Stage Expectation: SCA is anticipated to enter a gradual appreciation phase with increasing market recognition and adoption, characterized by incremental price discovery and volatility consolidation.
- Price Range Forecast:
- 2026: $0.02677 - $0.0662
- 2027: $0.04652 - $0.06892
- 2028: $0.05939 - $0.07013
- Key Catalysts: Enhanced protocol functionality, expanding strategic partnerships, growing institutional interest in the asset class, and broader market recovery cycles.
2029-2030 Long-term Outlook
- Base Case: $0.04199 - $0.08665 (assumes moderate adoption acceleration and stable macroeconomic conditions)
- Optimistic Case: $0.06666 - $0.08665 (assumes significant ecosystem expansion and positive regulatory environment)
- Transformation Case: $0.07665 - $0.08049 (assumes breakthrough technological innovations and mainstream institutional adoption)
- 2030-12-23: SCA projected at $0.08049 average price (representing 74% upside potential from current baseline)
| 年份 | 预测最高价 | 预测平均价格 | 预测最低价 | 涨跌幅 |
|---|---|---|---|---|
| 2025 | 0.0533 | 0.04405 | 0.03876 | 0 |
| 2026 | 0.0662 | 0.04868 | 0.02677 | 10 |
| 2027 | 0.06892 | 0.05744 | 0.04652 | 30 |
| 2028 | 0.07013 | 0.06318 | 0.05939 | 43 |
| 2029 | 0.08665 | 0.06666 | 0.04199 | 51 |
| 2030 | 0.08049 | 0.07665 | 0.03986 | 74 |
Scallop (SCA) Professional Investment Strategy and Risk Management Report
IV. SCA Professional Investment Strategy and Risk Management
SCA Investment Methodology
(1) Long-Term Holding Strategy
- Target Audience: DeFi protocol believers and Sui ecosystem supporters with medium to long-term investment horizons
- Operational Recommendations:
- Accumulate SCA during price dips below $0.045, leveraging the protocol's institutional-grade infrastructure and official Sui Foundation grant status
- Hold through market cycles, recognizing Scallop's positioning as a pioneering next-generation peer-to-peer money market in the Sui ecosystem
- Participate in protocol governance and liquidity provision to earn additional yields beyond token appreciation
(2) Active Trading Strategy
- Market Technical Indicators:
- 24-hour volatility analysis: Monitor the current price range ($0.04392-$0.04446) for breakout opportunities
- 7-day trend assessment: Current -7.33% decline presents potential entry points for swing traders
- Wave Trading Key Points:
- Establish positions when price approaches the all-time low of $0.04371 with strong volume confirmation
- Take partial profits near resistance levels, with historical all-time high of $1.5477 providing a long-term target reference
SCA Risk Management Framework
(1) Asset Allocation Principles
- Conservative Investors: 1-2% portfolio allocation (suitable for low-risk tolerance investors)
- Active Investors: 3-5% portfolio allocation (appropriate for moderate risk tolerance with DeFi conviction)
- Professional Investors: 5-10% portfolio allocation (for those with deep Sui ecosystem analysis and risk management capabilities)
(2) Risk Hedging Solutions
- Liquidity Risk Management: Maintain diversified positions across multiple SCA trading pairs and avoid concentrating holdings during low liquidity periods
- Volatility Protection: Use dollar-cost averaging strategies during extreme price movements to reduce timing risk
(3) Secure Storage Solutions
- Custody Solution: Gate.com Web3 Wallet for secure self-custody with institutional-grade security standards
- Cold Storage Option: For large holdings, consider hardware-level security through professional custody providers
- Security Precautions: Never share private keys, enable multi-factor authentication, verify contract addresses before transactions (SCA contract: 0x7016aae72cfc67f2fadf55769c0a7dd54291a583b63051a5ed71081cce836ac6::sca::SCA on SUI chain)
V. SCA Potential Risks and Challenges
SCA Market Risks
- Price Volatility Risk: SCA has experienced an 84.26% decline over one year, reflecting significant volatility inherent in early-stage DeFi protocols
- Liquidity Risk: Current 24-hour trading volume of $12,492.88 is relatively modest, potentially limiting large position exits without slippage
- Market Adoption Risk: Success depends on Sui ecosystem growth and user adoption of Scallop's money market infrastructure
SCA Regulatory Risks
- DeFi Regulatory Uncertainty: Ongoing global regulatory developments regarding decentralized finance protocols may impact operational parameters
- Jurisdictional Compliance: Changes in crypto regulatory frameworks across major markets could affect user base and trading volumes
- Institutional Adoption Barriers: Regulatory constraints on institutional participation could slow the realization of Scallop's institutional-grade positioning
SCA Technology Risks
- Smart Contract Vulnerabilities: Despite institutional-grade quality emphasis, all smart contracts carry inherent security risks requiring continuous auditing
- Sui Blockchain Dependency: Scallop's performance is directly tied to Sui network stability, scalability, and adoption trajectory
- Composability Complexity: Enhanced composability features, while beneficial, may introduce unforeseen interaction risks in complex market scenarios
VI. Conclusion and Action Recommendations
SCA Investment Value Assessment
Scallop represents a promising infrastructure play within the Sui ecosystem, backed by official Sui Foundation support and designed with institutional-grade standards. The protocol's emphasis on composability and programmability positions it to capture value from Sui's growth. However, investors must acknowledge the protocol's early stage, current market cap of $4.68M with only 42.56% circulating supply, and the challenging market environment reflected in -84.26% annual decline. The protocol's long-term value depends heavily on Sui ecosystem adoption and competitive positioning against other money market protocols.
SCA Investment Recommendations
✅ Beginners: Start with small allocations (0.5-1% of portfolio) through Gate.com, focusing on understanding the Sui ecosystem and Scallop's role before scaling positions
✅ Experienced Investors: Consider 3-5% allocation with active participation in governance and yield strategies, using technical indicators to optimize entry points during volatility
✅ Institutional Investors: Evaluate 5-10% strategic allocation coupled with direct engagement with the protocol team, potential SDK integration for professional trading operations, and comprehensive risk assessment of Sui ecosystem exposure
SCA Trading Participation Methods
- Spot Trading: Purchase SCA directly on Gate.com during market dips for long-term accumulation
- Yield Strategies: Deposit SCA into Scallop's money market for lending yields or provide liquidity for AMM fees
- Protocol Participation: Engage with governance mechanisms and platform features to generate returns beyond token appreciation
Cryptocurrency investment carries extreme risk. This report does not constitute investment advice. Investors should make decisions based on personal risk tolerance and consult professional financial advisors. Never invest more than you can afford to lose.
FAQ
What is sca crypto?
SCA (Scallop) is a blockchain-based cryptocurrency powering the Scallop ecosystem. It bridges traditional finance with decentralized finance (DeFi), addressing challenges like slow payments and high fees. SCA enables secure and efficient financial services through blockchain technology.
How high can SiaCoin go?
SiaCoin could reach a maximum of $0.0118 in 2025 and potentially $0.0449 by 2030, based on current market trends and technical analysis projections.
What factors influence SCA/SiaCoin price movements?
SiaCoin price movements are driven by market sentiment, trading volume, network adoption, regulatory changes, and Bitcoin correlation. Supply and demand dynamics also play significant roles in price fluctuations.
Is SiaCoin a good investment for 2024?
SiaCoin shows strong potential as a 2024 investment. With growing decentralized storage demand and solid blockchain fundamentals, SC offers promising returns. Market momentum and ecosystem development suggest positive price trajectory ahead.
What is the historical price performance of SCA?
SCA reached an all-time high of $1.49 on March 9, 2024. As of December 23, 2025, it trades between $0.04297 and $0.0447 in the last 24 hours, representing a 97.06% decline from its peak.
Share
Content
Introduction: Market Position and Investment Value of SCA
I. SCA Price History Review and Market Status
Core Factors Influencing SCA's Future Price
III. 2025-2030 SCA Price Forecast
IV. SCA Professional Investment Strategy and Risk Management
V. SCA Potential Risks and Challenges
VI. Conclusion and Action Recommendations
FAQ
How to Buy Cryptocurrency


Trending Cryptocurrencies


VINU vs STX: Comparing Two Emerging Cryptocurrencies in the Digital Asset Ecosystem

RVN vs AAVE: Which Crypto Asset Offers Better Long-Term Growth Potential?

CLORE vs RUNE: The Battle for Dominance in the Emerging Crypto Asset Management Space
Is Aerodrome Finance (AERO) a good investment?: Analyzing the potential of this DeFi protocol in the volatile crypto market

SDEX vs CRO: Comparing Two Leading Cryptocurrency Exchange Platforms

Is Hyperion (RION) a good investment?: Analyzing the potential and risks of this emerging cryptocurrency
What Are Bitcoin Runes?

How to Read Technical Indicators for PAXG Trading: MACD, RSI, and Moving Average Analysis

Will Pi Network Be Listed on Mainstream Exchanges?
How will MACD, RSI, and Bollinger Bands predict HYPE's next price move?
How to Find Your EVM Address