2025 SPrice Prediction: Analyzing Future Market Trends and Investment Opportunities


Introduction: S's Market Position and Investment Value
Sonic (S), as an EVM L1 platform offering attractive incentives and powerful infrastructure for DeFi, has achieved significant milestones since its inception. As of 2025, Sonic's market capitalization has reached $867,456,000, with a circulating supply of approximately 2,880,000,000 tokens, and a price hovering around $0.3012. This asset, known as a "DeFi powerhouse," is playing an increasingly crucial role in decentralized finance and blockchain infrastructure.
This article will provide a comprehensive analysis of Sonic's price trends from 2025 to 2030, considering historical patterns, market supply and demand, ecosystem development, and macroeconomic factors to offer professional price predictions and practical investment strategies for investors.
I. S Price History Review and Current Market Status
S Historical Price Evolution
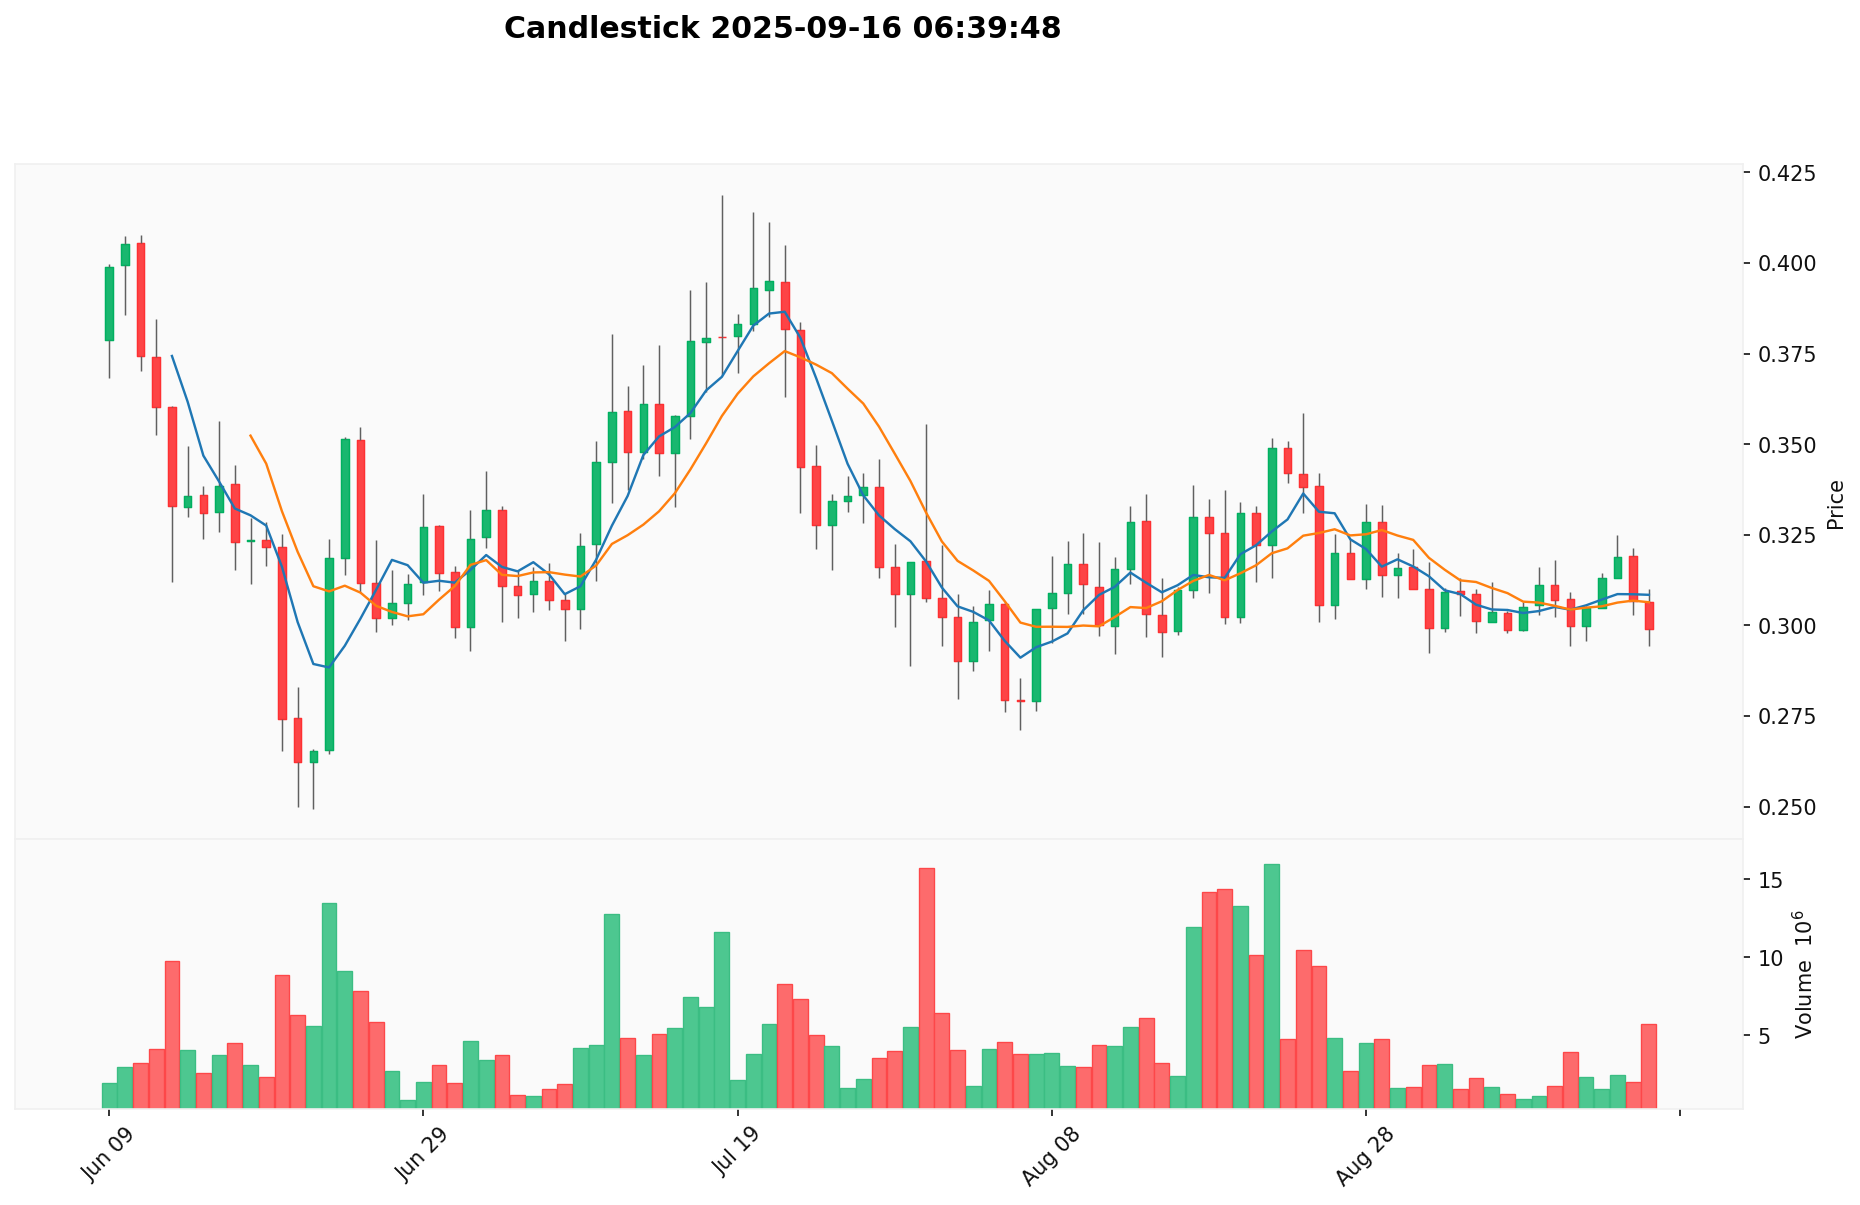
- 2025 (January): Sonic (S) reached its all-time high of $1.0293, marking a significant milestone for the project.
- 2025 (June): S experienced its all-time low of $0.2502, indicating a substantial market correction.
- 2025 (September): The price has stabilized around $0.3012, showing signs of recovery from the recent low.
S Current Market Situation
As of September 16, 2025, Sonic (S) is trading at $0.3012, with a market capitalization of $867,456,000. The token has experienced a 2.49% decrease in the last 24 hours, reflecting short-term market volatility. Over the past week, S has seen a 3.84% decline, while the 30-day performance shows a more significant drop of 7.82%. The long-term trend indicates a substantial decrease of 40.63% over the past year.
The current price represents a 70.74% decline from its all-time high and a 20.40% increase from its all-time low, suggesting that the token is in a consolidation phase. With a circulating supply of 2,880,000,000 S tokens and a total supply of 3,222,625,000, the market cap to fully diluted valuation ratio stands at 74.04%, indicating a relatively high proportion of tokens in circulation.
Trading volume in the last 24 hours amounts to $1,655,637, which is modest compared to its market capitalization. This level of trading activity suggests moderate liquidity and investor interest in the current market conditions.
Click to view the current S market price
S Market Sentiment Indicator
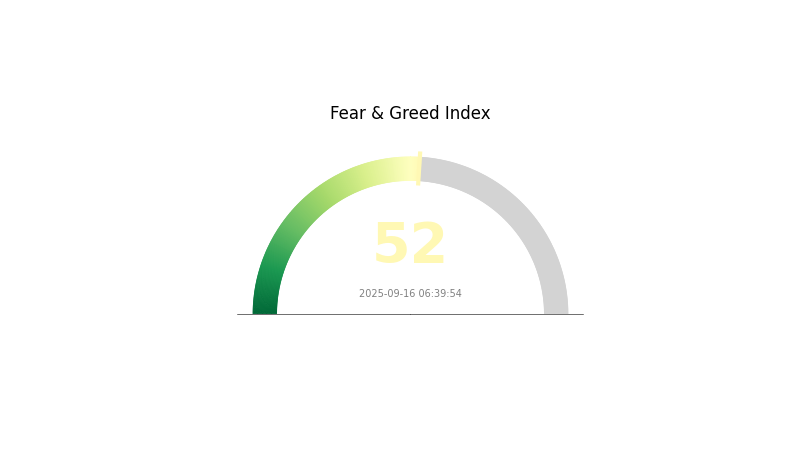
2025-09-16 Fear and Greed Index: 52 (Neutral)
Click to view the current Fear & Greed Index
The cryptocurrency market sentiment remains neutral today, with the Fear and Greed Index standing at 52. This balanced state suggests that investors are neither overly fearful nor excessively greedy. Such equilibrium often indicates a period of market stability, where buying and selling pressures are relatively even. Traders on Gate.com and other platforms may find this an opportune time to reassess their strategies, as the market lacks a clear directional bias. Remember, while the sentiment is neutral, market conditions can change rapidly, so stay informed and trade responsibly.
S Holdings Distribution
The address holdings distribution chart provides valuable insights into the concentration of S tokens across different addresses. Based on the provided data, it appears that the current distribution of S is relatively decentralized, with no single address holding a disproportionately large percentage of the total supply.
This distribution pattern suggests a healthy market structure for S, with a reduced risk of price manipulation by large holders. The absence of extreme concentration in any single address indicates a more diverse ownership base, which can contribute to improved liquidity and reduced volatility in the market. Furthermore, this distribution aligns with the principles of decentralization, potentially enhancing the overall stability and resilience of the S ecosystem.
Overall, the current address distribution of S reflects a positive market characteristic, indicating a well-distributed token supply that may support long-term sustainability and reduce the risk of sudden, large-scale sell-offs that could negatively impact price stability.
Click to view the current S holdings distribution

| Top | Address | Holding Qty | Holding (%) |
|---|
II. Key Factors Influencing S's Future Price
Supply Mechanism
- Historical Pattern: Past supply changes have directly impacted price fluctuations
- Current Impact: The structural shortage due to supply-demand imbalance may persist until the next halving in 2028
Institutional and Whale Dynamics
- Institutional Holdings: Institutional investors continue to hold S, influencing market structure
- Corporate Adoption: MicroStrategy has increased its holdings, now owning 632,457 S tokens, representing 3.2% of the circulating supply
- Government Policies: The new SEC chairman has shown a more lenient attitude towards cryptocurrencies
Macroeconomic Environment
- Monetary Policy Impact: Central bank policy expectations are a key factor
- Inflation Hedging Properties: S has shown potential as an inflation hedge in the current economic environment
- Geopolitical Factors: International situations, such as the re-election of Trump, have influenced market sentiment
Technical Development and Ecosystem Building
- BitVM: This technical upgrade is expected to support price growth
- Ecosystem Applications: The development of enterprise-level S custody solutions is underway, with plans to serve S&P 500 companies by 2026
III. S Price Prediction for 2025-2030
2025 Outlook
- Conservative forecast: $0.201 - $0.300
- Neutral forecast: $0.300 - $0.350
- Optimistic forecast: $0.350 - $0.411 (requires favorable market conditions)
2027-2028 Outlook
- Market phase expectation: Potential growth phase
- Price range prediction:
- 2027: $0.217 - $0.426
- 2028: $0.234 - $0.607
- Key catalysts: Increased adoption and technological advancements
2030 Long-term Outlook
- Base scenario: $0.544 - $0.600 (assuming steady market growth)
- Optimistic scenario: $0.600 - $0.762 (assuming strong market performance)
- Transformative scenario: $0.762+ (assuming breakthrough developments)
- 2030-12-31: S $0.76231 (potential peak price)
| 年份 | 预测最高价 | 预测平均价格 | 预测最低价 | 涨跌幅 |
|---|---|---|---|---|
| 2025 | 0.411 | 0.3 | 0.201 | 0 |
| 2026 | 0.43371 | 0.3555 | 0.30929 | 18 |
| 2027 | 0.42617 | 0.39461 | 0.21703 | 31 |
| 2028 | 0.60738 | 0.41039 | 0.23392 | 36 |
| 2029 | 0.58013 | 0.50888 | 0.3206 | 68 |
| 2030 | 0.76231 | 0.5445 | 0.30492 | 80 |
IV. Professional Investment Strategies and Risk Management for S
S Investment Methodology
(1) Long-term Holding Strategy
- Suitable for: Risk-tolerant investors with a long-term outlook
- Operation suggestions:
- Accumulate S tokens during market dips
- Set price targets and stick to your investment plan
- Store tokens securely in a non-custodial wallet
(2) Active Trading Strategy
- Technical analysis tools:
- Moving Averages: Use to identify trends and potential reversals
- Relative Strength Index (RSI): Monitor overbought/oversold conditions
- Key points for swing trading:
- Monitor S token's correlation with broader crypto market trends
- Set stop-loss orders to manage downside risk
S Risk Management Framework
(1) Asset Allocation Principles
- Conservative investors: 1-3% of crypto portfolio
- Aggressive investors: 5-10% of crypto portfolio
- Professional investors: Up to 15% of crypto portfolio
(2) Risk Hedging Solutions
- Diversification: Spread investments across multiple L1 platforms
- Stop-loss orders: Implement to limit potential losses
(3) Secure Storage Solutions
- Hot wallet recommendation: Gate Web3 Wallet
- Cold storage solution: Hardware wallet for long-term holdings
- Security precautions: Enable 2FA, use unique passwords, and regularly update software
V. Potential Risks and Challenges for S
S Market Risks
- Volatility: High price fluctuations common in crypto markets
- Competition: Emerging L1 platforms may challenge Sonic's market position
- Liquidity: Potential issues during extreme market conditions
S Regulatory Risks
- Uncertain regulations: Evolving global crypto regulations may impact S
- Compliance challenges: Potential difficulties in meeting new regulatory requirements
- Cross-border restrictions: Possible limitations on S token's use in certain jurisdictions
S Technical Risks
- Smart contract vulnerabilities: Potential for exploits or bugs in the protocol
- Network congestion: Possible scalability issues during high-demand periods
- Interoperability challenges: Risks associated with cross-chain bridges and gateways
VI. Conclusion and Action Recommendations
S Investment Value Assessment
Sonic (S) presents a compelling long-term value proposition as an EVM-compatible L1 platform with high TPS and sub-second finality. However, short-term risks include market volatility and fierce competition in the L1 space.
S Investment Recommendations
✅ Beginners: Consider small, regular investments to build a position over time
✅ Experienced investors: Implement a balanced approach with both long-term holdings and active trading
✅ Institutional investors: Evaluate S as part of a diversified L1 platform portfolio
S Trading Participation Methods
- Spot trading: Available on Gate.com and other major exchanges
- DeFi participation: Explore liquidity provision and yield farming opportunities on Sonic's ecosystem
- Staking: Participate in network security and earn rewards through staking mechanisms
Cryptocurrency investments carry extremely high risks, and this article does not constitute investment advice. Investors should make decisions carefully based on their own risk tolerance and are advised to consult professional financial advisors. Never invest more than you can afford to lose.
FAQ
What is the target price for S stock in 2025?
The average target price for S stock in 2025 is $24.26, with the highest target at $32.00, based on analyst forecasts.
Can Sonic reach $10?
Sonic is unlikely to reach $10 in the near future. It would require a massive 3,249% increase, which current market trends and predictions do not support.
Is S stock a good stock to buy?
Based on analyst recommendations and a Zacks Rank #2 (Buy), S stock appears to be a good buy. The company shows potential for growth in the cybersecurity sector, making it an attractive investment option.
Will Sonic coin reach $1?
Based on current market trends, it's highly unlikely for Sonic coin to reach $1. It would require an astronomical 1,953,940% price increase, which is not realistically achievable in the foreseeable future.
Share
Content
Introduction: S's Market Position and Investment Value
I. S Price History Review and Current Market Status
II. Key Factors Influencing S's Future Price
III. S Price Prediction for 2025-2030
IV. Professional Investment Strategies and Risk Management for S
V. Potential Risks and Challenges for S
VI. Conclusion and Action Recommendations
FAQ
How to Buy Cryptocurrency


Trending Cryptocurrencies


How Does Sui's On-Chain Data Analysis Reveal Its Growth in 2025?

How Does On-Chain Data Analysis Reveal Sui's Performance in 2025?

2025 CLEAR Price Prediction: Analyzing Market Trends and Potential Growth Factors for the Digital Asset

How Does On-Chain Data Analysis Reveal Aster's Whale Activity in 2025?

H vs APT: Unraveling the Complex Battle Between Human Intelligence and Advanced Persistent Threats

How Will AVAX's On-Chain Data Predict Its Price in 2030?

槓桿
How Does AVAX Exchange Inflow and Outflow Affect Institutional Holdings and Token Lock Value in 2025

What is Rebus?
Crypto Market Sees Major Whale Moves in BTC and ETH
What Is MON Protocol Price Volatility: Support Resistance Levels and 19% Daily Surge Analysis