2025 SWEAT Price Prediction: Expert Analysis and Market Forecast for the Coming Year

Introduction: SWEAT's Market Position and Investment Value
Sweat Economy (SWEAT) is a digital currency generated through physical activity on the Sweatcoin mobile fitness app, which was first launched in 2016. Since its inception, the project has aimed to reduce the global carbon footprint by encouraging physical activity to create a healthier and more active world. As of December 22, 2025, SWEAT has achieved a market capitalization of $10.53 million with a circulating supply of approximately 7.58 billion tokens, currently trading at $0.001388 per token. This innovative asset, often referred to as "move-to-earn currency," is increasingly playing a vital role in incentivizing physical wellness and blockchain-based fitness ecosystems.
This article will provide a comprehensive analysis of SWEAT's price trends and market dynamics through 2025, combined with historical patterns, market supply-demand fundamentals, ecosystem development, and macroeconomic factors to deliver professional price forecasts and practical investment strategies for crypto investors interested in fitness-linked digital assets.
I. SWEAT Price History Review and Market Status
SWEAT Historical Price Evolution
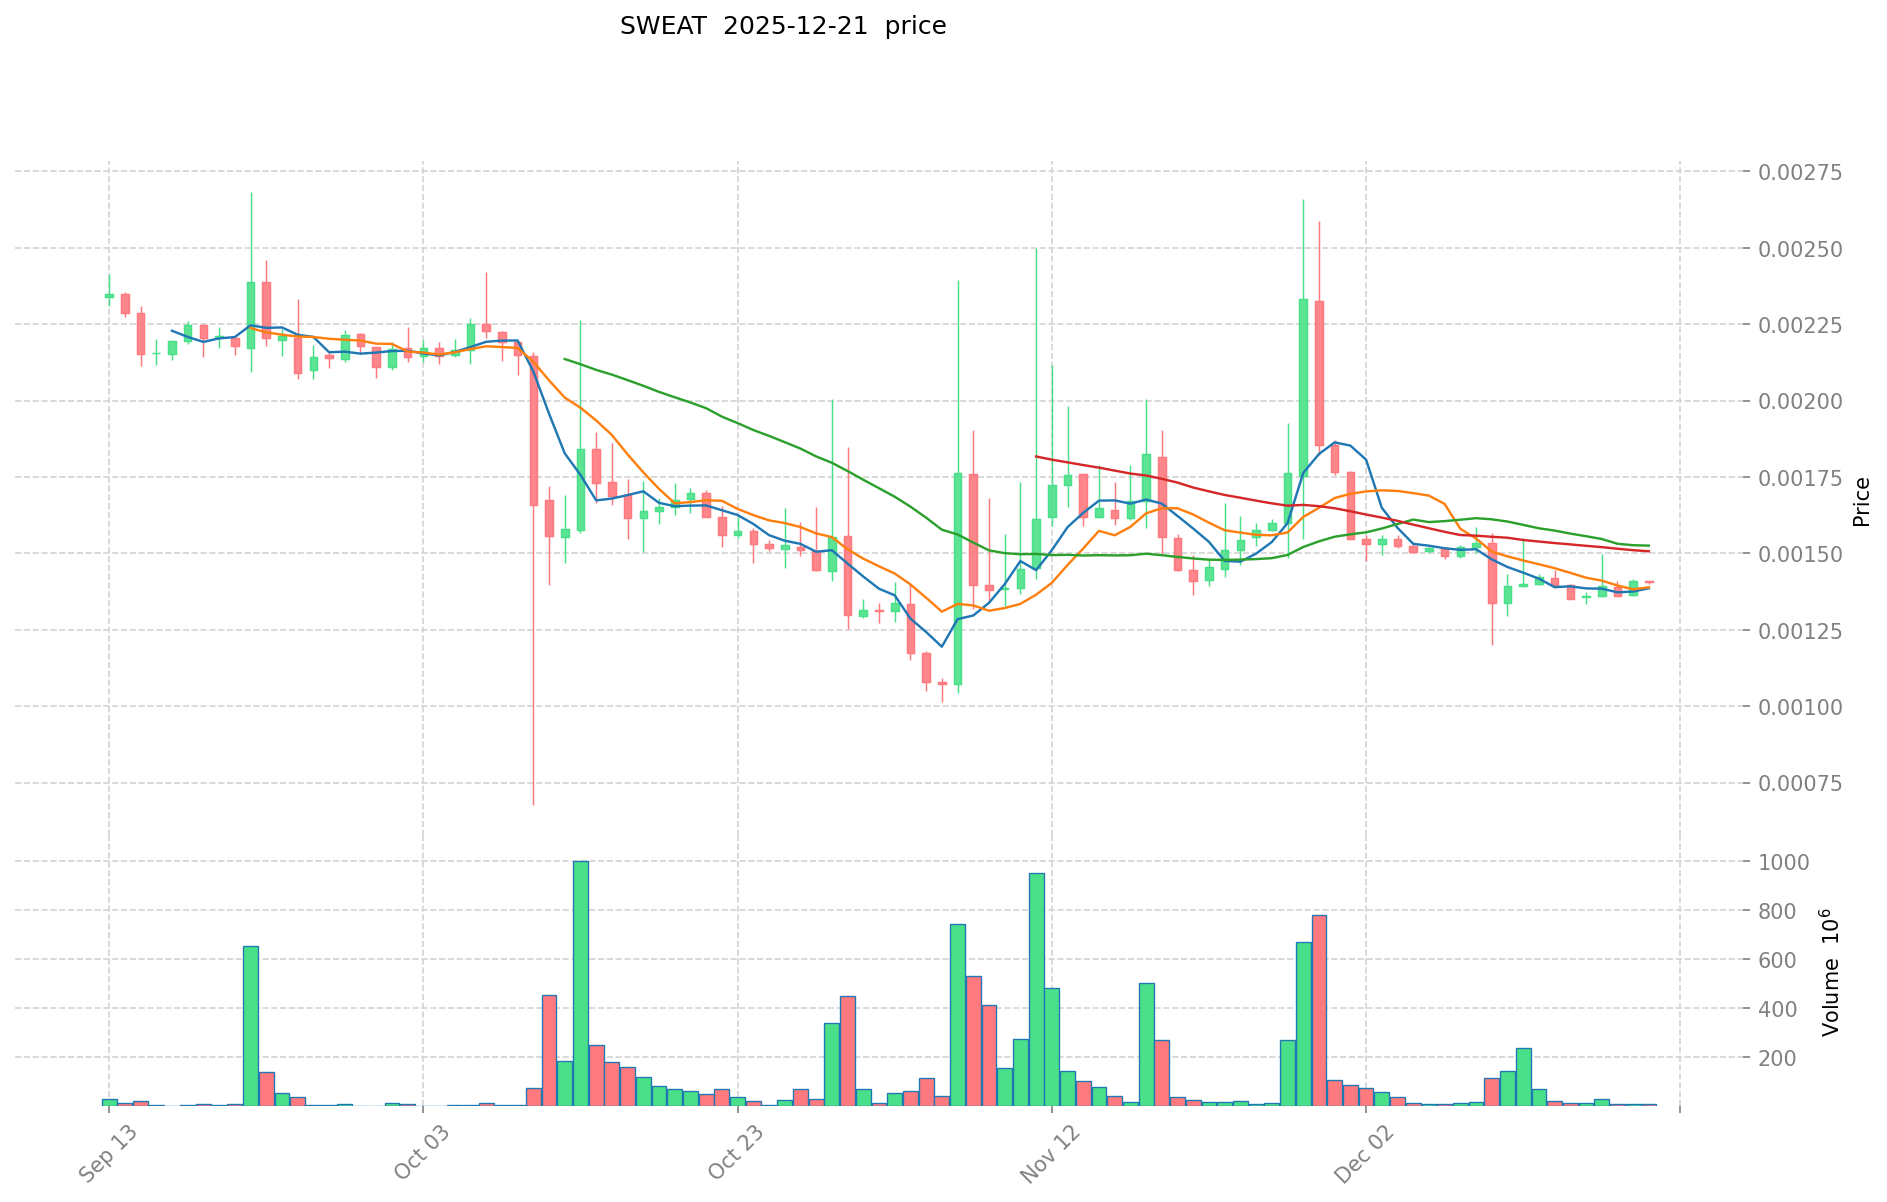
- September 2022: All-Time High reached at $0.091476, reflecting peak market enthusiasm during the project's early phase
- November 2025: All-Time Low recorded at $0.0010149, marking the bottom of the market cycle
- 2023-2025: Extended downtrend period, with price declining approximately 77.75% over the past year
SWEAT Current Market Status
As of December 22, 2025, SWEAT is trading at $0.001388, with a 24-hour trading volume of $19,615.35. The token has experienced a marginal decline of 1.35% in the last 24 hours, with intraday fluctuations ranging between $0.001387 and $0.001443.
The current market capitalization stands at $10,527,370.59, while the fully diluted valuation reaches $27,755,591.79. SWEAT maintains a circulating supply of 7,584,560,947.07 tokens out of a total supply of 19,996,824,055.57 tokens, with a maximum supply cap of 21,867,346,500.41 tokens. The circulating supply represents approximately 34.68% of the total maximum supply.
The token is ranked 1,141st by market capitalization, with a market dominance of 0.00086%. Currently trading on 13 exchanges, SWEAT is supported by a holder base of 5,283 addresses. Short-term price momentum shows weakness, with declines of 0.22% over the past hour, 0.79% over the past week, and 2.53% over the past month.
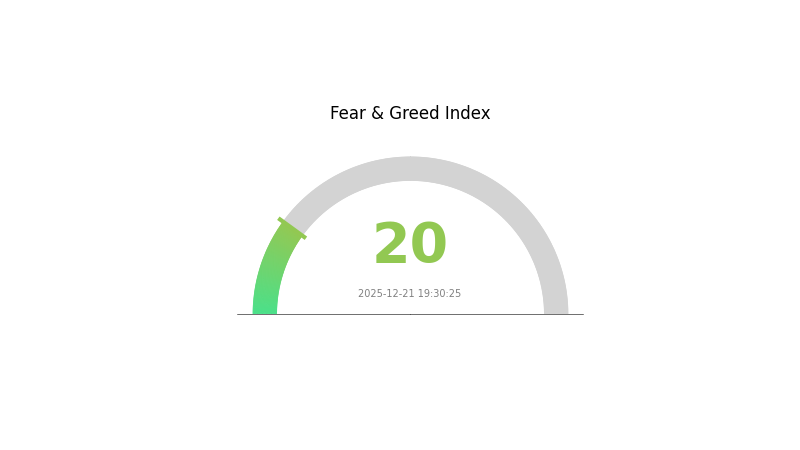
Market sentiment indicators suggest extreme fear conditions, with a Volatility Index reading of 20, reflecting heightened market uncertainty and risk aversion among traders.
Click to view current SWEAT market price
SWEAT Market Sentiment Index
2025-12-21 Fear and Greed Index: 20 (Extreme Fear)
Click to view current Fear & Greed Index
The crypto market is currently experiencing extreme fear, with the index at 20. This indicates significant market pessimism and panic among investors. During such periods, risk appetite is at its lowest, and market volatility tends to be elevated. Extreme fear often presents contrarian opportunities for long-term investors, as assets may be oversold. However, caution is advised, as further downside movements remain possible. Monitor market fundamentals closely and consider dollar-cost averaging strategies on Gate.com to manage risk effectively during this fearful market phase.
SWEAT Holdings Distribution
Address holdings distribution refers to the concentration of token supply across different wallet addresses on the blockchain. This metric provides critical insight into the decentralization level and potential market structure risks by revealing how SWEAT tokens are distributed among individual holders. By analyzing the top addresses and their respective holdings, we can assess the degree of token concentration and identify potential vulnerabilities to market manipulation or sudden price volatility.
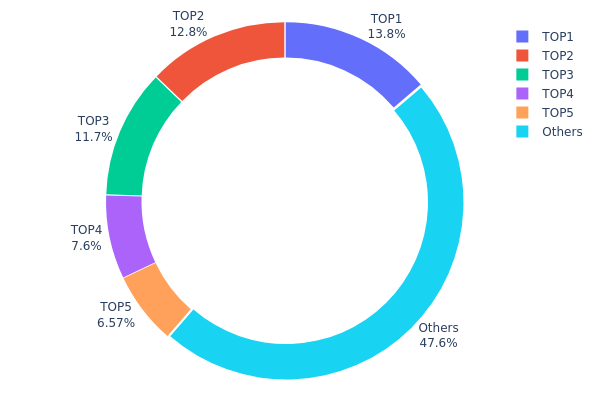
SWEAT currently exhibits moderate concentration characteristics in its holder distribution. The top five addresses collectively control approximately 52.4% of the total token supply, with the leading address holding 13.78% and the second-largest holder maintaining 12.80%. While no single entity commands an overwhelming majority, the cumulative holdings of the top three addresses represent 38.23% of all SWEAT tokens in circulation. This level of concentration, though not extreme, indicates that significant market influence remains concentrated among a limited number of stakeholders. The remaining 47.6% of tokens distributed across other addresses suggests a reasonably fragmented base, which provides some degree of resilience against manipulation by individual large holders.
The current distribution pattern carries meaningful implications for market dynamics and structural stability. With approximately half of the token supply held by top-tier addresses, the potential exists for coordinated price movements or liquidity pressure should these addresses execute large transactions simultaneously. However, the substantial portion held by dispersed addresses (47.6%) creates a counterbalancing force that could absorb or buffer against aggressive selling pressure from concentrated holders. This distribution reflects a token ecosystem that has achieved moderate decentralization, positioning SWEAT between highly centralized projects and those with extensively distributed supply structures.
Click to view current SWEAT holdings distribution
| Top | Address | Holding Qty | Holding (%) |
|---|---|---|---|
| 1 | 0x0639...70d206 | 164358.25K | 13.78% |
| 2 | 0xaae6...77a606 | 152703.68K | 12.80% |
| 3 | 0xf89d...5eaa40 | 139005.90K | 11.65% |
| 4 | 0x58ed...a36a51 | 90654.69K | 7.60% |
| 5 | 0x9138...4fb6eb | 78392.10K | 6.57% |
| - | Others | 567360.67K | 47.6% |
II. Core Factors Influencing SWEAT's Future Price
Supply Mechanism
- Token Burn Mechanism: Transaction fees include a certain percentage that is destroyed with each SWEAT transaction, creating deflationary pressure on the token supply.
- Total Supply Cap: The total circulating supply is maintained at 20 billion tokens, with increasingly difficult minting requirements that create positive price pressure over time.
- Current Impact: The deflationary mechanism through continuous token burning helps reduce available supply, potentially supporting price appreciation as demand remains consistent or increases.
Three、2025-2030 SWEAT Price Forecast
2025 Outlook
- Conservative Forecast: $0.00105 - $0.00139
- Neutral Forecast: $0.00139 - $0.00160
- Optimistic Forecast: $0.00180 (requires sustained adoption growth and positive market sentiment)
2026-2028 Medium-term Outlook
- Market Stage Expectation: Gradual recovery phase with incremental adoption expansion and ecosystem development maturation
- Price Range Forecast:
- 2026: $0.00081 - $0.00236
- 2027: $0.00162 - $0.00249
- 2028: $0.00195 - $0.00275
- Key Catalysts: Increased user base engagement, strategic partnerships expansion, enhanced tokenomic mechanisms, and broader health and fitness application integration
2029-2030 Long-term Outlook
- Base Case: $0.00150 - $0.00262 (assuming steady ecosystem growth and moderate market expansion)
- Optimistic Case: $0.00262 - $0.00381 (with accelerated mainstream adoption and successful platform scaling)
- Transformative Case: $0.00381+ (under extreme favorable conditions including major institutional participation and revolutionary fitness technology breakthroughs)
- 2030-12-31: SWEAT reaches $0.00381 as projected ceiling (reflecting robust ecosystem maturation and enhanced market positioning)
| 年份 | 预测最高价 | 预测平均价格 | 预测最低价 | 涨跌幅 |
|---|---|---|---|---|
| 2025 | 0.0018 | 0.00139 | 0.00105 | 0 |
| 2026 | 0.00236 | 0.0016 | 0.00081 | 15 |
| 2027 | 0.00249 | 0.00198 | 0.00162 | 42 |
| 2028 | 0.00275 | 0.00224 | 0.00195 | 61 |
| 2029 | 0.00262 | 0.00249 | 0.0015 | 79 |
| 2030 | 0.00381 | 0.00256 | 0.00207 | 84 |
SWEAT (Sweat Economy) Professional Investment Strategy and Risk Management Report
IV. SWEAT Professional Investment Strategy and Risk Management
SWEAT Investment Methodology
(1) Long-Term Holding Strategy
- Target Audience: Health-conscious individuals, fitness app users, and long-term believers in the move-to-earn ecosystem
- Operational Recommendations:
- Accumulate SWEAT through consistent Sweatcoin app usage by maintaining regular physical activity
- Hold SWEAT tokens for an extended period (12+ months) to benefit from potential ecosystem growth and staking rewards
- Reinvest staking rewards to compound returns over time
(2) Active Trading Strategy
-
Market Observation Points:
- Monitor 24-hour trading volume (currently 19,615.35 SWEAT) and price volatility patterns
- Track historical price levels: ATH of $0.091476 (September 14, 2022) and current support levels around $0.001388
-
Wave Trading Key Points:
- Identify resistance at recent 24-hour highs ($0.001443) and support at daily lows ($0.001387)
- Consider entry points during price dips after negative momentum phases, with exit targets based on 5-10% recovery patterns
- Pay attention to volume trends before making position adjustments
SWEAT Risk Management Framework
(1) Asset Allocation Principles
- Conservative Investors: 1-3% of total crypto portfolio allocation
- Active Investors: 3-5% of total crypto portfolio allocation
- Professional Investors: 5-8% of total crypto portfolio allocation (with hedging strategies)
(2) Risk Mitigation Strategies
- Portfolio Diversification: Limit SWEAT exposure to prevent concentration risk given the token's -77.75% annual decline
- Dollar-Cost Averaging (DCA): Execute purchases gradually rather than lump-sum investments to reduce timing risk
- Stop-Loss Implementation: Set stop-loss orders at 15-20% below entry points to limit downside exposure
(3) Secure Storage Solutions
- Exchange Storage: Use Gate.com for active trading and frequent transactions with built-in security features
- Personal Custody: Transfer SWEAT to personal wallet addresses for long-term holdings to maintain full control
- Security Best Practices: Enable two-factor authentication on all exchange accounts, use unique passwords, and never share private keys or recovery phrases with third parties
V. SWEAT Potential Risks and Challenges
SWEAT Market Risk
- Severe Price Depreciation: SWEAT has declined 77.75% over the past year, indicating significant loss of market confidence and investor interest
- Low Trading Volume: With only 19,615.35 units traded in 24 hours across 13 exchanges, liquidity is limited, making large trades difficult to execute without significant slippage
- Market Cap Concentration: The fully diluted market cap ($27.76 million) is modest, leaving the project vulnerable to market sentiment shifts
SWEAT Regulatory Risk
- Classification Uncertainty: Move-to-earn tokens face evolving regulatory scrutiny in various jurisdictions regarding whether they constitute securities or gambling mechanisms
- Compliance Changes: Regulatory tightening around fitness app tokenization and reward mechanisms could impact SWEAT's utility and value
- Geographic Restrictions: Potential bans or restrictions in major markets could limit user acquisition and token adoption
SWEAT Technical Risk
- Blockchain Dependency: SWEAT's native blockchain is NEAR Protocol; any technical issues or security vulnerabilities on NEAR could impact SWEAT holders
- Cross-Chain Bridge Risk: Token bridging between NEAR and Ethereum introduces additional technical and security risks during the transfer process
- Ecosystem Adoption: The project's success depends heavily on Sweatcoin app adoption rates and sustained user engagement in the fitness tracking space
VI. Conclusions and Action Recommendations
SWEAT Investment Value Assessment
SWEAT represents a speculative investment opportunity in the move-to-earn sector with significant structural challenges. The token's 77.75% annual decline reflects weakening investor confidence in the broader fitness tokenization model. However, the project's long history (Sweatcoin launched in 2016) and active user base provide some fundamental value. Success depends on whether Sweatcoin can achieve mainstream adoption and sustain user engagement. The current price point may offer entry opportunities for risk-tolerant investors betting on ecosystem revitalization, but the high risk level requires careful position sizing.
SWEAT Investment Recommendations
✅ Beginners: Consider SWEAT as a small speculative position (1-2% of crypto portfolio) only after understanding move-to-earn mechanics; prioritize learning the Sweatcoin app's functionality before committing capital
✅ Experienced Investors: Use SWEAT for portfolio diversification in the alternative tokens segment; implement strict stop-loss discipline given volatility; monitor ecosystem developments for potential recovery catalysts
✅ Institutional Investors: Conduct thorough due diligence on regulatory exposure and user retention metrics; if positioning, maintain positions below 0.1% of fund size with explicit risk acknowledgment
SWEAT Trading and Participation Methods
- Gate.com Spot Trading: Buy and sell SWEAT directly using fiat currency or other cryptocurrencies through Gate.com's spot trading interface
- Cross-Chain Bridging: Exchange SWEAT between NEAR and Ethereum networks using the token bridge mechanism to optimize trading pairs and liquidity access
- Sweatcoin App Integration: Earn SWEAT tokens natively through the Sweatcoin mobile application by tracking fitness activity and converting points to tokens
Cryptocurrency investment carries extremely high risk and is not suitable for all investors. This report does not constitute investment advice. Investors should make decisions based on their individual risk tolerance and financial situation. It is strongly recommended to consult with professional financial advisors before investing. Never invest more capital than you can afford to lose. The cryptocurrency market is highly volatile and speculative; past performance does not guarantee future results.
FAQ
How much will Sweatcoin be worth in 2025?
Based on current market analysis, Sweatcoin is projected to reach approximately 0.28 USD in 2025, representing significant growth potential from current levels.
Does sweat crypto have a future?
SWEAT crypto shows promising potential with projected growth trajectory. Price predictions suggest reaching $0.0013123277 by 2026. Market adoption and user engagement will be key drivers determining its long-term success and value appreciation.
Will sweat go up in value?
Yes, SWEAT is projected to increase in value significantly. Based on experimental forecasts, SWEAT could potentially reach $0.01134 by 2034, indicating strong long-term growth potential driven by increasing adoption and market demand.
Is Sweatcoin worth anything?
Yes, Sweatcoin has value as a utility token that rewards physical activity. The SWEAT token can be traded and holds market value, with ongoing adoption in the move-to-earn ecosystem driving its potential growth.
Share
Content
Introduction: SWEAT's Market Position and Investment Value
I. SWEAT Price History Review and Market Status
II. Core Factors Influencing SWEAT's Future Price
2025 Outlook
2026-2028 Medium-term Outlook
2029-2030 Long-term Outlook
IV. SWEAT Professional Investment Strategy and Risk Management
V. SWEAT Potential Risks and Challenges
VI. Conclusions and Action Recommendations
FAQ
How to Buy Cryptocurrency


Trending Cryptocurrencies


Why is CryptoJack so hopeful about Gate.com and GT TOKEN in this bull run?

What Does 'Stonks' Mean ?

Aergo Price Analysis: 112% Surge in 90 Days - What's Next for 2025?

Sahara AI (SAHARA) Price Analysis: Recent Volatility Trends and Market Correlations

why is crypto crashing and will it recover ?

How to convert SOL to USD: Real-time Solana price calculator

How to Delete My Account

What is P2P Trading on a Leading Platform?

BTC Option Flows Explained, Why Bitcoin Above 93,000 Suggests a Bullish Start to 2026
Bitcoin Options Traders Eye USD $100,000 as Derivatives Signal Market Reset

What Is GLD ETF, Understanding Gold Price Exposure and Structure
