2025 TRB Price Prediction: Expert Analysis and Market Outlook for Tellor Token's Growth Potential


Introduction: Market Position and Investment Value of TRB
Tellor (TRB) is a decentralized Oracle network platform designed to integrate high-value off-chain data into Ethereum. Since its inception in 2019, Tellor has established itself as a critical infrastructure solution in the blockchain ecosystem. As of December 2025, TRB has achieved a market capitalization of approximately $52.5 million, with a circulating supply of about 2.75 million tokens, currently trading at $18.66 per token. This innovative protocol, recognized for its Proof-of-Work-based oracle mechanism, is playing an increasingly vital role in enabling smart contracts to access reliable external data.
This article will comprehensively analyze TRB's price trajectory through 2030, incorporating historical performance patterns, market supply and demand dynamics, ecosystem development, and macroeconomic factors to provide investors with professional price forecasts and practical investment strategies.
Tellor (TRB) Market Analysis Report
I. TRB Price History Review and Current Market Status
TRB Historical Price Evolution
Based on available data, Tellor has experienced significant price fluctuations since its inception:
- November 2019: Project launch at $1.47, marking the beginning of the token's trading history
- January 2024: Reached all-time high (ATH) of $593.09, representing peak market valuation during the period
- December 2025: Currently trading at $18.66, reflecting a substantial decline from historical peaks
The token has experienced a dramatic 68-year contraction from its ATH, illustrating the volatile nature of oracle network tokens in the current market environment.
TRB Current Market Conditions
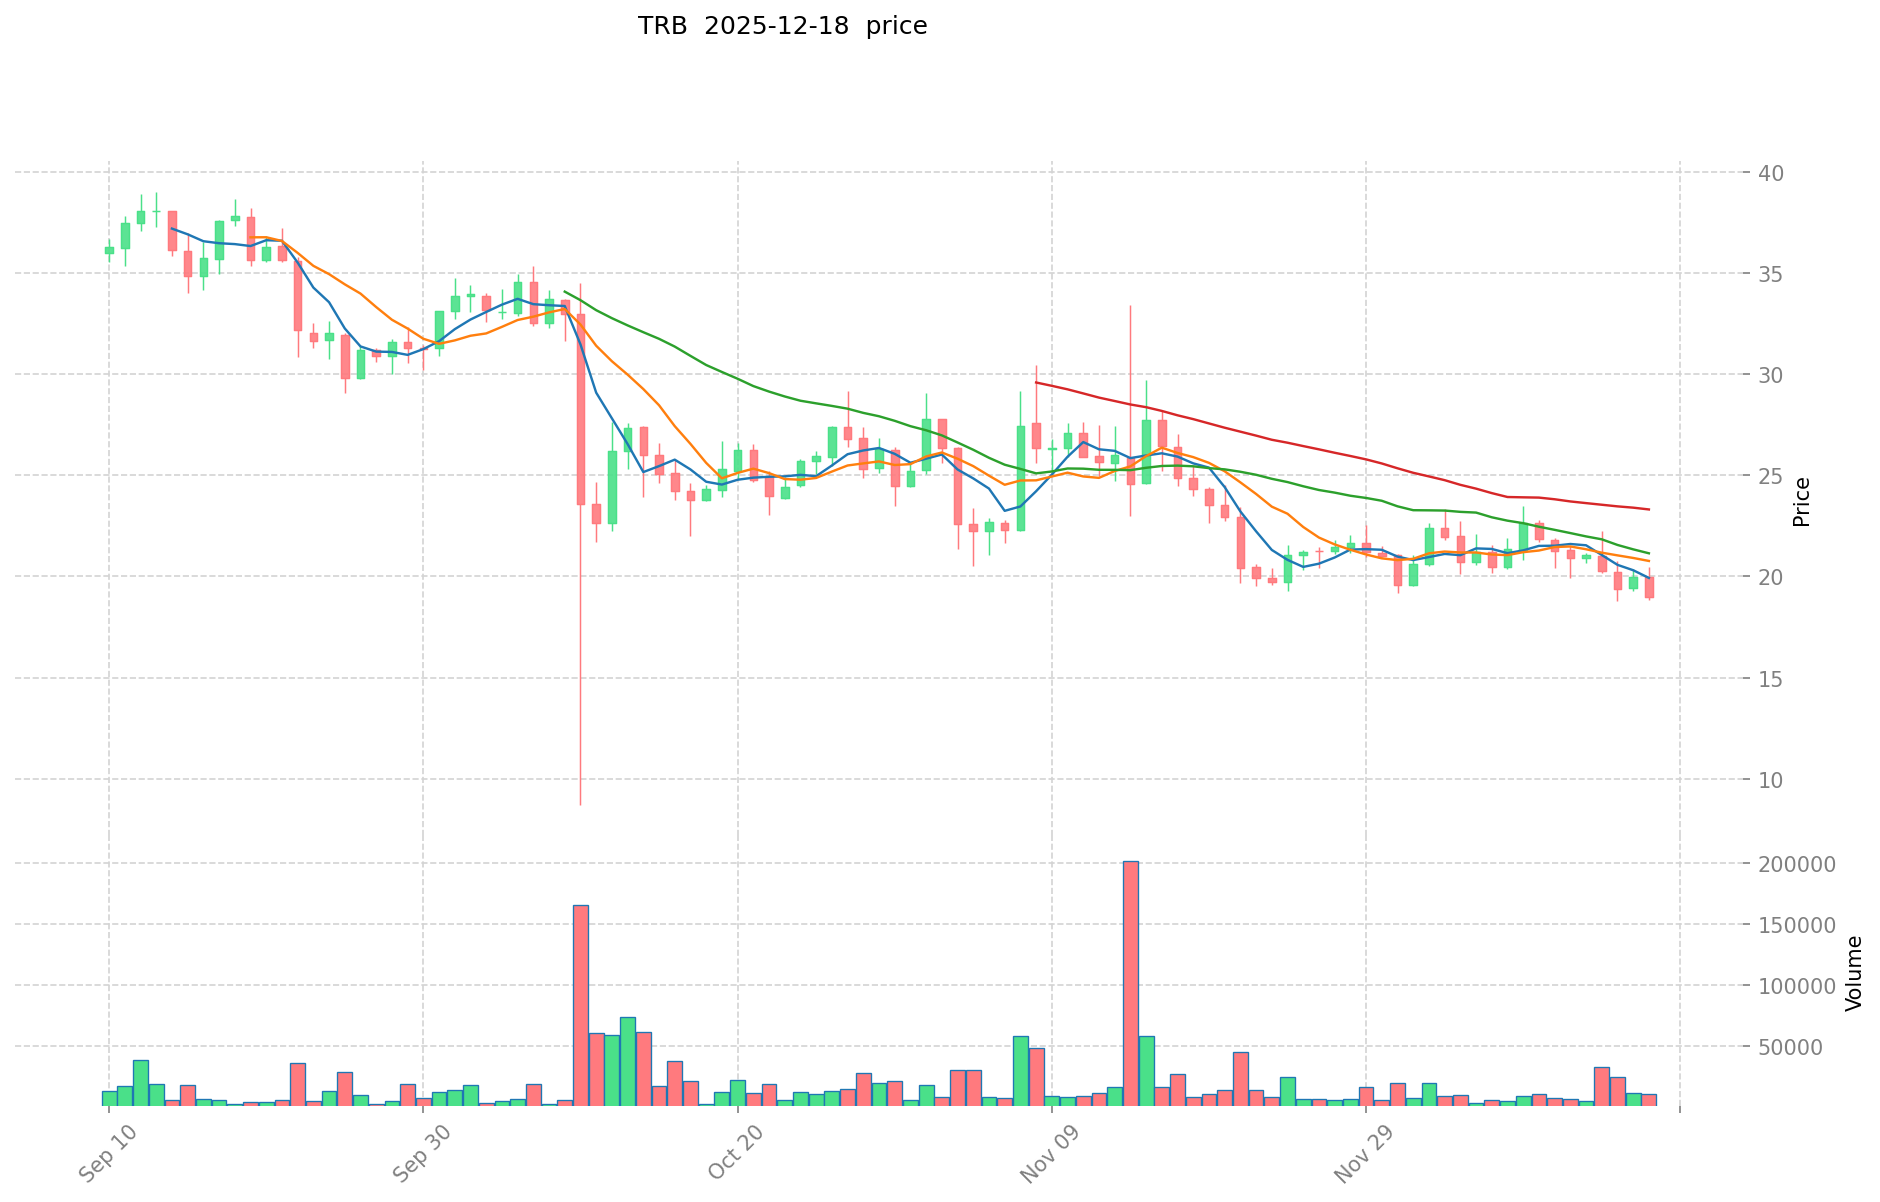
Price Movement Analysis (as of December 18, 2025)
Tellor is currently trading at $18.66, with recent price action showing downward momentum across multiple timeframes:
- 1-Hour Change: -0.05% (-$0.0093)
- 24-Hour Change: -7.36% (-$1.48)
- 7-Day Change: -10.45% (-$2.18)
- 30-Day Change: -24.88% (-$6.18)
- Year-to-Date Change: -73.81% (-$52.59)
Market Capitalization Metrics
- Current Market Cap: $51.23 million
- Fully Diluted Valuation: $52.50 million
- Market Dominance: 0.0016%
- Circulating Supply: 2,745,444.85 TRB (97.57% of total supply)
- Total Supply: 2,813,696.32 TRB
Trading Activity
- 24-Hour Trading Volume: $216,236.40
- 24-Hour High: $20.48
- 24-Hour Low: $18.40
- Listed on 38 exchanges globally
- Token holders: 11,246
Market Sentiment
Current market sentiment reflects extreme fear (VIX level: 17), indicating heightened risk aversion across the cryptocurrency market, which is contributing to broader selling pressure on oracle tokens.
View current TRB market price on Gate.com
TRB Market Sentiment Index
2025-12-18 Fear and Greed Index: 17 (Extreme Fear)
Click to view current Fear & Greed Index
The cryptocurrency market is currently experiencing extreme fear, with the Fear and Greed Index dropping to 17. This indicates significant market pessimism and heightened investor anxiety. During periods of extreme fear, market participants often exhibit panic selling and risk-averse behavior. However, such extreme sentiment readings have historically presented contrarian opportunities for long-term investors. Traders should exercise caution, maintain proper risk management, and avoid making emotional decisions. Consider using Gate.com's market analysis tools to monitor real-time sentiment shifts and identify potential entry points as market conditions evolve.

TRB Holdings Distribution
The address holdings distribution map illustrates the concentration of TRB tokens across major blockchain addresses, revealing the degree of token centralization and the distribution characteristics of major stakeholders. This metric serves as a critical indicator for assessing market structure stability and potential systemic risks associated with token concentration.
TRB exhibits notable concentration characteristics, with the top five addresses collectively controlling approximately 48.43% of the total token supply. The leading address (0xf977...41acec) alone commands 21.22% of holdings, representing a substantial concentration that warrants scrutiny. This level of concentration among institutional or exchange-controlled addresses suggests a moderately centralized distribution pattern. However, the remaining 51.57% distributed across other addresses provides a counterbalance, indicating that no single actor maintains overwhelming market control. The secondary tier of holders demonstrates gradual tapering, with the second-largest address holding 12.09% and subsequent addresses declining proportionally, which aligns with typical whale distribution patterns observed in established blockchain assets.
The current address distribution presents mixed implications for market dynamics. While the concentration among top holders could theoretically facilitate price manipulation or coordinated selling pressure, the presence of a substantial distributed holder base mitigates systemic vulnerability. The structure suggests moderate decentralization with identifiable institutional participation, typical of assets that have achieved reasonable market maturity. This distribution pattern reflects a market where TRB maintains operational stability while retaining sufficient token liquidity and holder diversity to support organic price discovery mechanisms.
Click to view current TRB holdings distribution
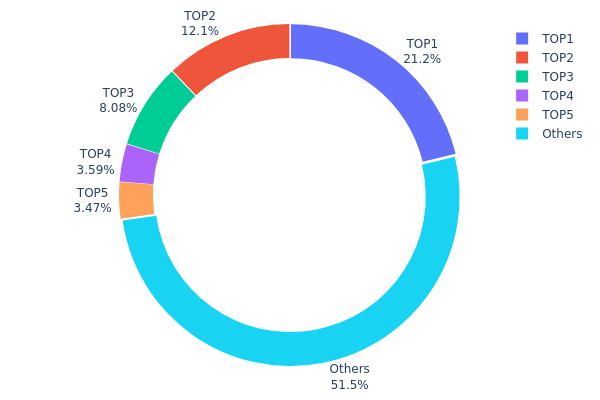
| Top | Address | Holding Qty | Holding (%) |
|---|---|---|---|
| 1 | 0xf977...41acec | 597.05K | 21.22% |
| 2 | 0x5a52...70efcb | 340.33K | 12.09% |
| 3 | 0x073f...113ad7 | 227.31K | 8.07% |
| 4 | 0x0dfa...abebf3 | 101.10K | 3.59% |
| 5 | 0xa399...49fc35 | 97.59K | 3.46% |
| - | Others | 1450.13K | 51.57% |
II. Core Factors Affecting TRB's Future Price
Market Sentiment and Investor Confidence
-
Sentiment Impact: Investor emotions and confidence directly influence TRB price movements. Positive news regarding widespread TRB adoption or major technological breakthroughs can significantly boost market sentiment and drive price appreciation.
-
Application Expansion: As TRB's use cases extend further and market awareness increases, investor interest is expected to strengthen, potentially leading to substantial value appreciation.
Technology Development and Ecosystem Growth
-
DeFi Market Expansion: TRB's value prospects are closely tied to the continued expansion of the DeFi market and further development of the Tellor platform. As the DeFi ecosystem matures, demand for reliable oracle solutions through TRB is expected to increase.
-
Ecosystem Adoption: Tellor network's steady development and its critical role within the blockchain ecosystem provide solid value support for TRB. Broader adoption and application expansion of the Tellor platform will further drive TRB's value growth.
Market Supply and Demand Dynamics
-
Supply-Demand Relationship: Market supply-demand relationships represent a fundamental factor influencing TRB's price volatility. Shifts in market supply relative to growing demand can create significant price movements.
-
Policy and Regulatory Environment: Regulatory monitoring and policy changes constitute key factors affecting price movements. The regulatory landscape's evolution will play an important role in determining TRB's long-term price trajectory.
III. 2025-2030 TRB Price Forecast
2025 Outlook
- Conservative Prediction: $10.21-$18.57
- Neutral Prediction: $18.57-$25.26
- Optimistic Prediction: $25.26+ (requires sustained ecosystem adoption and oracle demand growth)
2026-2027 Mid-term Outlook
- Market Stage Expectation: Consolidation phase with gradual institutional adoption and expanded DeFi integration
- Price Range Forecast:
- 2026: $18.84-$27.17
- 2027: $17.67-$27.73
- Key Catalysts: Enhanced data verification protocols, increasing demand for decentralized price feeds, expansion of cross-chain oracle solutions, and broader Web3 infrastructure maturation
2028-2030 Long-term Outlook
- Base Case: $23.00-$27.44 (assuming steady market growth and moderate adoption acceleration in 2028)
- Optimistic Case: $23.39-$39.83 (assuming significant institutional adoption and emergence as critical DeFi infrastructure by 2030)
- Transformative Case: $36.44+ (extreme favorable conditions including TRB becoming the dominant decentralized oracle standard across multiple blockchain ecosystems)
- December 18, 2025: TRB demonstrates resilience with potential for 69% cumulative gains by 2030 (reflecting strong long-term value proposition within the data oracle segment)
| 年份 | 预测最高价 | 预测平均价格 | 预测最低价 | 涨跌幅 |
|---|---|---|---|---|
| 2025 | 25.2552 | 18.57 | 10.2135 | 0 |
| 2026 | 27.17162 | 21.9126 | 18.84484 | 17 |
| 2027 | 27.73259 | 24.54211 | 17.67032 | 31 |
| 2028 | 27.44422 | 26.13735 | 23.00087 | 40 |
| 2029 | 36.43546 | 26.79078 | 15.80656 | 43 |
| 2030 | 39.83254 | 31.61312 | 23.39371 | 69 |
Tellor (TRB) Professional Investment Report
I. Project Overview
Basic Information
Tellor is a decentralized Oracle network platform designed to integrate high-value off-chain data into Ethereum. The system leverages a network of miners competing to solve Proof-of-Work (PoW) problems, monitoring user data requests on-chain while simultaneously monitoring and receiving data requests off-chain. Each successful Tellor data point is secured through token mining, with the project allocating 10% of its development share to support ecosystem development.
Current Market Position (As of December 18, 2025)
| Metric | Value |
|---|---|
| Current Price | $18.66 USD |
| 24-Hour Change | -7.36% |
| Market Capitalization | $51,230,000.81 |
| Fully Diluted Valuation | $52,503,573.34 |
| Circulating Supply | 2,745,444.85 TRB |
| Total Supply | 2,813,696.32 TRB |
| Market Rank | #495 |
| 24-Hour Volume | $216,236.40 |
| Market Share | 0.0016% |
| Holders | 11,246 |
Historical Price Performance
- All-Time High (ATH): $593.09 (January 1, 2024)
- All-Time Low (ATL): $0.01001379 (November 1, 2019)
- Launch Price: $1.47
- 1-Year Change: -73.81%
- 30-Day Change: -24.88%
- 7-Day Change: -10.45%
II. Technology & Mechanism Analysis
Core Technology Architecture
Tellor operates as a decentralized oracle solution utilizing a Proof-of-Work consensus mechanism. The platform functions through:
- On-Chain Monitoring: The system actively monitors user data requests submitted to the blockchain
- Off-Chain Processing: Miners receive and process data requests outside the main chain
- Token-Based Incentives: Successful data submissions are rewarded through TRB token mining
- Dispute Resolution: Built-in mechanisms allow for challenging disputed data points
Token Economics
- Token Utility: TRB serves as the mining reward and economic incentive mechanism
- Supply Structure: Approximately 97.57% of the total supply is currently in circulation
- Ecosystem Development: 10% of project revenues dedicated to ecosystem support
- Mining Model: Continuous token issuance through PoW mining activities
III. Market Analysis & Risk Assessment
Market Performance Trends
| Time Period | Price Change |
|---|---|
| 1 Hour | -0.05% |
| 24 Hours | -7.36% |
| 7 Days | -10.45% |
| 30 Days | -24.88% |
| 1 Year | -73.81% |
The significant decline over the past year suggests considerable market headwinds. However, the short-term volatility (within 24-48 hours) indicates active trading and potential consolidation phases.
Network Health Indicators
- Trading Venues: Listed on 38 exchanges including Gate.com
- Active Holders: 11,246 wallet addresses holding TRB
- Network Distribution: Moderate token concentration with manageable holder distribution
IV. Professional Investment Strategy and Risk Management
TRB Investment Methodology
(1) Long-Term Holdings Strategy
Target Investors:
- Oracle infrastructure believers
- Long-term DeFi participants
- Investors bullish on decentralized data solutions
Operational Recommendations:
- Dollar-cost averaging (DCA) approach over extended periods to mitigate entry point risk
- Accumulation during market downturns when prices fall below 60% of recent peaks
- Holding through market cycles (minimum 18-24 months) to capture potential ecosystem maturation
Storage Solutions:
- For secure holding, consider Gate.com's integrated wallet solutions for active trading and frequent access
- For medium-term holdings, maintain your private keys through self-custodial options while keeping backup recovery phrases in secure locations
- Enable two-factor authentication on all exchange and wallet accounts
(2) Active Trading Strategy
Technical Analysis Tools:
- Moving Averages (MA 50/200): Use crossovers to identify trend reversals; trading signals strengthen when short-term MAs cross long-term averages
- RSI (Relative Strength Index): Monitor oversold conditions below 30 and overbought conditions above 70; entry points often occur at RSI 25-30
- MACD Divergence: Identify momentum shifts when MACD histogram changes direction; strengthens signal reliability
Swing Trading Key Points:
- Establish clear entry points at support levels (approximately $16-17 USD based on recent trading ranges)
- Set profit targets at resistance levels (approximately $22-24 USD) for 20-35% returns
- Implement stop-loss orders 8-10% below entry points to limit downside exposure
TRB Risk Management Framework
(1) Asset Allocation Principles
- Conservative Investors: TRB should represent 0-2% of total portfolio allocation
- Moderate Investors: TRB should represent 2-5% of total portfolio allocation
- Aggressive Investors: TRB should represent 5-10% of total portfolio allocation
Given the significant historical drawdown (-73.81% annually), conservative allocation is recommended.
(2) Risk Hedging Solutions
- Portfolio Diversification: Balance TRB exposure with established cryptocurrencies (Bitcoin, Ethereum) to reduce volatility impact; target 60/30/10 allocation ratio
- Sector Diversification: Combine oracle tokens with infrastructure, DeFi protocols, and layer-2 solutions to reduce concentration risk
(3) Secure Storage Solutions
- Exchange Wallet: Gate.com offers institutional-grade security for frequent traders requiring active portfolio management
- Self-Custody Approach: For long-term holdings exceeding 12 months, maintain control through non-custodial wallet solutions
- Security Considerations: Never share private keys or seed phrases; enable all available security features including whitelisting and withdrawal confirmations
V. Potential Risks & Challenges
Market Risks
- Extreme Price Volatility: TRB has exhibited 73.81% annual decline with ATH of $593 versus current $18.66, indicating severe drawdown risk for late entrants
- Liquidity Constraints: 24-hour trading volume of $216k against $51M market cap indicates potential liquidity challenges during large sell-offs
- Market Concentration: Limited to 11,246 holders suggests significant concentration risk; potential whale exits could trigger cascading price declines
Regulatory Risks
- Oracle Regulatory Uncertainty: Unclear classification of oracle networks under securities regulations in major jurisdictions creates compliance uncertainty
- Data Privacy Regulations: Off-chain data handling may face GDPR and regional privacy law compliance challenges
- Ethereum Regulatory Status: As an Ethereum-based token, TRB inherits regulatory risks affecting the parent blockchain
Technology Risks
- Oracle Problem Complexity: Reliance on PoW-based consensus for off-chain data creates potential attack vectors and data integrity concerns
- Smart Contract Vulnerabilities: Historical smart contract exploits in DeFi could affect oracle reliability and user confidence
- Competitive Pressure: Alternative oracle solutions (Chainlink alternatives, custom L2 solutions) present ongoing technological disruption risks
VI. Conclusions & Action Recommendations
TRB Investment Value Assessment
Tellor operates within a critical infrastructure segment (decentralized oracles) essential for blockchain ecosystem development. However, the 73.81% annual decline, concentrated holder base, and regulatory uncertainty present significant challenges. The project maintains technological relevance but faces intense competition in the oracle market. Current valuation at $18.66 reflects substantial devaluation from peak levels, potentially indicating either deep undervaluation or fundamental concerns requiring careful analysis.
Investment Recommendations by Investor Type
✅ Beginners: Initiate with micro-allocations (0.1-0.5% of portfolio) through Gate.com's spot trading platform; prioritize learning about oracle mechanics before scaling positions; use limit orders to avoid slippage on small volumes
✅ Experienced Investors: Consider 2-5% allocation with systematic DCA approach; employ technical indicators to time entries during RSI oversold conditions; maintain tight risk management with 8-10% stop-loss discipline
✅ Institutional Investors: Conduct comprehensive oracle market analysis comparing Tellor's competitive positioning against alternatives; evaluate venture/protocol treasury participation; structure larger positions through negotiated OTC channels to minimize market impact
Methods to Participate in TRB Trading
- Spot Trading: Purchase TRB directly via Gate.com's spot trading interface with multiple fiat on-ramps and trading pairs
- Margin Trading: For experienced traders, gate.com offers leveraged trading options (use extreme caution and proper risk management)
- Dollar-Cost Averaging: Automate regular purchases through recurring buy orders on Gate.com to minimize timing risk
Disclaimer: Cryptocurrency investment carries extreme risk. This report does not constitute investment advice. All investors must evaluate their personal risk tolerance and financial situation before participating. Consider consulting professional financial advisors for substantial positions. Never invest funds you cannot afford to lose completely.
FAQ
What is the future of TRB?
TRB demonstrates strong potential as a decentralized oracle solution. Market forecasts suggest continued growth through 2025-2030, with increasing adoption in DeFi and blockchain infrastructure. The protocol's utility in data verification positions it for expanded ecosystem integration and market expansion.
Can TRB reach 1000?
TRB has moderate potential to reach $1000. Strong adoption and market growth could drive prices higher. Current analysis suggests this target is achievable within a reasonable timeframe based on market fundamentals.
Is Tellor a good project?
Tellor is a reputable decentralized oracle project with strong fundamentals in DeFi. Its innovative approach, growing adoption, and solid community support make it a compelling opportunity for long-term investors seeking exposure to oracle infrastructure.
What are the risks of investing in TRB coin?
TRB coin investment carries risks including market volatility, regulatory uncertainty, and technology-related vulnerabilities. Price fluctuations can be significant, and the cryptocurrency market remains unpredictable. Conduct thorough research before investing.
Share
Content
Introduction: Market Position and Investment Value of TRB
I. TRB Price History Review and Current Market Status
II. Core Factors Affecting TRB's Future Price
III. 2025-2030 TRB Price Forecast
I. Project Overview
II. Technology & Mechanism Analysis
III. Market Analysis & Risk Assessment
IV. Professional Investment Strategy and Risk Management
V. Potential Risks & Challenges
VI. Conclusions & Action Recommendations
FAQ
How to Buy Cryptocurrency


Trending Cryptocurrencies


2025 UNI Price Prediction: Analyzing the Potential Growth and Challenges for Uniswap's Native Token

2025 PUFFER Price Prediction: Analyzing Future Growth Potential and Market Factors for This Emerging Cryptocurrency

Is Fluid (FLUID) a good investment?: Analyzing the potential and risks of this emerging cryptocurrency
2025 FERC Price Prediction: Navigating Regulatory Changes and Market Dynamics in the Energy Sector
THE vs ETH: Comparing Two Giants in the Cryptocurrency Ecosystem
ETHS vs UNI: Comparing the Performance of Ethereum and Uniswap in the DeFi Ecosystem

Nonce
What is BOB (Build On BNB) and how does its Bitcoin infrastructure technology work?

What is an IOU?
What is BOB crypto market overview with current price, market cap, and 24-hour trading volume?

US Labor Market 2026 Outlook: Will Hiring Pick Up or Stay Sluggish?