2025 USDE Price Prediction: Expert Analysis and Market Forecast for the Digital Economy Token

Introduction: USDE's Market Position and Investment Value
Ethena USDe (USDE) as a censorship-resistant, scalable, and stable crypto-native solution, has achieved significant milestones since its inception. As of 2025, USDE's market capitalization has reached $6.51 billion, with a circulating supply of approximately 6,510,668,424 tokens, maintaining a price of around $0.9994. This asset, hailed as the "synthetic dollar," is playing an increasingly crucial role in decentralized finance and stable value transfer.
This article will comprehensively analyze USDE's price trends from 2025 to 2030, combining historical patterns, market supply and demand, ecosystem development, and macroeconomic factors to provide investors with professional price predictions and practical investment strategies.
I. USDE Price History Review and Current Market Status
USDE Historical Price Evolution
- 2024: USDE launched, reaching an all-time high of $1.5 on November 14, 2024
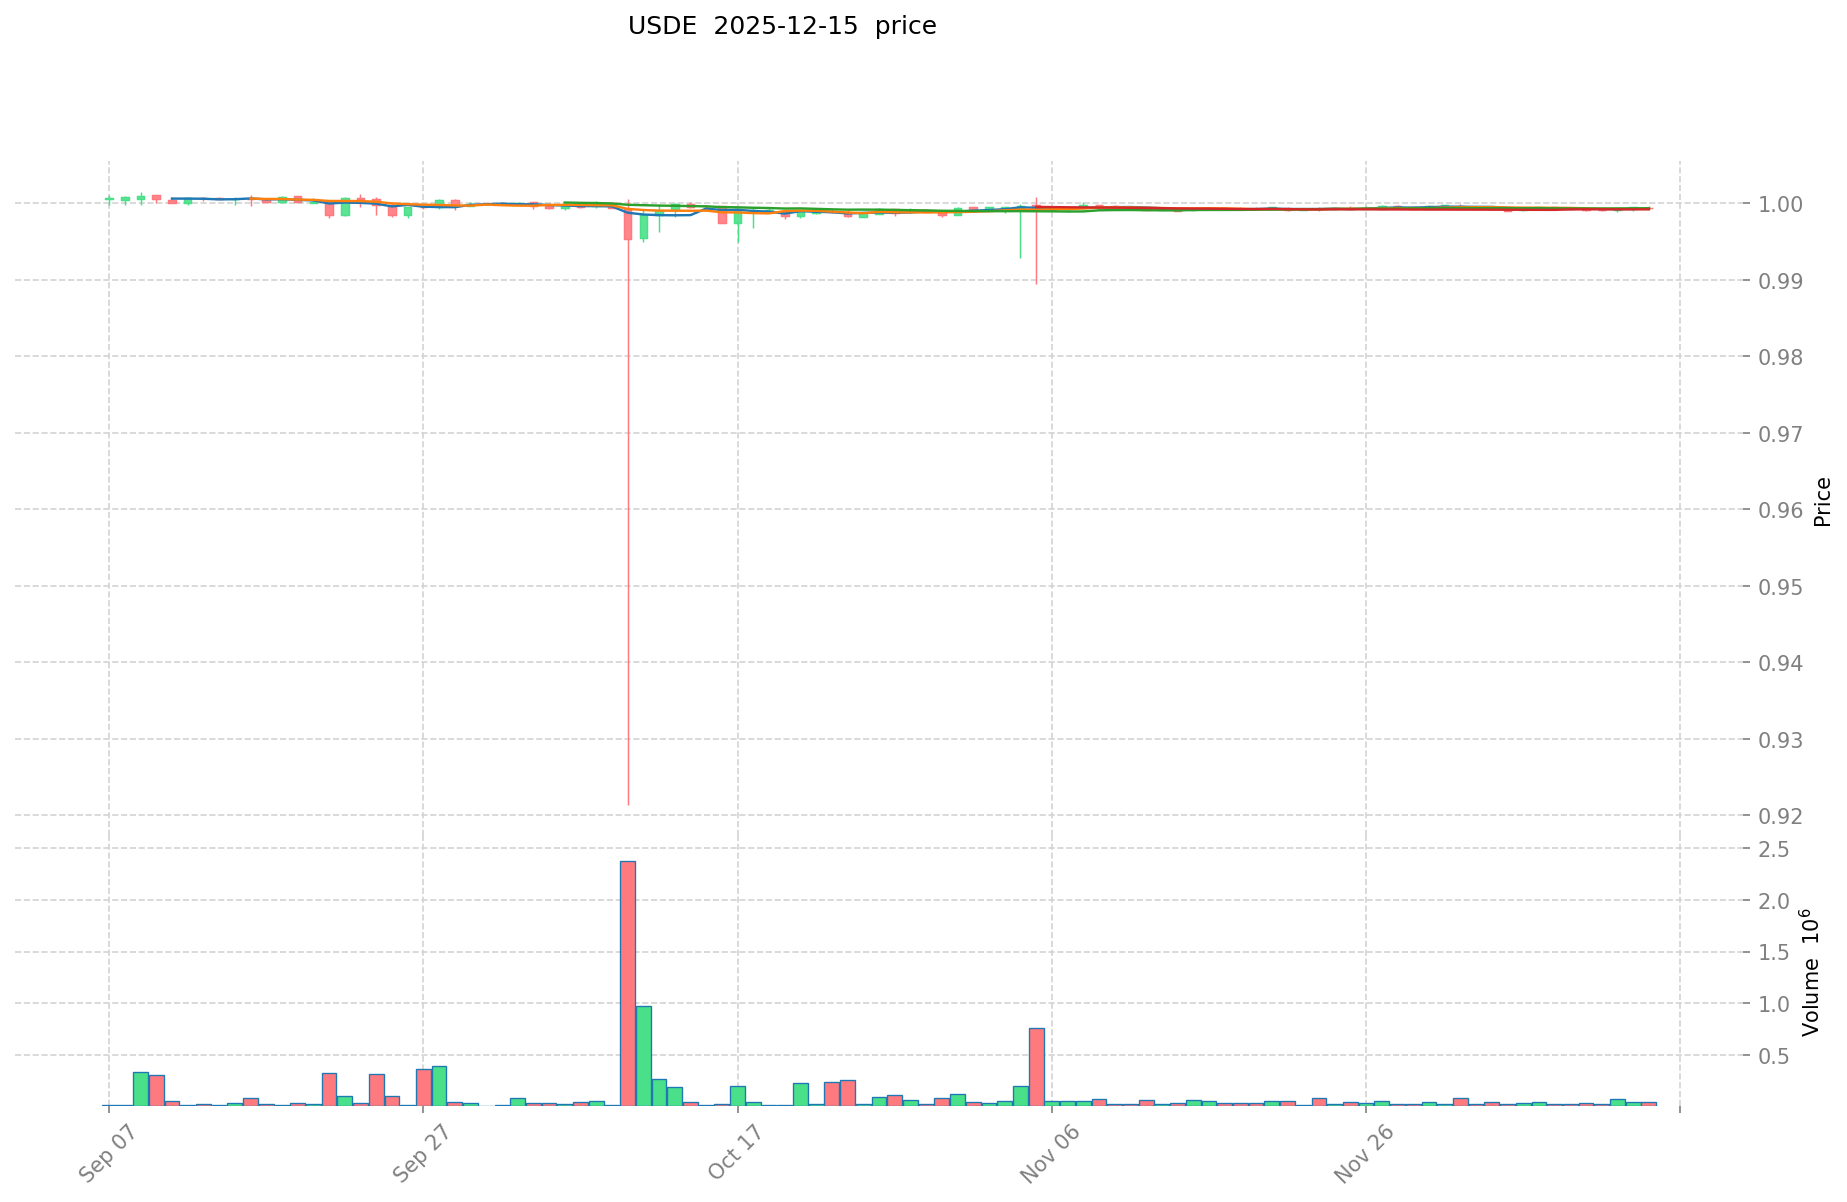
- 2025: Experienced volatility, with price dropping to an all-time low of $0.9213 on October 10, 2025
- 2025: Market stabilization, price recovered and maintained close to $1 peg
USDE Current Market Situation
As of December 15, 2025, USDE is trading at $0.9994, showing remarkable stability for a stablecoin. The 24-hour trading volume stands at $24,074.56, indicating moderate market activity. With a circulating supply of 6,510,668,424 USDE and a total market capitalization of $6,506,762,023, USDE ranks 26th in the global cryptocurrency market.
The coin has shown minimal price fluctuations over various time frames: 0.12% increase in the last hour, 0.02% in the past 24 hours, and 0.01% over both 7 and 30 days. However, it shows a slight decrease of 0.16% over the past year, demonstrating long-term stability around its target peg.
USDE's market dominance is currently at 0.17%, reflecting its growing importance in the stablecoin ecosystem. The fully diluted valuation matches the current market cap, indicating full circulation of the token supply.
Click to view the current USDE market price
USDE Market Sentiment Indicator
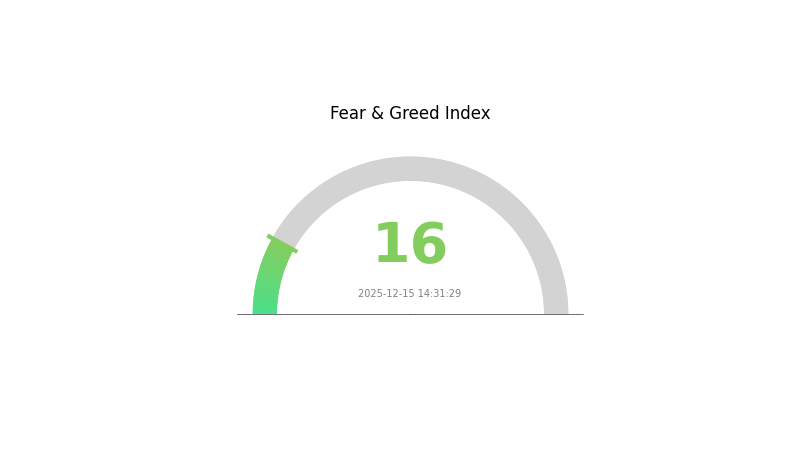
2025-12-15 Fear and Greed Index: 16 (Extreme Fear)
Click to view the current Fear & Greed Index
The crypto market is gripped by extreme fear, with the Fear and Greed Index plummeting to 16. This signals a potential buying opportunity for astute investors. While many are panic-selling, seasoned traders may see this as a chance to accumulate at lower prices. However, caution is advised as market sentiment can shift rapidly. Always conduct thorough research and consider your risk tolerance before making investment decisions. Remember, market cycles are natural, and periods of extreme fear often precede significant recoveries.
USDE Holdings Distribution
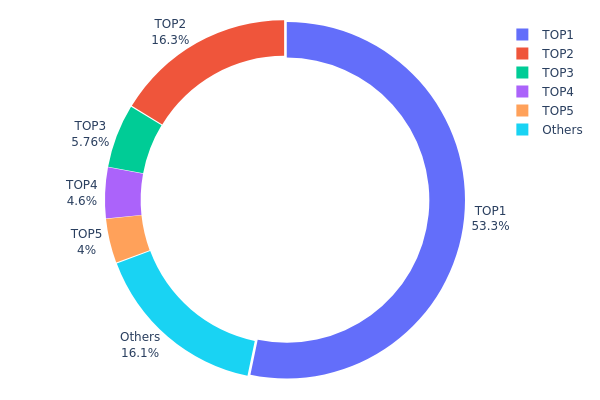
The address holdings distribution data for USDE reveals a highly concentrated ownership structure. The top address holds a significant 53.26% of the total supply, with the top five addresses collectively controlling 83.91% of USDE tokens. This level of concentration raises concerns about centralization and potential market manipulation.
Such a concentrated distribution could lead to increased volatility and susceptibility to large price swings if major holders decide to liquidate their positions. The dominance of a few large addresses also suggests a relatively low level of decentralization, which may impact the overall stability and fairness of the USDE ecosystem.
While the presence of smaller holders (16.09% held by "Others") indicates some degree of wider distribution, the current structure poses risks to market integrity and may deter broader adoption. Monitoring changes in this distribution over time will be crucial for assessing USDE's long-term sustainability and market dynamics.
Click to view the current USDE Holdings Distribution
| Top | Address | Holding Qty | Holding (%) |
|---|---|---|---|
| 1 | 0x9d39...7a3497 | 3471653.25K | 53.26% |
| 2 | 0x5d3a...52ef34 | 1062730.64K | 16.30% |
| 3 | 0x4f59...12decf | 375538.62K | 5.76% |
| 4 | 0xf977...41acec | 300000.00K | 4.60% |
| 5 | 0x7fc7...713425 | 260521.89K | 3.99% |
| - | Others | 1046685.73K | 16.09% |
II. Key Factors Influencing USDE's Future Price
Supply Mechanism
- Elastic Supply: Market demand changes will automatically adjust the USDE supply scale, maintaining its peg to the US dollar.
- Practical Impact: The elastic supply mechanism effectively stabilizes USDE price around $1, reducing volatility.
Macroeconomic Environment
- Monetary Policy Impact: Adjustments in interest rates and monetary policies will affect the attractiveness of USDE as an asset.
- Inflation Hedging Properties: USDE may serve as a "digital dollar" in inflationary environments.
- Geopolitical Factors: Geopolitical uncertainties could potentially exacerbate USDE volatility.
Technical Development and Ecosystem Building
- DeFi Integration: USDE's role as an intermediary currency in decentralized finance (DeFi) supports lending, trading, and other scenarios.
- Ecosystem Applications: DeFi lending platforms offer staking yields typically between 3.5%-5%, higher than traditional bank deposit rates.
III. USDE Price Prediction for 2025-2030
2025 Outlook
- Conservative forecast: $0.67959 - $0.9994
- Neutral forecast: $0.9994 - $1.12433
- Optimistic forecast: $1.12433 - $1.24925 (requires favorable market conditions and increased adoption)
2026-2027 Outlook
- Market phase expectation: Gradual growth and consolidation
- Price range prediction:
- 2026: $0.98941 - $1.67524
- 2027: $0.72789 - $1.56776
- Key catalysts: Expanding use cases, regulatory clarity, and technological advancements
2028-2030 Long-term Outlook
- Base scenario: $1.48377 - $2.11753 (assuming steady market growth and adoption)
- Optimistic scenario: $2.11753 - $2.50646 (with accelerated adoption and favorable regulatory environment)
- Transformative scenario: $2.50646 - $2.83749 (with breakthrough innovations and mainstream integration)
- 2030-12-31: USDE $2.83749 (potential peak based on optimistic projections)
| 年份 | 预测最高价 | 预测平均价格 | 预测最低价 | 涨跌幅 |
|---|---|---|---|---|
| 2025 | 1.24925 | 0.9994 | 0.67959 | 0 |
| 2026 | 1.67524 | 1.12433 | 0.98941 | 12 |
| 2027 | 1.56776 | 1.39978 | 0.72789 | 40 |
| 2028 | 1.97342 | 1.48377 | 0.96445 | 48 |
| 2029 | 2.50646 | 1.72859 | 1.62488 | 72 |
| 2030 | 2.83749 | 2.11753 | 1.50344 | 111 |
IV. USDE Professional Investment Strategies and Risk Management
USDE Investment Methodology
(1) Long-term Holding Strategy
- Suitable for: Conservative investors seeking stable returns
- Operation suggestions:
- Accumulate USDE during market dips
- Hold for extended periods to benefit from potential ecosystem growth
- Store in secure non-custodial wallets
(2) Active Trading Strategy
- Technical analysis tools:
- Moving Averages: Monitor short-term and long-term trends
- Relative Strength Index (RSI): Identify overbought or oversold conditions
- Key points for swing trading:
- Set strict stop-loss orders to manage risk
- Monitor market sentiment and on-chain metrics
USDE Risk Management Framework
(1) Asset Allocation Principles
- Conservative investors: 5-10% of portfolio
- Aggressive investors: 10-20% of portfolio
- Professional investors: 20-30% of portfolio
(2) Risk Hedging Solutions
- Diversification: Spread investments across various stablecoins and crypto assets
- Use of options: Consider protective put options to limit downside risk
(3) Secure Storage Solutions
- Hot wallet recommendation: Gate Web3 Wallet
- Cold storage solution: Hardware wallets for long-term holdings
- Security precautions: Enable two-factor authentication, use strong passwords, and regularly update software
V. Potential Risks and Challenges for USDE
USDE Market Risks
- Liquidity risk: Potential challenges in maintaining sufficient market depth
- Collateral volatility: Fluctuations in the value of staked Ethereum backing USDE
- Competitive pressure: Emergence of new stablecoin solutions
USDE Regulatory Risks
- Stablecoin regulation: Potential new rules affecting USDE's operations
- Cross-border restrictions: Varying regulatory approaches in different jurisdictions
- Compliance requirements: Evolving KYC/AML standards for stablecoin issuers
USDE Technical Risks
- Smart contract vulnerabilities: Potential bugs or exploits in the underlying code
- Oracle failures: Risks associated with price feed inaccuracies
- Scaling challenges: Potential issues with transaction processing during high demand
VI. Conclusion and Action Recommendations
USDE Investment Value Assessment
USDE presents a unique value proposition as a censorship-resistant, scalable stablecoin solution. While it offers potential long-term benefits for the crypto ecosystem, investors should be aware of short-term risks related to market adoption and regulatory uncertainties.
USDE Investment Recommendations
✅ Beginners: Start with small allocations and focus on understanding the technology ✅ Experienced investors: Consider USDE as part of a diversified stablecoin portfolio ✅ Institutional investors: Evaluate USDE for potential inclusion in treasury management strategies
USDE Participation Methods
- Spot trading: Purchase USDE on Gate.com
- Yield farming: Explore liquidity provision opportunities in DeFi protocols
- Ecosystem participation: Engage with Ethena governance and community initiatives
Cryptocurrency investments carry extremely high risks, and this article does not constitute investment advice. Investors should make decisions carefully based on their own risk tolerance and are advised to consult professional financial advisors. Never invest more than you can afford to lose.
FAQ
Is USDe a stable coin?
Yes, USDe is a stablecoin pegged to the US dollar. It's issued by Visa to enable fast, secure transactions in the digital asset space.
Is USDe fully backed?
Yes, USDe is fully backed by crypto assets and hedged positions, ensuring stability despite market fluctuations. Unlike UST, it's not reliant on algorithms for its value.
How much is USDe worth today?
As of December 15, 2025, USDe is worth $1.00, maintaining its peg to the US dollar. This stablecoin's value remains consistent, offering a reliable digital asset in the crypto market.
Who is the owner of USDe?
Guy Young, the CEO and Founder of Ethena Labs, is the owner of USDe. Ethena Labs developed USDe as a fully backed on-chain stablecoin.
Share
Content
Introduction: USDE's Market Position and Investment Value
I. USDE Price History Review and Current Market Status
II. Key Factors Influencing USDE's Future Price
III. USDE Price Prediction for 2025-2030
IV. USDE Professional Investment Strategies and Risk Management
V. Potential Risks and Challenges for USDE
VI. Conclusion and Action Recommendations
FAQ
How to Buy Cryptocurrency


Trending Cryptocurrencies


XZXX: A Comprehensive Guide to the BRC-20 Meme Token in 2025

Bitcoin Fear and Greed Index: Market Sentiment Analysis for 2025

5 ways to get Bitcoin for free in 2025: Newbie Guide

Top Crypto ETFs to Watch in 2025: Navigating the Digital Asset Boom
Bitcoin Market Cap in 2025: Analysis and Trends for Investors
2025 Bitcoin Price Prediction: Trump's Tariffs' Impact on BTC

US Labor Market 2026 Outlook: Will Hiring Pick Up or Stay Sluggish?

How to Use MACD, RSI, and KDJ Indicators for Crypto Trading in 2025
How does LAB token price volatility compare to Bitcoin and Ethereum in 2026?

What Is FTN Price Volatility: Why Did FTN Drop From $4.4 to $1.95 in 2025?
Goerli Testnet