FEAR vs DOT: Navigating Emotional and Rational Decision-Making in Uncertain Times


Introduction: FEAR vs DOT Investment Comparison
In the cryptocurrency market, the comparison between FEAR and DOT has always been a topic that investors cannot avoid. The two not only have significant differences in market cap ranking, application scenarios, and price performance, but also represent different positioning in crypto assets.
FEAR (FEAR): Since its launch in 2021, it has gained market recognition as a mixed NFT token and blockchain game horror brand.
DOT (DOT): Introduced in 2020, it has been hailed as a network that connects various blockchain ecosystems, and is one of the cryptocurrencies with high global trading volume and market capitalization.
This article will comprehensively analyze the investment value comparison between FEAR and DOT, focusing on historical price trends, supply mechanisms, institutional adoption, technical ecosystems, and future predictions, and attempt to answer the question that investors are most concerned about:
"Which is the better buy right now?"
I. Price History Comparison and Current Market Status
FEAR (Coin A) and DOT (Coin B) Historical Price Trends
- 2021: DOT reached its all-time high of $54.98 on November 4, 2021, during the bull market.
- 2025: FEAR hit its all-time low of $0.00267373 on November 30, 2025, showing a significant decline.
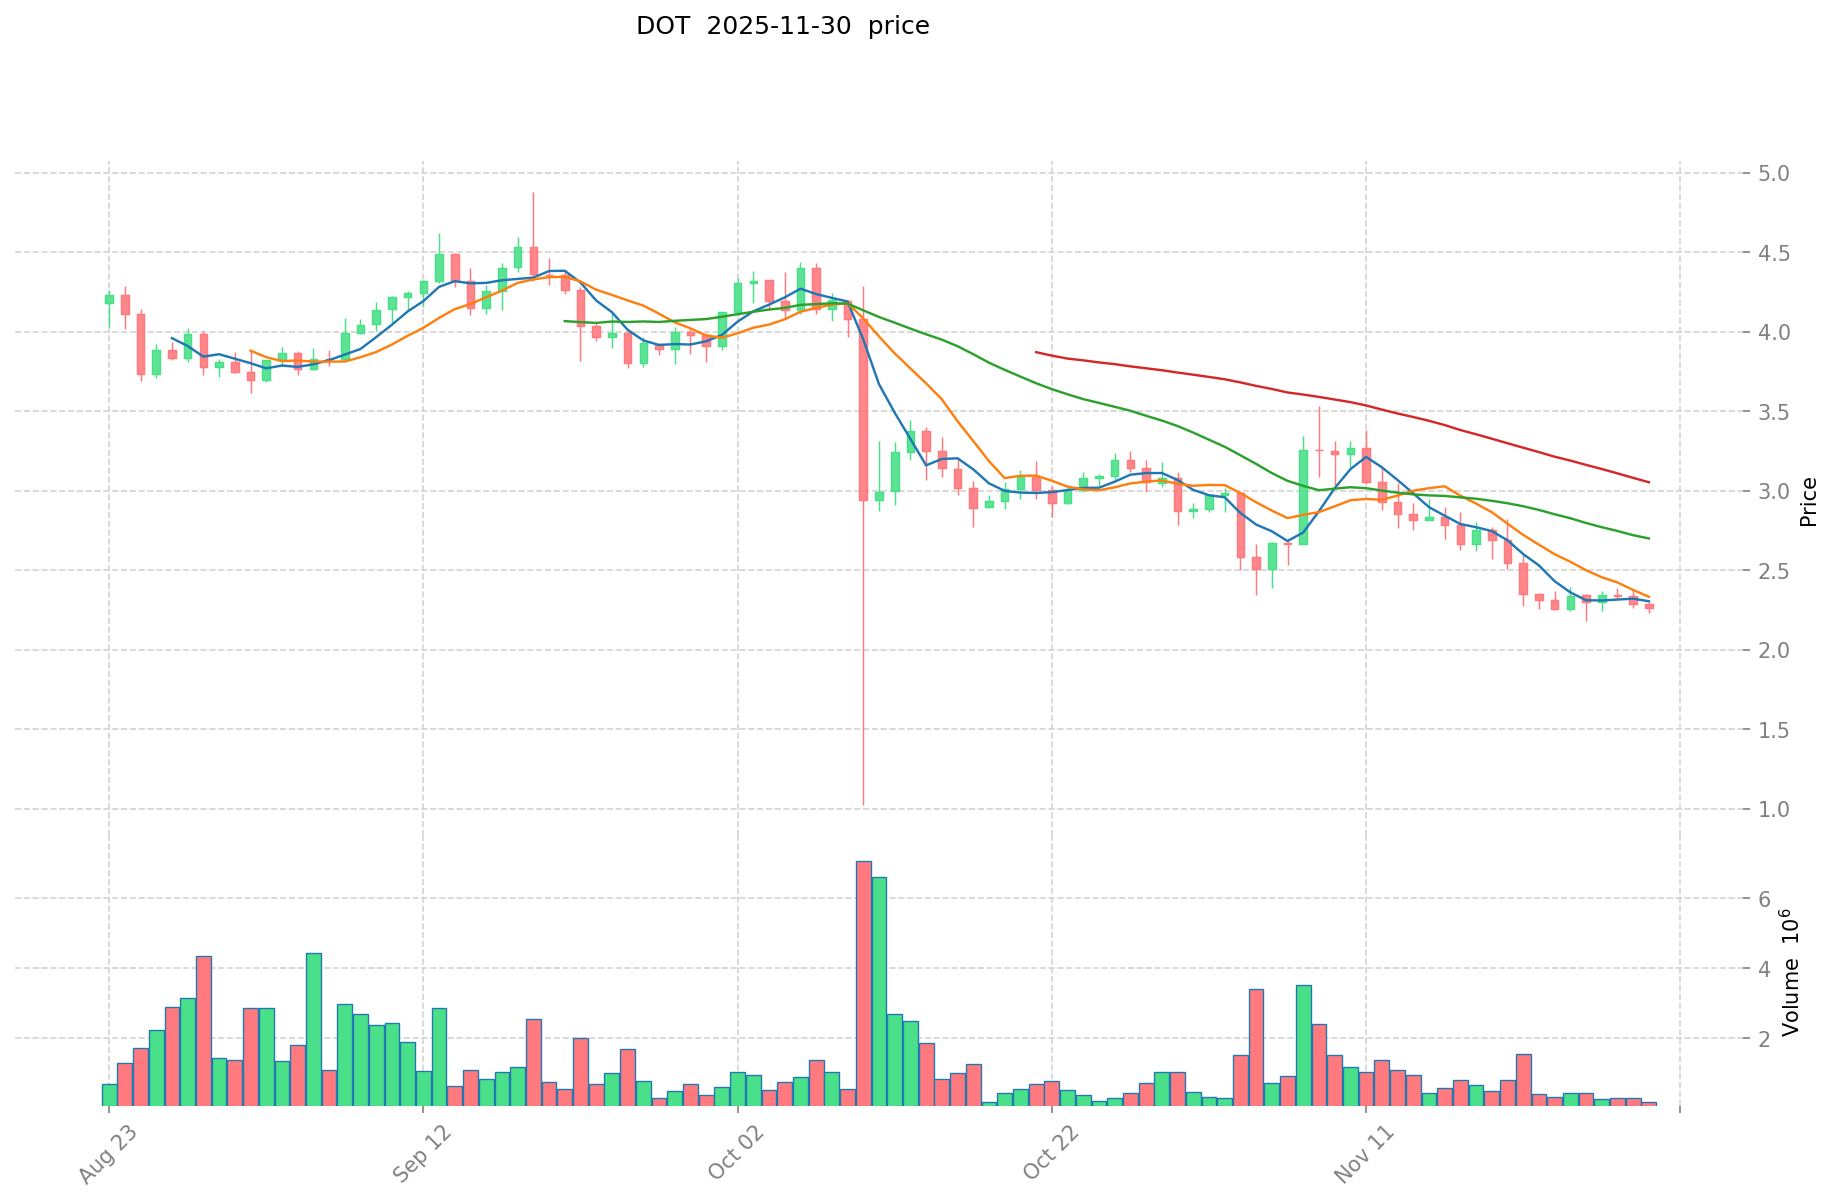
- Comparative analysis: In the current market cycle, FEAR has dropped from its all-time high of $3.88 to a low of $0.002746, while DOT has fallen from $54.98 to $2.268.
Current Market Situation (2025-11-30)
- FEAR current price: $0.002746
- DOT current price: $2.268
- 24-hour trading volume: FEAR $12,824.36 vs DOT $296,446.02
- Market Sentiment Index (Fear & Greed Index): 28 (Fear)
Click to view real-time prices:
- Check FEAR current price Market Price
- Check DOT current price Market Price

II. Core Factors Influencing FEAR vs DOT Investment Value
Supply Mechanism Comparison (Tokenomics)
- FEAR: Total supply of 1,000,000,000 FEAR tokens
- DOT: Inflationary model with minimum inflation of 10% annually, targeting 50% staking participation
Institutional Adoption and Market Applications
- Institutional Holdings: DOT has more significant institutional interest, being listed on major exchanges and gaining attention from venture capital firms
- Enterprise Adoption: DOT has wider adoption through its parachain ecosystem, with major projects building on Polkadot infrastructure
- Regulatory Attitudes: Both tokens face regulatory uncertainty in various jurisdictions
Technical Development and Ecosystem Building
- FEAR Technical Development: Gaming platform with NFT marketplace and horror game ecosystem
- DOT Technical Development: Cross-chain interoperability protocol enabling different blockchains to connect and share information securely
- Ecosystem Comparison: DOT has a more diverse ecosystem with numerous parachains, DeFi applications, and cross-chain solutions; FEAR focuses specifically on the gaming and NFT niche within the horror genre
Macroeconomic Factors and Market Cycles
- Inflation Performance: DOT has more established tokenomics and wider adoption, potentially providing better long-term stability
- Monetary Policy Impact: Both tokens are affected by broader crypto market sentiment, which correlates with global liquidity conditions
- Geopolitical Factors: DOT's cross-chain capabilities may provide better resilience to regional restrictions
III. 2025-2030 Price Prediction: FEAR vs DOT
Short-term Prediction (2025)
- FEAR: Conservative $0.00226 - $0.00276 | Optimistic $0.00276 - $0.00355
- DOT: Conservative $1.61 - $2.27 | Optimistic $2.27 - $3.34
Mid-term Prediction (2027)
- FEAR may enter a growth phase, with an estimated price range of $0.00318 - $0.00387
- DOT may enter a bullish market, with an estimated price range of $2.07 - $3.67
- Key drivers: Institutional investment, ETF developments, ecosystem growth
Long-term Prediction (2030)
- FEAR: Base scenario $0.00392 - $0.00466 | Optimistic scenario $0.00466 - $0.00648
- DOT: Base scenario $2.08 - $3.93 | Optimistic scenario $3.93 - $4.92
Disclaimer
FEAR:
| 年份 | 预测最高价 | 预测平均价格 | 预测最低价 | 涨跌幅 |
|---|---|---|---|---|
| 2025 | 0.00355395 | 0.002755 | 0.0022591 | 0 |
| 2026 | 0.003406833 | 0.003154475 | 0.002397401 | 14 |
| 2027 | 0.00387117172 | 0.003280654 | 0.00318223438 | 19 |
| 2028 | 0.0052208327756 | 0.00357591286 | 0.0027176937736 | 30 |
| 2029 | 0.004926177555936 | 0.0043983728178 | 0.00329877961335 | 60 |
| 2030 | 0.006480562509746 | 0.004662275186868 | 0.003916311156969 | 69 |
DOT:
| 年份 | 预测最高价 | 预测平均价格 | 预测最低价 | 涨跌幅 |
|---|---|---|---|---|
| 2025 | 3.34278 | 2.274 | 1.61454 | 0 |
| 2026 | 3.9879138 | 2.80839 | 1.6007823 | 23 |
| 2027 | 3.670004052 | 3.3981519 | 2.072872659 | 49 |
| 2028 | 3.92282655336 | 3.534077976 | 2.33249146416 | 55 |
| 2029 | 4.1385820137948 | 3.72845226468 | 3.0946153796844 | 64 |
| 2030 | 4.91689642404675 | 3.9335171392374 | 2.084764083795822 | 73 |
IV. Investment Strategy Comparison: FEAR vs DOT
Long-term vs Short-term Investment Strategy
- FEAR: Suitable for investors interested in gaming and NFT ecosystems, with a focus on niche horror content
- DOT: Suitable for investors looking for cross-chain interoperability and broader blockchain ecosystem exposure
Risk Management and Asset Allocation
- Conservative investors: FEAR: 5% vs DOT: 95%
- Aggressive investors: FEAR: 20% vs DOT: 80%
- Hedging tools: Stablecoin allocation, options, cross-currency portfolios
V. Potential Risk Comparison
Market Risk
- FEAR: High volatility due to niche market and lower trading volume
- DOT: Exposed to overall cryptocurrency market sentiment and competition from other interoperability solutions
Technical Risk
- FEAR: Platform stability, user adoption of gaming ecosystem
- DOT: Parachain auction dynamics, network congestion during high activity periods
Regulatory Risk
- Global regulatory policies may have a more significant impact on DOT due to its wider adoption and use cases, while FEAR might face specific regulations related to gaming and NFTs
VI. Conclusion: Which Is the Better Buy?
📌 Investment Value Summary:
- FEAR advantages: Unique positioning in horror gaming and NFT market, potential for growth in a specific niche
- DOT advantages: Established ecosystem, strong institutional interest, cross-chain interoperability solution
✅ Investment Advice:
- New investors: Consider allocating a small portion to DOT for exposure to the broader blockchain ecosystem
- Experienced investors: Balanced approach with a larger allocation to DOT and a smaller speculative position in FEAR
- Institutional investors: Focus on DOT for its established market position and potential for long-term growth in the interoperability sector
⚠️ Risk Warning: The cryptocurrency market is highly volatile, and this article does not constitute investment advice. None
VII. FAQ
Q1: What are the main differences between FEAR and DOT? A: FEAR is a mixed NFT token and blockchain game horror brand, while DOT is a network that connects various blockchain ecosystems. DOT has a higher market cap, trading volume, and broader institutional adoption compared to FEAR.
Q2: Which token has performed better historically? A: DOT has shown better historical performance, reaching an all-time high of $54.98 in November 2021. FEAR, on the other hand, hit its all-time low of $0.00267373 in November 2025, showing a significant decline from its peak.
Q3: How do the supply mechanisms of FEAR and DOT differ? A: FEAR has a total supply of 1,000,000,000 tokens, while DOT has an inflationary model with a minimum inflation of 10% annually, targeting 50% staking participation.
Q4: What are the key factors influencing the investment value of FEAR and DOT? A: Key factors include institutional adoption, enterprise applications, regulatory attitudes, technical development, ecosystem building, and macroeconomic factors such as inflation performance and monetary policy impact.
Q5: What are the price predictions for FEAR and DOT in 2030? A: For FEAR, the base scenario predicts $0.00392 - $0.00466, with an optimistic scenario of $0.00466 - $0.00648. For DOT, the base scenario predicts $2.08 - $3.93, with an optimistic scenario of $3.93 - $4.92.
Q6: How should investors allocate their portfolio between FEAR and DOT? A: Conservative investors might consider allocating 5% to FEAR and 95% to DOT, while aggressive investors might allocate 20% to FEAR and 80% to DOT. However, individual allocations should be based on personal risk tolerance and investment goals.
Q7: What are the potential risks associated with investing in FEAR and DOT? A: Risks include market volatility, technical challenges such as platform stability and network congestion, and regulatory uncertainties. FEAR faces higher volatility due to its niche market, while DOT is more exposed to overall cryptocurrency market sentiment.
Share
Content
Introduction: FEAR vs DOT Investment Comparison
I. Price History Comparison and Current Market Status
II. Core Factors Influencing FEAR vs DOT Investment Value
III. 2025-2030 Price Prediction: FEAR vs DOT
IV. Investment Strategy Comparison: FEAR vs DOT
V. Potential Risk Comparison
VI. Conclusion: Which Is the Better Buy?
VII. FAQ
How to Buy Cryptocurrency


Trending Cryptocurrencies


LIKE vs FLOW: Unleashing the Power of Authentic Engagement in Social Media Marketing

Is Metan Chain (METAN) a good investment?: Analyzing the potential and risks of this emerging cryptocurrency

Is Babylons (BABI) a good investment?: Analyzing the Potential and Risks of this Emerging Crypto Asset

Is Flow (FLOW) a good investment?: Analyzing the potential and risks of this blockchain platform for smart contracts

SFUND vs DOT: Comparing Investment Opportunities in the Blockchain Ecosystem

2025 GAMESTARTER Price Prediction: Analyzing Market Trends and Growth Potential for the Gaming Token

Samsung Q4 Profit Jumps 160 Percent, How the AI Chip Boom Is Reshaping Markets

How to Find My BNB Smart Chain Address

What Is Official Platform Verification Tool?

Copper Hits Record Above $13,000, What the US Import Rush Means for Traders

Understanding Profit and Loss (PnL) – Evaluating Your Financial Health