GM vs KAVA: The Battle of Coffee Giants Shaking Up the Morning Routine Market


Introduction: GM vs KAVA Investment Comparison
In the cryptocurrency market, the comparison between Gomble (GM) and Kava (KAVA) remains an unavoidable topic for investors. The two not only differ significantly in market cap ranking, application scenarios, and price performance but also represent different positioning in the crypto asset landscape.
Gomble (GM): Launched as a Web3 gaming ecosystem from the creators of 111%, a mobile gaming powerhouse with over 110 million players.
Kava (KAVA): Introduced in 2019 as a cross-chain decentralized financial platform providing mainstream digital asset lending and stablecoin services.
This article will comprehensively analyze the investment value comparison between GM and KAVA, focusing on historical price trends, supply mechanisms, institutional adoption, technical ecosystems, and future predictions, attempting to answer the question investors care about most:
"Which is the better buy right now?"
I. Price History Comparison and Current Market Status
GM (Coin A) and KAVA (Coin B) Historical Price Trends
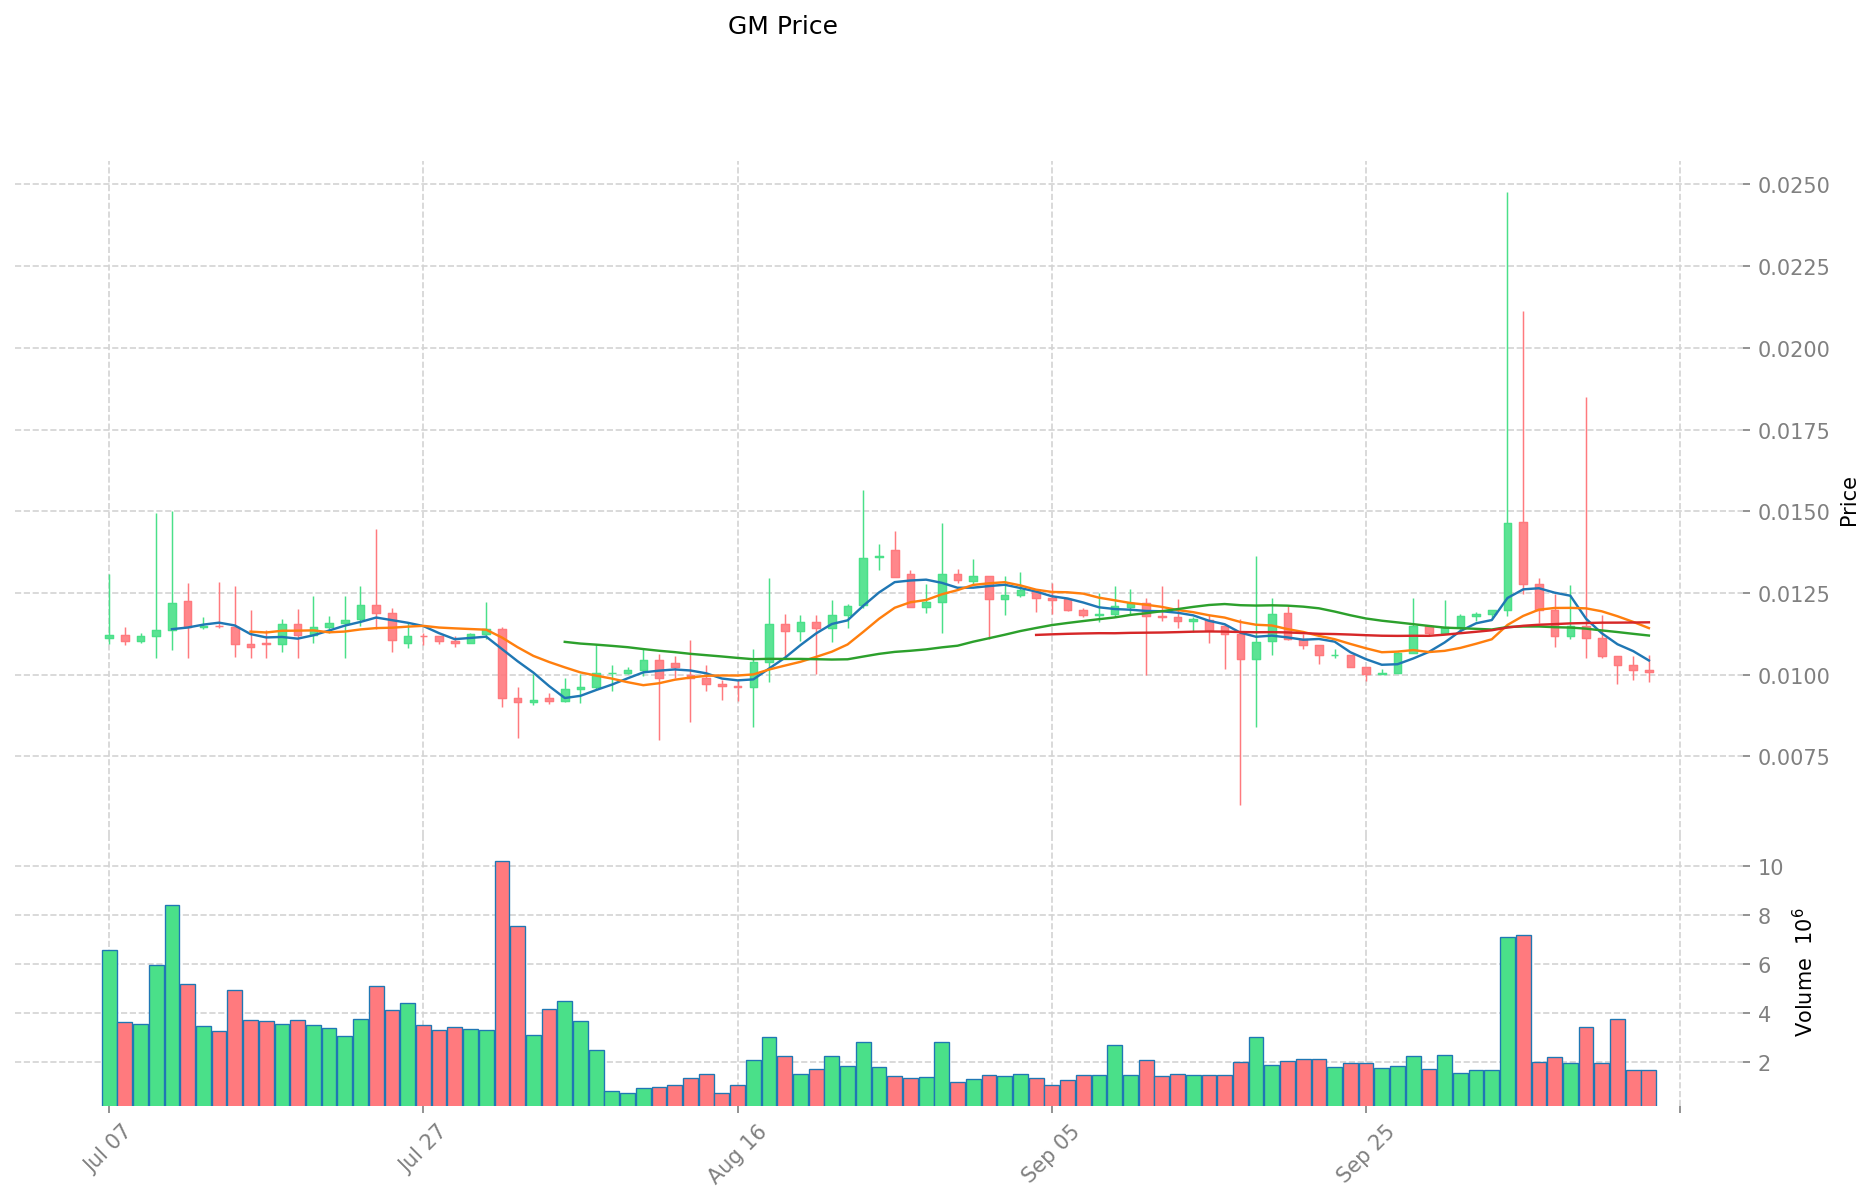
- 2025: GM reached its all-time high of $0.063288 on May 5, 2025, and its all-time low of $0.006004 on September 17, 2025, showing significant volatility.
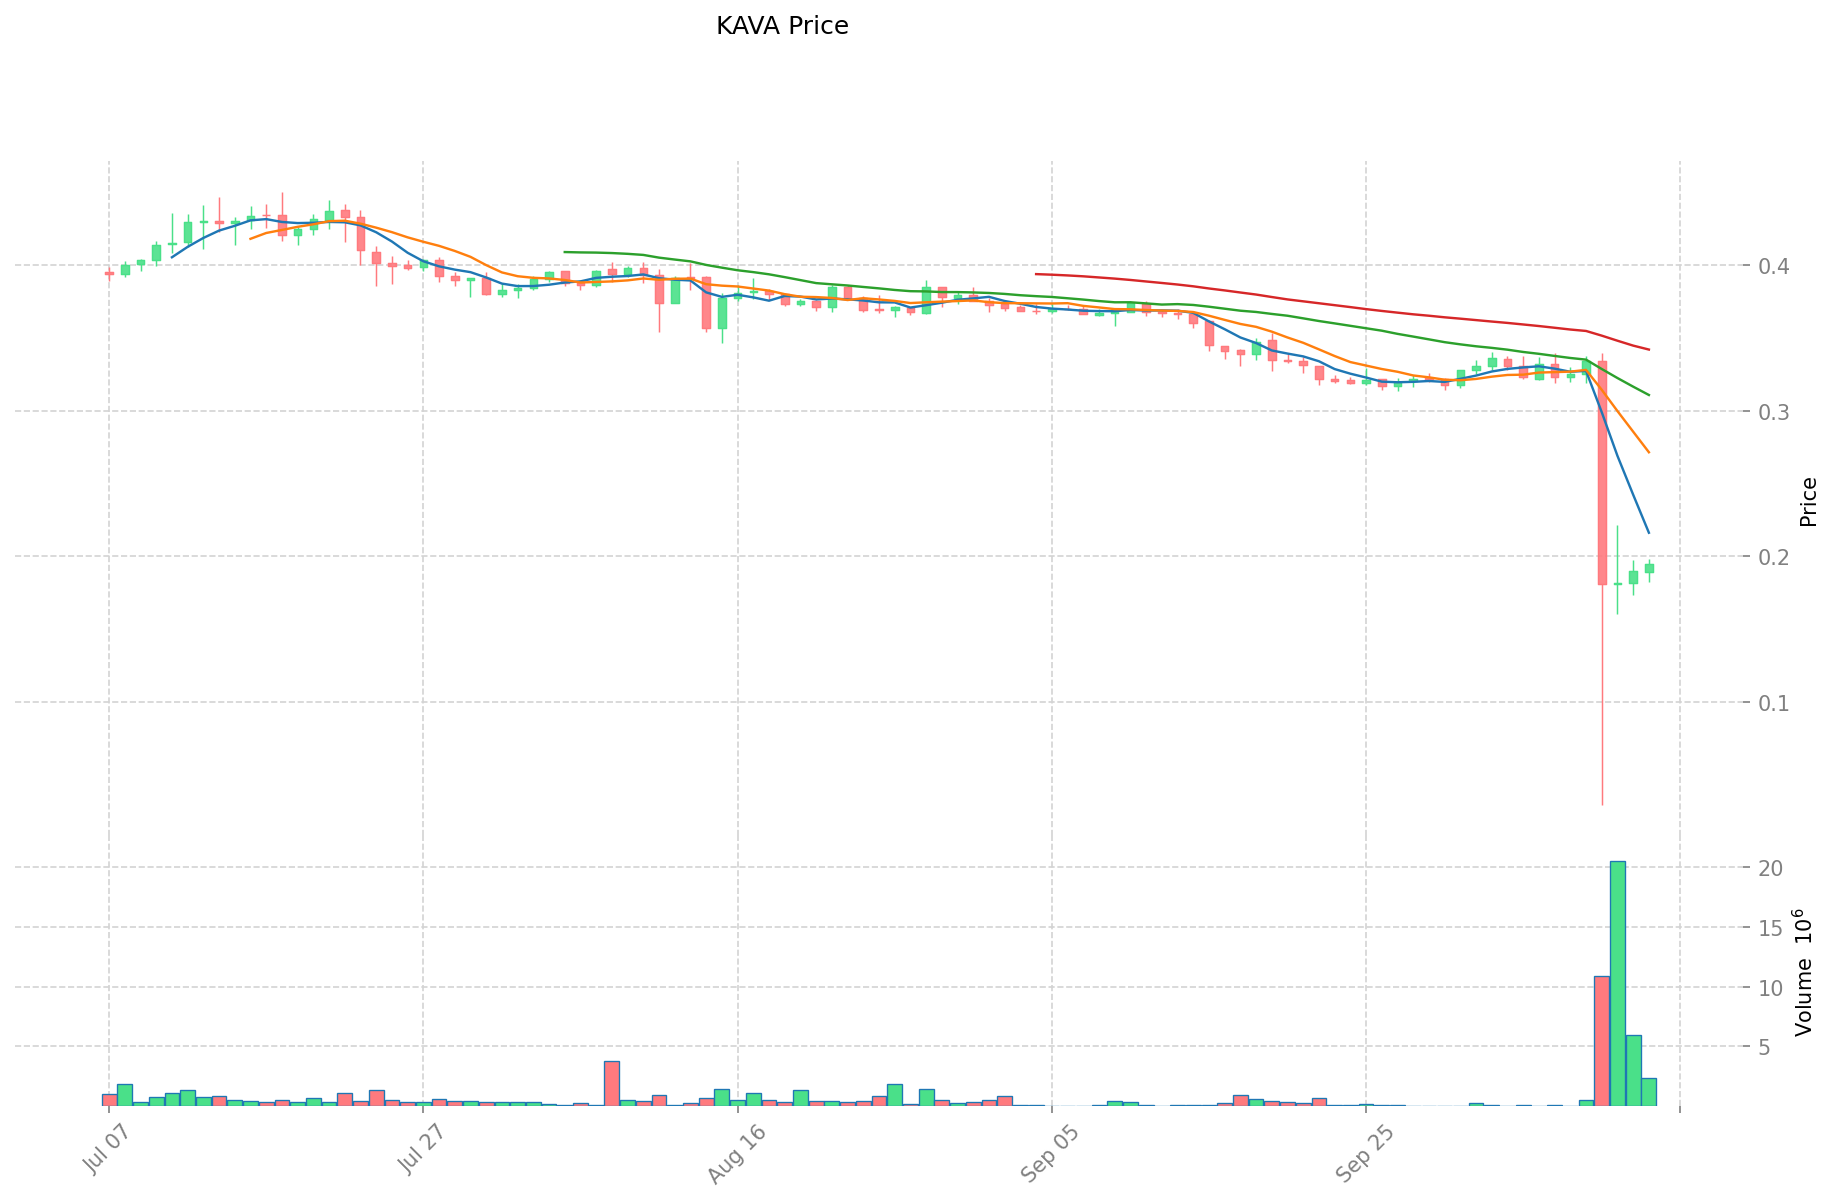
- 2021: KAVA reached its all-time high of $9.12 on August 30, 2021, demonstrating strong growth during the bull market.
- Comparative Analysis: In the recent market cycle, GM has experienced a significant drop from its high point to its current price of $0.010066, while KAVA has also seen a substantial decrease from its all-time high to the current price of $0.1926.
Current Market Situation (2025-10-14)
- GM current price: $0.010066
- KAVA current price: $0.1926
- 24-hour trading volume: GM $17,351.56 vs KAVA $446,326.57
- Market Sentiment Index (Fear & Greed Index): 38 (Fear)
Click to view real-time prices:
- View GM current price Market Price
- View KAVA current price Market Price
II. Core Factors Affecting Investment Value of GM vs KAVA
Supply Mechanism Comparison (Tokenomics)
- GM: A complex tokenomics system with unique minting mechanisms through trading volumes
- KAVA: Utilizes a staking model with validator rewards and an inflation schedule
- 📌 Historical pattern: Supply mechanisms create distinct price cycles, with GM showing more volatility driven by trading activity and KAVA demonstrating more stability due to staking incentives.
Institutional Adoption and Market Applications
- Institutional holdings: KAVA has gained more institutional traction with its cross-chain infrastructure focus
- Enterprise adoption: KAVA offers more enterprise-friendly solutions with its Cosmos-based interoperability, while GM focuses primarily on retail trading applications
- Regulatory stance: KAVA benefits from clearer regulatory positioning as an infrastructure project, while GM faces more scrutiny as a trading-centric token
Technical Development and Ecosystem Building
- GM technical upgrades: Recent implementation of trading incentives and liquidity mining programs
- KAVA technical development: Ongoing expansion of cross-chain capabilities and validator infrastructure
- Ecosystem comparison: KAVA has a more diverse ecosystem spanning DeFi lending, staking, and cross-chain applications, while GM remains primarily focused on trading incentives
Macroeconomic and Market Cycles
- Performance during inflation: KAVA shows stronger inflation resistance due to staking yields and utility value
- Macroeconomic monetary policy: Interest rates and USD strength impact both tokens, with KAVA showing more resilience during tightening cycles
- Geopolitical factors: KAVA's cross-chain infrastructure positions it better for cross-border transaction demands
III. 2025-2030 Price Prediction: GM vs KAVA
Short-term Prediction (2025)
- GM: Conservative $0.00624216 - $0.010068 | Optimistic $0.010068 - $0.01218228
- KAVA: Conservative $0.104274 - $0.1931 | Optimistic $0.1931 - $0.225927
Mid-term Prediction (2027)
- GM may enter a growth phase, with an expected price range of $0.006751847466 - $0.015357143256
- KAVA may enter a steady growth phase, with an expected price range of $0.130736424 - $0.2462202652
- Key drivers: Institutional capital inflow, ETF, ecosystem development
Long-term Prediction (2030)
- GM: Base scenario $0.012456443673273 - $0.020760739455456 | Optimistic scenario $0.020760739455456 - $0.025120494741101
- KAVA: Base scenario $0.231532703435124 - $0.32157319921545 | Optimistic scenario $0.32157319921545 - $0.398750767027158
Disclaimer
GM:
| 年份 | 预测最高价 | 预测平均价格 | 预测最低价 | 涨跌幅 |
|---|---|---|---|---|
| 2025 | 0.01218228 | 0.010068 | 0.00624216 | 0 |
| 2026 | 0.0153526932 | 0.01112514 | 0.010568883 | 10 |
| 2027 | 0.015357143256 | 0.0132389166 | 0.006751847466 | 31 |
| 2028 | 0.02030320249776 | 0.014298029928 | 0.01344014813232 | 42 |
| 2029 | 0.024220862698032 | 0.01730061621288 | 0.014532517618819 | 71 |
| 2030 | 0.025120494741101 | 0.020760739455456 | 0.012456443673273 | 106 |
KAVA:
| 年份 | 预测最高价 | 预测平均价格 | 预测最低价 | 涨跌幅 |
|---|---|---|---|---|
| 2025 | 0.225927 | 0.1931 | 0.104274 | 0 |
| 2026 | 0.22627458 | 0.2095135 | 0.123612965 | 8 |
| 2027 | 0.2462202652 | 0.21789404 | 0.130736424 | 13 |
| 2028 | 0.327200585166 | 0.2320571526 | 0.204210294288 | 20 |
| 2029 | 0.3635175295479 | 0.279628868883 | 0.19014763084044 | 45 |
| 2030 | 0.398750767027158 | 0.32157319921545 | 0.231532703435124 | 66 |
IV. Investment Strategy Comparison: GM vs KAVA
Long-term vs Short-term Investment Strategy
- GM: Suitable for investors focused on trading ecosystems and potential growth in gaming-related cryptocurrencies
- KAVA: Suitable for investors seeking cross-chain infrastructure exposure and DeFi yield opportunities
Risk Management and Asset Allocation
- Conservative investors: GM: 20% vs KAVA: 80%
- Aggressive investors: GM: 40% vs KAVA: 60%
- Hedging tools: Stablecoin allocation, options, cross-currency portfolio
V. Potential Risk Comparison
Market Risk
- GM: High volatility due to trading-centric model and gaming sector fluctuations
- KAVA: Exposed to broader DeFi market trends and cross-chain adoption rates
Technical Risk
- GM: Scalability, network stability during high trading volumes
- KAVA: Validator security, cross-chain bridge vulnerabilities
Regulatory Risk
- Global regulatory policies may have different impacts on both tokens, with KAVA potentially facing less scrutiny due to its infrastructure focus
VI. Conclusion: Which Is the Better Buy?
📌 Investment Value Summary:
- GM advantages: Potential for high growth in gaming and trading ecosystems, unique tokenomics model
- KAVA advantages: Strong cross-chain infrastructure, established DeFi applications, institutional adoption
✅ Investment Advice:
- New investors: Consider a higher allocation to KAVA for its more established ecosystem and lower volatility
- Experienced investors: Balanced approach with both GM and KAVA, leveraging GM for potential high returns and KAVA for stability
- Institutional investors: Focus on KAVA for its cross-chain infrastructure potential and regulatory clarity
⚠️ Risk Warning: The cryptocurrency market is highly volatile, and this article does not constitute investment advice. None
VII. FAQ
Q1: What are the main differences between GM and KAVA? A: GM is a Web3 gaming ecosystem token focusing on trading incentives, while KAVA is a cross-chain decentralized financial platform offering lending and stablecoin services. GM has higher volatility and is more trading-centric, while KAVA has a more established ecosystem with cross-chain infrastructure.
Q2: Which token has shown better price performance historically? A: KAVA reached its all-time high of $9.12 in August 2021, demonstrating strong growth during the bull market. GM, being newer, reached its all-time high of $0.063288 in May 2025. Both have seen significant decreases from their peaks, with KAVA showing more historical price stability.
Q3: How do the supply mechanisms differ between GM and KAVA? A: GM has a complex tokenomics system with unique minting mechanisms through trading volumes, leading to higher volatility. KAVA utilizes a staking model with validator rewards and an inflation schedule, contributing to more price stability.
Q4: Which token is more suitable for institutional investors? A: KAVA is generally more suitable for institutional investors due to its stronger institutional adoption, cross-chain infrastructure focus, and clearer regulatory positioning as an infrastructure project.
Q5: What are the long-term price predictions for GM and KAVA by 2030? A: For GM, the base scenario predicts a range of $0.012456443673273 - $0.020760739455456, with an optimistic scenario of up to $0.025120494741101. For KAVA, the base scenario predicts $0.231532703435124 - $0.32157319921545, with an optimistic scenario up to $0.398750767027158.
Q6: How should investors allocate their portfolio between GM and KAVA? A: Conservative investors might consider allocating 20% to GM and 80% to KAVA, while aggressive investors might opt for 40% GM and 60% KAVA. The allocation depends on individual risk tolerance and investment goals.
Q7: What are the main risks associated with investing in GM and KAVA? A: GM faces high volatility risks due to its trading-centric model and gaming sector fluctuations. KAVA is exposed to broader DeFi market trends and cross-chain adoption rates. Both face technical risks, with GM concerned about scalability and network stability, while KAVA needs to manage validator security and cross-chain bridge vulnerabilities.
Share
Content
Introduction: GM vs KAVA Investment Comparison
I. Price History Comparison and Current Market Status
II. Core Factors Affecting Investment Value of GM vs KAVA
III. 2025-2030 Price Prediction: GM vs KAVA
IV. Investment Strategy Comparison: GM vs KAVA
V. Potential Risk Comparison
VI. Conclusion: Which Is the Better Buy?
VII. FAQ
How to Buy Cryptocurrency


Trending Cryptocurrencies


Bitcoin Cash Price Analysis: BCH Market Trends and Trading Strategies for 2025
Bitget Token Price 2025: Investment Analysis and Market Performance

Avalanche (AVAX) 2025 Price Analysis and Market Trends
Ethereum to AUD: What Australian Traders Need to Know in 2025

FTT Explained
Chainlink Price Analysis: From $0.11 to $54.40 - Analyzing LINK's Path to 2030 Market Cap
What is APM coin and why is its price down 4.50% today?

What is XVG's regulatory compliance risk and why does it matter for crypto investors?

Liquidation

GPU (Graphics Processing Unit)

Crypto Phishing Losses Fell 83% in 2025: What the Scam Sniffer Report Reveals Risks Rise in Active Markets