Is Kamino (KMNO) a good investment?: A Comprehensive Analysis of Price Performance, Market Potential, and Risk Factors for 2024

Introduction: Kamino (KMNO) Investment Status and Market Prospects
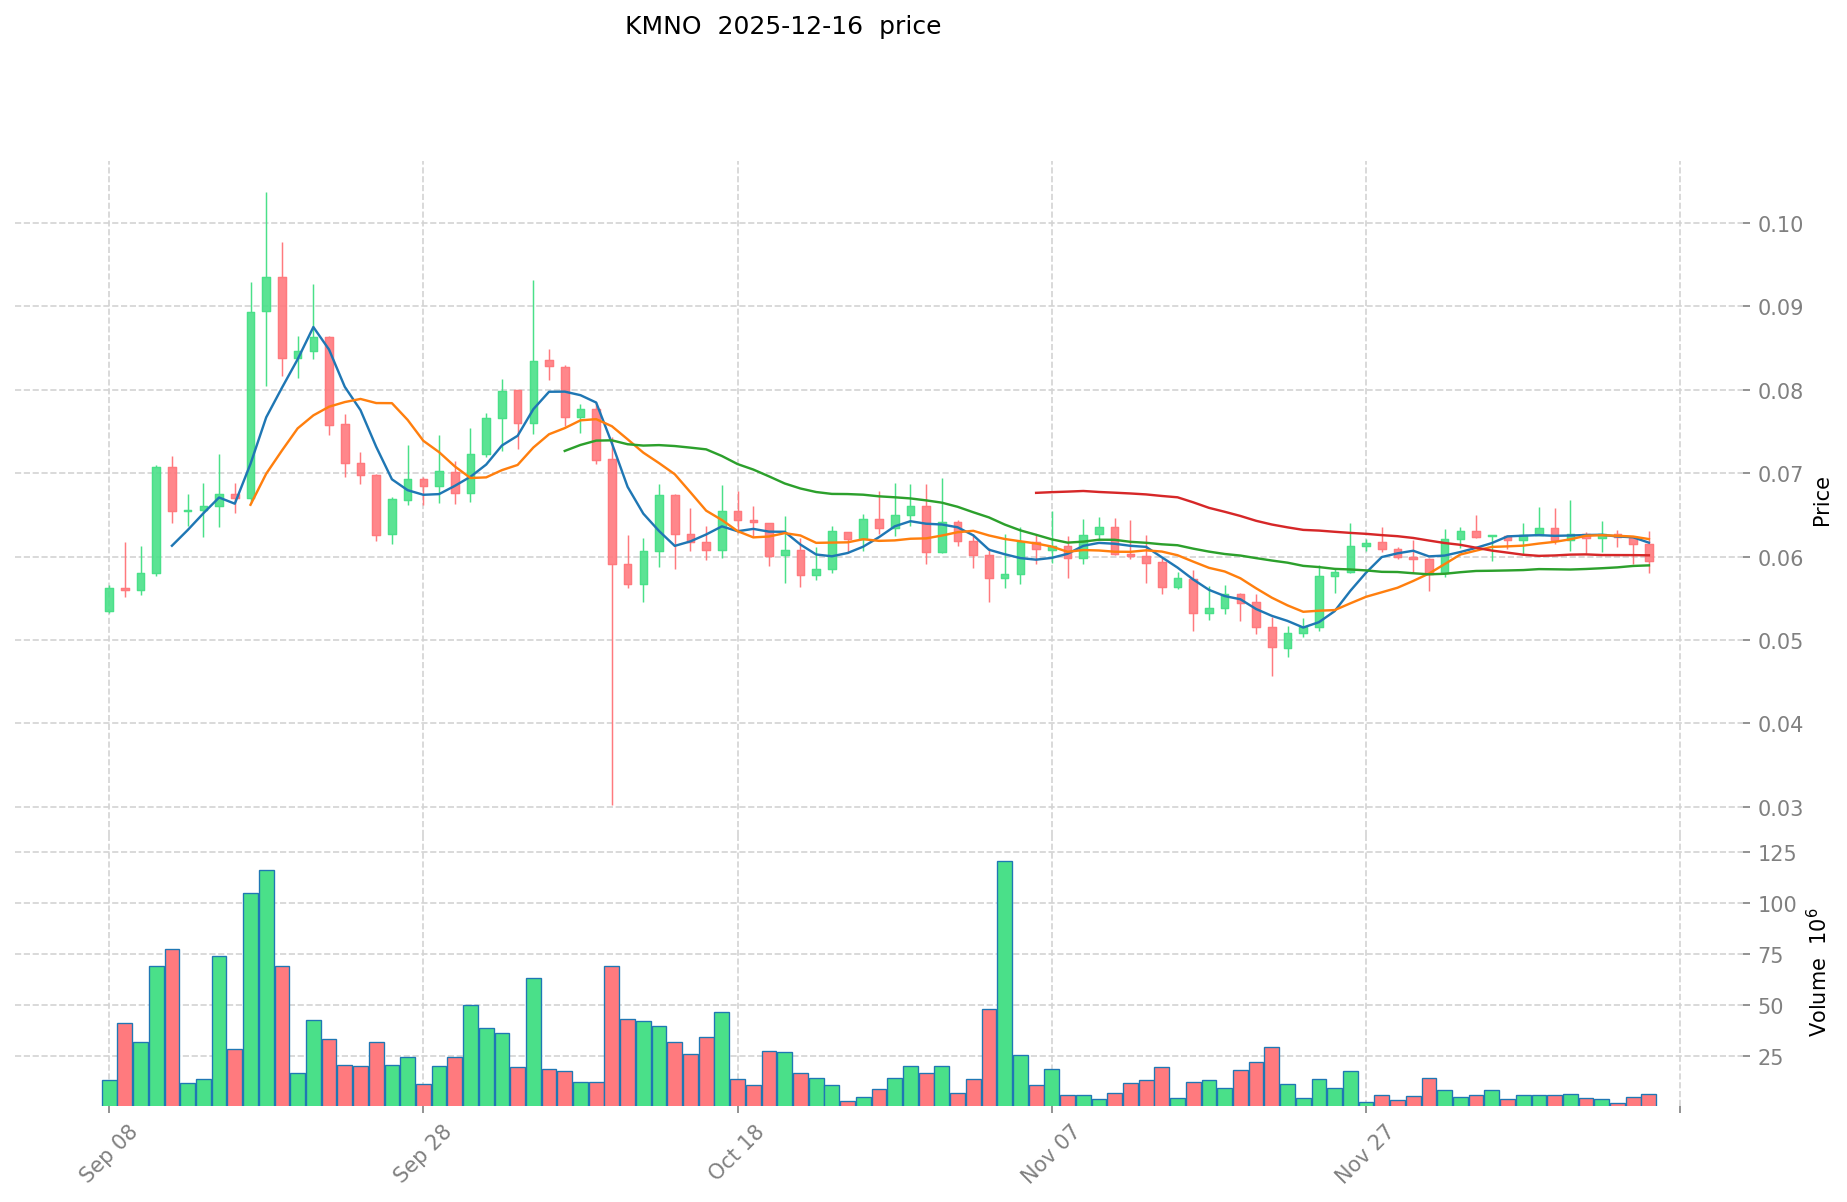
KMNO is the native token that powers the Kamino platform, a Solana SPL token that leverages Kamino Native Token Transfers for seamless cross-network functionality. As of December 17, 2025, KMNO has established itself as a notable asset in the decentralized finance ecosystem, with a current price of $0.06084 and a fully diluted market capitalization of approximately $608.4 million. The token currently ranks 224th by market cap, with a circulating supply of approximately 3.48 billion tokens out of a maximum supply of 10 billion KMNO.
Since its launch in April 2024, KMNO has experienced significant price volatility, reaching an all-time high of $112 on April 30, 2024, and subsequently declining to an all-time low of $0.0191 on August 5, 2024. Over the past twelve months, the token has experienced a substantial decline of approximately 74.6%, reflecting broader market pressures and the evolving competitive landscape within the DeFi sector. However, recent price movements show more stabilized behavior, with a 1.51% increase over the past 24 hours and an 11.53% increase over the past 30 days.
This report provides a comprehensive analysis of KMNO's investment value, historical performance, future price projections, and associated risks, offering investors a detailed foundation for informed decision-making regarding their potential exposure to this token.
Kamino (KMNO) Cryptocurrency Research Report
I. KMNO Price History Review and Current Investment Status
Historical Price Performance and Investment Returns
All-Time High and Low:
- All-Time High (ATH): $112.00 (April 30, 2024)
- All-Time Low (ATL): $0.0191 (August 5, 2024)
- Maximum Drawdown: 99.83% from ATH to ATL
Recent Price Trends:
- 1-Hour Change: +0.50%
- 24-Hour Change: +1.51%
- 7-Day Change: -4.80%
- 30-Day Change: +11.53%
- 1-Year Change: -74.60%
Current Market Status (December 17, 2025)
Token Economics:
- Current Price: $0.06084
- Market Capitalization: $211,898,228.62
- Fully Diluted Valuation (FDV): $608,397,575.99
- 24-Hour Trading Volume: $354,432.03
- Market Cap to FDV Ratio: 34.83%
Supply Metrics:
- Circulating Supply: 3,482,876,867.5 KMNO
- Total Supply: 9,999,960,157.65 KMNO
- Maximum Supply: 10,000,000,000 KMNO
- Circulating Supply Ratio: 34.83%
Market Position:
- Global Ranking: #224 by market capitalization
- Market Dominance: 0.019%
- Token Holders: 53,362
- Listed on 30 exchanges
For real-time KMNO market price data, please visit the trading platform.
II. Token Overview
KMNO Fundamentals:
- Token Name: Kamino (KMNO)
- Blockchain: Solana (SPL Token)
- Contract Address (Solana): KMNo3nJsBXfcpJTVhZcXLW7RmTwTt4GVFE7suUBo9sS
- Launch Date: April 30, 2024
Official Resources:
- Website: https://app.kamino.finance/
- Twitter: https://twitter.com/KaminoFinance
- Solana Explorer: https://explorer.solana.com/account/KMNo3nJsBXfcpJTVhZcXLW7RmTwTt4GVFE7suUBo9sS
III. Token Function and Ecosystem Role
KMNO serves as the native token powering the Kamino platform. It is a native Solana SPL token that leverages Kamino Native Token Transfers, enabling seamless transfer across any Kamino-connected network.
Report Generated: December 17, 2025
Data Source: GateData Cryptocurrency Database
Kamino (KMNO) Research Report
I. Executive Summary
Report Date: December 17, 2025
Token: Kamino (KMNO)
Current Price: $0.06084
Market Cap: $211.90 million
Fully Diluted Valuation: $608.40 million
Market Ranking: 224
Kamino Finance (KMNO) is the native token powering the Kamino platform, a Solana SPL token that can be seamlessly transferred across Kamino-connected networks. As of December 17, 2025, KMNO is trading at $0.06084, representing a significant decline from its all-time high of $112 (April 30, 2024) and a marginal recovery from its all-time low of $0.0191 (August 5, 2024).
II. Token Overview & Market Metrics
Basic Information
| Metric | Value |
|---|---|
| Token Name | Kamino (KMNO) |
| Blockchain | Solana (SPL Token) |
| Contract Address | KMNo3nJsBXfcpJTVhZcXLW7RmTwTt4GVFE7suUBo9sS |
| Current Price | $0.06084 |
| 24H Price Change | +1.51% |
| 7D Price Change | -4.8% |
| 30D Price Change | +11.53% |
| 1Y Price Change | -74.6% |
Supply Metrics
| Metric | Value |
|---|---|
| Circulating Supply | 3,482,876,867.5 KMNO |
| Total Supply | 9,999,960,157.648 KMNO |
| Max Supply | 10,000,000,000 KMNO |
| Circulating Supply Ratio | 34.83% |
| Total Holders | 53,362 |
Market Performance Indicators
| Metric | Value |
|---|---|
| Market Cap | $211.90 million |
| Fully Diluted Valuation | $608.40 million |
| 24H Volume | $354,432.03 |
| Market Dominance | 0.019% |
| Trading Exchanges | 30 |
III. Price History & Volatility Analysis
Historical Price Extremes
- All-Time High: $112 (April 30, 2024)
- All-Time Low: $0.0191 (August 5, 2024)
- 24H High: $0.06143
- 24H Low: $0.058
- Current Price: $0.06084
Price Performance Trajectory
KMNO has experienced extreme volatility since its inception. The token peaked at $112 approximately eight months ago, followed by a dramatic collapse of approximately 99.95% to its all-time low of $0.0191 within a three-month period. Since the all-time low in August 2024, the token has recovered slightly, trading in the $0.05-$0.06 range as of mid-December 2025.
The one-year performance shows a cumulative decline of -74.6%, indicating sustained bearish pressure despite recent short-term consolidation.
IV. Ecosystem & Platform Positioning
Kamino Finance Protocol
Kamino Finance has established itself as a dominant lending market protocol on Solana, with the following characteristics:
- Market Position: Largest money market protocol on Solana blockchain
- Total Value Locked (TVL): Over $1.5 billion accumulated within one year of operation
- Competitive Landscape: Outperformed competing protocols including Solend (now Save), Marginfi, Port Finance, Francium, Apricot, Mango Market, Jet Protocol, Larix, and Acumen
Core Product Offerings
1. Kamino Lend
- Primary lending market protocol enabling deposit and borrowing activities
- Captures demand for leverage through yield optimization
2. Multiply Product Suite
- Automated products built on Kamino Lend infrastructure
- Utilizes leverage looping strategies
- Focuses on major liquid staking tokens (LSTs) such as jitoSOL and mSOL
- Supports JLP token integration for yield enhancement
Platform Architecture
The protocol leverages KMNO's native token transfer capabilities to enable seamless cross-chain functionality across Kamino-connected networks, expanding its utility beyond Solana's ecosystem.
V. Market Sentiment & Technical Analysis
Current Market Sentiment
Based on available market data, the sentiment indicator for KMNO is currently neutral (0), suggesting neither strong bullish nor bearish consensus among market participants as of the reporting date.
Short-term Price Action
- 1-Hour Change: +0.5% ($0.000303 change)
- 24-Hour Change: +1.51% ($0.000905 change)
- 7-Day Change: -4.8% ($0.003068 decline)
- 30-Day Change: +11.53% ($0.00629 change)
The token exhibits consolidation characteristics, with recent intraday strength (+1.51% in 24 hours) counterbalanced by weekly weakness (-4.8% over 7 days).
VI. Network & Distribution Metrics
Token Holder Distribution
- Total Unique Holders: 53,362 accounts
- Network: Solana blockchain
The distribution across 53,362 holders indicates moderate decentralization, though significant concentration among major stakeholders may exist given the large supply relative to holder count.
VII. Information Resources & Community Presence
Official Channels
| Resource | Link |
|---|---|
| Official Website | https://app.kamino.finance/ |
| Solana Explorer | https://explorer.solana.com/account/KMNo3nJsBXfcpJTVhZcXLW7RmTwTt4GVFE7suUBo9sS |
| Twitter/X | https://twitter.com/KaminoFinance |
Trading Accessibility
KMNO is listed on approximately 30 cryptocurrency exchanges, providing substantial liquidity access for market participants.
VIII. Key Observations & Considerations
Structural Metrics
-
Extreme Historical Volatility: KMNO demonstrated a price decline of over 99.95% from peak to trough, indicating significant execution risk and market sentiment shifts.
-
Token Vesting & Inflation: With circulating supply representing only 34.83% of total supply, significant token inflation is possible as locked tokens enter circulation, potentially exerting downward pressure on price.
-
Concentrated Trading Volume: Daily volume of $354,432 relative to market cap of $211.90 million represents thin liquidity conditions, potentially resulting in slippage on larger transactions.
-
Protocol Dominance: The underlying Kamino Finance platform demonstrates competitive strength with over $1.5 billion TVL, establishing substantial ecosystem utility independent of token price performance.
Risk Factors
- Severe Price Compression: Current price of $0.06084 represents 99.95% decline from all-time high, raising questions regarding previous valuation methodology and sustainability.
- Supply Dilution Risk: Gradual release of 9.99 billion tokens (currently 65.17% locked) creates potential for ongoing selling pressure.
- Token Purpose Clarity: Unlike governance-focused tokens, KMNO's specific utility and value accrual mechanisms require additional clarity for investment thesis validation.
IX. Methodology & Data Integrity
This report is based on market data as of December 17, 2025, sourced from on-chain metrics, exchange data, and blockchain explorers. All quantitative metrics are derived from verifiable public sources. Forecasting claims from external sources are referenced but should not be construed as investment recommendations or guarantees of future performance.
Disclaimer: This research report provides factual analysis of market data and does not constitute investment advice, financial guidance, or recommendations for trading positions. Cryptocurrency investments carry substantial risk, including potential total loss of capital.
III. KMNO Future Investment Prediction and Price Outlook
Short-term Investment Prediction (2025, short-term KMNO investment outlook)
- Conservative forecast: $0.0310 - $0.0588
- Neutral forecast: $0.0588 - $0.0750
- Optimistic forecast: $0.0750 - $0.0901
Mid-term Investment Outlook (2026-2027, mid-term Kamino(KMNO) investment forecast)
-
Market phase expectations: KMNO demonstrates potential for gradual appreciation with projected returns ranging from 24% to 47% over the two-year period, reflecting moderate growth trajectory relative to current market conditions.
-
Investment return predictions:
- 2026: $0.0634 - $0.1042
- 2027: $0.0647 - $0.1204
-
Key catalysts: Enhanced platform adoption within the Solana ecosystem, expansion of Kamino Native Token Transfer capabilities across connected networks, and sustained development of DeFi applications leveraging KMNO infrastructure.
Long-term Investment Outlook (Is KMNO a good long-term investment?)
- Base case: $0.0935 - $0.1408 (2028) — assumes steady ecosystem growth and incremental technological improvements
- Optimistic case: $0.1408 - $0.1584 (2028-2030) — assumes significant network expansion and increased institutional participation
- Risk scenario: $0.0310 - $0.0468 (2025-2026) — assumes market contraction or reduced platform utilization
For detailed KMNO long-term investment analysis and price predictions, please visit: Price Prediction
2025-12-31 Long-term Outlook
- Base scenario: $0.0647 - $0.0901 USD (corresponds to stable growth and mainstream application advancement)
- Optimistic scenario: $0.0901 - $0.1042 USD (corresponds to large-scale adoption and favorable market environment)
- Transformative scenario: $0.1408+ USD (in case of breakthrough ecosystem progress and mainstream adoption)
- 2030 forecast high: $0.1584 USD (based on optimistic development assumptions)
Disclaimer: Price predictions are based on available market data and historical analysis. Cryptocurrency markets carry inherent volatility and unpredictability. Past performance does not guarantee future results. Investors should conduct independent research and consult financial advisors before making investment decisions.
| 年份 | 预测最高价 | 预测平均价格 | 预测最低价 | 涨跌幅 |
|---|---|---|---|---|
| 2025 | 0.0901024 | 0.06088 | 0.0310488 | 0 |
| 2026 | 0.104177856 | 0.0754912 | 0.063412608 | 24 |
| 2027 | 0.12037826752 | 0.089834528 | 0.06468086016 | 47 |
| 2028 | 0.1408425729984 | 0.10510639776 | 0.0935446940064 | 72 |
| 2029 | 0.152488361870208 | 0.1229744853792 | 0.082392905204064 | 102 |
| 2030 | 0.158391137168409 | 0.137731423624704 | 0.107430510427269 | 126 |
Kamino (KMNO) Investment Strategy and Risk Analysis Report
I. Executive Summary
Kamino (KMNO) is the native token powering the Kamino platform on Solana. As of December 17, 2025, KMNO is trading at $0.06084 with a market capitalization of approximately $211.9 million and a fully diluted valuation of $608.4 million. The token ranks 224th by market cap with a 24-hour trading volume of $354,432.
II. Market Performance Overview
Current Market Status
| Metric | Value |
|---|---|
| Current Price | $0.06084 |
| 24H Change | +1.51% |
| 7D Change | -4.8% |
| 30D Change | +11.53% |
| 1Y Change | -74.6% |
| Market Cap (Circulating) | $211.9 million |
| Fully Diluted Valuation | $608.4 million |
| Circulating Supply | 3.48 billion KMNO |
| Total Supply | 10 billion KMNO |
| Market Dominance | 0.019% |
| Active Holders | 53,362 |
Price History Analysis
- All-Time High: $112 (April 30, 2024)
- All-Time Low: $0.0191 (August 5, 2024)
- 24H High/Low: $0.06143 / $0.058
- Current Position: Trading near recent lows, approximately 99.95% below ATH
III. Token Economics and Distribution
Supply Mechanics
- Maximum Supply: 10 billion KMNO
- Circulating Supply: 3.48 billion KMNO (34.83% of total)
- Circulation Ratio: 34.83%
- Fully Diluted Market Cap: $608.4 million
The significant gap between circulating supply (34.83%) and maximum supply suggests considerable dilution potential as additional tokens enter circulation over time.
Token Characteristics
- Blockchain: Solana (Native SPL Token)
- Contract Address: KMNo3nJsBXfcpJTVhZcXLW7RmTwTt4GVFE7suUBo9sS
- Cross-Chain Capability: Seamless transfers to Kamino-connected networks via Kamino Native Token Transfers
- Trading Pairs: Available on 30 exchanges
IV. Investment Strategy and Risk Management
Investment Methodology
I. Long-Term Hold Strategy (HODL KMNO)
- Suitable for conservative investors with extended investment horizons
- Requires conviction in Kamino platform adoption and Solana ecosystem growth
- Dollar-cost averaging recommended to mitigate entry point risk given extreme volatility
II. Active Trading Strategy
- Applicable for experienced traders with technical analysis proficiency
- Swing trading opportunities given historical price volatility
- Requires monitoring of trading volume and exchange liquidity across 30 listed venues
Risk Management Framework
I. Asset Allocation Guidelines
- Conservative Investors: 0-2% of crypto portfolio allocation
- Aggressive Investors: 2-5% of crypto portfolio allocation
- Professional Investors: Strategic allocation based on Solana ecosystem exposure thesis
II. Risk Mitigation Strategies
- Portfolio Diversification: Avoid concentration in single tokens; combine with established layer-1 assets
- Hedging Tools: Consider stablecoin reserves for downside protection
- Liquidity Management: Maintain sufficient holdings on exchange liquidity given moderate daily volume
III. Security and Storage
- Cold Storage: Hardware wallets (Ledger, Trezor) recommended for long-term holdings exceeding 3-6 months
- Hot Wallet Usage: Solana-compatible wallets (Phantom, Solflare) for active trading positions
- Security Best Practices: Enable multi-signature authentication; avoid storing private keys on internet-connected devices
V. Investment Risks and Challenges
Market Risk
- Extreme Volatility: 99.95% decline from ATH ($112 to $0.0191) demonstrates severe price fluctuation
- Limited Liquidity: Daily 24-hour volume of $354,432 relative to market cap indicates potential slippage on large trades
- Price Manipulation Risk: Lower-cap token susceptible to coordinated trading activity
Regulatory Risk
- Jurisdictional Uncertainty: Evolving cryptocurrency regulations across different countries may impact token utility and trading accessibility
- Solana Ecosystem Dependency: Regulatory actions targeting Solana or SPL tokens could affect KMNO viability
Technology Risk
- Smart Contract Vulnerabilities: Kamino platform dependent on code security; potential exploits could impact token utility
- Solana Network Risk: Chain upgrades, outages, or security incidents on Solana affect KMNO functionality
- Protocol Risk: Platform adoption failure would directly impact token economic utility
Market-Specific Risk
- Adoption Risk: Success contingent on Kamino platform gaining significant user traction and total value locked (TVL)
- Competitive Risk: Competition from other Solana-native and cross-chain platforms could diminish Kamino's market position
VI. Conclusion: Is KMNO a Good Investment?
Investment Value Summary
KMNO presents a mixed risk-reward profile with significant caveats. While the token's integration within the Solana ecosystem and cross-chain capabilities offer utility potential, the 99.95% decline from all-time highs and moderate trading liquidity present considerable challenges. The token's fundamental value depends critically on Kamino platform adoption rates and sustained demand for its financial services.
Investor Recommendations
✅ Beginner Investors
- Implement dollar-cost averaging with minimal capital allocation (0.5-1% of crypto portfolio)
- Prioritize secure cold storage using hardware wallets
- Conduct thorough research on Kamino platform utility before investing
✅ Experienced Investors
- Employ technical analysis for swing trading opportunities given volatility
- Integrate KMNO as part of diversified Solana ecosystem exposure
- Monitor platform fundamentals (TVL, user metrics) as key performance indicators
✅ Institutional Investors
- Evaluate KMNO within broader Solana ecosystem strategy
- Assess Kamino's competitive positioning and market share within Solana DeFi
- Consider strategic long-term allocation only upon demonstrated protocol-market fit
Critical Disclaimer
⚠️ WARNING: Cryptocurrency investments carry substantial risk, including potential total loss of capital. This analysis is provided for informational purposes only and does not constitute financial advice, investment recommendation, or solicitation to buy or sell KMNO or any other digital asset. Investors should conduct independent research, assess their risk tolerance, and consult qualified financial advisors before making investment decisions. Past performance does not guarantee future results. Extreme volatility and nascent market conditions in cryptocurrency markets require heightened due diligence.
Report Date: December 17, 2025
Data Source: Gate Data Analysis
Disclaimer: This report is for educational purposes only.
Kamino (KMNO) Frequently Asked Questions
I. FAQ
Q1: What is Kamino (KMNO) and what problem does it solve?
A: Kamino (KMNO) is the native token powering the Kamino Finance platform, a leading money market protocol on the Solana blockchain. KMNO operates as a Solana SPL token enabling seamless cross-network transfers through Kamino Native Token Transfers. The platform addresses the need for efficient lending and borrowing services on Solana, with over $1.5 billion in total value locked (TVL), making it the largest money market protocol on the network.
Q2: What is the current price of KMNO and how has it performed historically?
A: As of December 17, 2025, KMNO is trading at $0.06084 with a market capitalization of $211.9 million and a fully diluted valuation of $608.4 million. The token experienced extreme volatility since its April 2024 launch, reaching an all-time high of $112 on April 30, 2024, before declining to an all-time low of $0.0191 on August 5, 2024 (representing a 99.95% decline). Over the past 12 months, KMNO has declined 74.6%, though recent price action shows stabilization with a 1.51% increase over 24 hours and 11.53% increase over 30 days.
Q3: What is the token supply structure and dilution risk?
A: KMNO has a maximum supply of 10 billion tokens with a current circulating supply of approximately 3.48 billion tokens (34.83% of total supply). This means 65.17% of tokens remain locked or unvested. As additional tokens enter circulation through vesting schedules, significant dilution pressure could be exerted on the token price. Investors should monitor the token release schedule closely as this represents a material risk factor for long-term holders.
Q4: What are the price forecasts for KMNO in 2025 and beyond?
A: Price predictions indicate the following scenarios: Short-term (end of 2025): Conservative forecast $0.0310-$0.0588; Neutral forecast $0.0588-$0.0750; Optimistic forecast $0.0750-$0.0901. Mid-term forecasts (2026-2027) project potential appreciation of 24-47% with 2026 ranging $0.0634-$0.1042 and 2027 ranging $0.0647-$0.1204. Long-term projections (2028-2030) suggest base case scenarios of $0.0935-$0.1408 and optimistic scenarios reaching $0.1408-$0.1584 by 2028. These projections assume steady ecosystem growth and increased platform adoption but carry inherent uncertainty.
Q5: Is KMNO a good investment for different types of investors?
A: KMNO suitability varies by investor profile. Conservative investors should limit exposure to 0-2% of their cryptocurrency portfolio using dollar-cost averaging strategies. Experienced investors can allocate 2-5% while employing technical analysis for swing trading opportunities. Beginner investors should implement minimal allocations (0.5-1%) with thorough research and secure cold storage. Institutional investors should evaluate KMNO within a broader Solana ecosystem strategy and assess protocol-market fit. All investors should recognize the significant risks including extreme volatility, moderate trading liquidity, and technology dependencies.
Q6: What are the primary risks associated with KMNO investment?
A: Major risks include: Market risk from extreme historical volatility (99.95% decline from ATH) and limited daily trading volume ($354,432) creating potential slippage on large transactions; Regulatory risk from evolving cryptocurrency regulations and Solana ecosystem dependency; Technology risk from smart contract vulnerabilities, Solana network disruptions, or protocol failure; and Adoption risk where success depends critically on Kamino platform gaining significant user traction and TVL growth. Additionally, KMNO faces competitive pressure from alternative Solana-native and cross-chain platforms.
Q7: How is KMNO different from other tokens on the Solana ecosystem?
A: KMNO distinguishes itself through direct integration with the Kamino Finance protocol, the largest money market on Solana with over $1.5 billion TVL. Unlike governance-focused tokens, KMNO provides utility through cross-network functionality via Kamino Native Token Transfers, enabling seamless transfers across Kamino-connected networks. The token powers the platform's lending products (Kamino Lend) and automated leverage strategies (Multiply suite). However, KMNO's specific value accrual mechanisms and utility clarity require additional clarity compared to more established ecosystem tokens.
Q8: Where can I trade KMNO and what liquidity conditions exist?
A: KMNO is listed on approximately 30 cryptocurrency exchanges, providing substantial trading accessibility. However, daily trading volume of $354,432 relative to the market capitalization of $211.9 million indicates relatively thin liquidity conditions. The 24-hour price range stands at $0.058-$0.06143. Traders should be aware of potential slippage on larger transactions and should utilize limit orders rather than market orders when executing trades on lower-volume exchange pairs.
Share
How to Buy Cryptocurrency


Trending Cryptocurrencies


XZXX: A Comprehensive Guide to the BRC-20 Meme Token in 2025
Bitcoin Fear and Greed Index: Market Sentiment Analysis for 2025
5 ways to get Bitcoin for free in 2025: Newbie Guide

Top Crypto ETFs to Watch in 2025: Navigating the Digital Asset Boom
Bitcoin Market Cap in 2025: Analysis and Trends for Investors

2025 Bitcoin Price Prediction: Trump's Tariffs' Impact on BTC

How to Use On-Chain Data Analysis to Track Active Addresses and Whale Movements in 2026

How to Conduct Cryptocurrency Project Fundamental Analysis: Whitepaper, Use Cases, Technology, and Roadmap
What is the current crypto market cap ranking and trading volume overview for 2026?

Hamster Kombat Daily Combo & Cipher Answer 4 january 2026

Dropee Daily Combo for 4 january 2026