Is Marlin (POND) a good investment?: A Comprehensive Analysis of Price Potential, Tokenomics, and Market Risks in 2024

Introduction: Marlin (POND) Investment Position and Market Prospects
Marlin (POND) is an important asset in the cryptocurrency field. Since its launch in December 2020, it has gained recognition as an open protocol providing high-performance programmable network infrastructure for DeFi and Web 3.0. As of December 2025, POND's market capitalization stands at approximately $39.35 million, with a circulating supply of about 8.2 billion tokens and a current price hovering around $0.003935. With its positioning as a utility token supporting network governance, protocol incentives, and node staking mechanisms, POND has gradually become a focal point when investors discuss "Is Marlin (POND) a good investment?" This article will comprehensively analyze POND's investment value, historical price trends, future price forecasts, and investment risks to provide investors with relevant reference information.
Marlin (POND) Cryptocurrency Research Report
I. POND Price History Review and Current Investment Value
POND Historical Price Performance and Investment Returns
- 2020: POND officially launched at an initial price of $0.008
- December 22, 2020: Reached all-time high of $0.323362 - representing a gain of approximately 4,042% from launch price
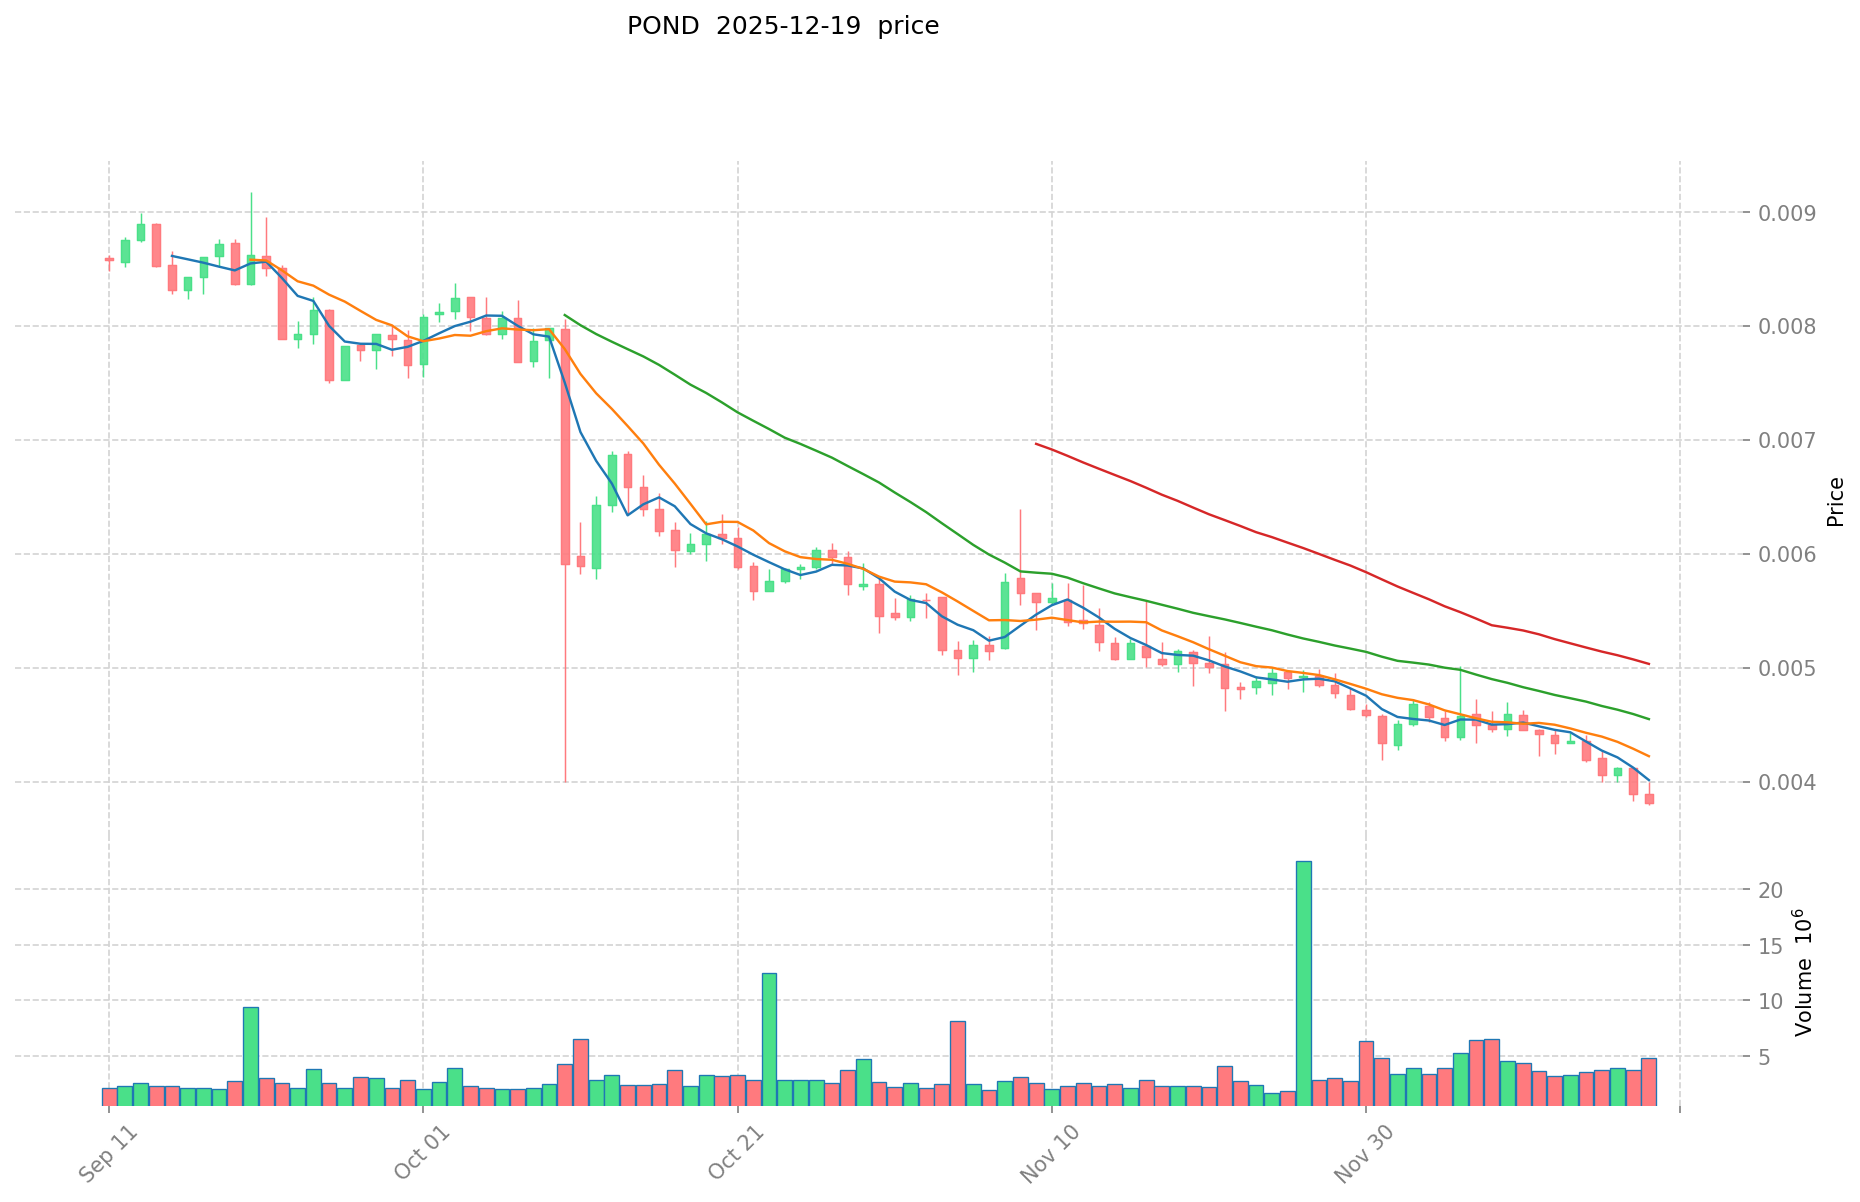
- 2025: Extended market downturn - price declined from peak levels to current market lows
Current POND Market Status (December 19, 2025)
| Metric | Value |
|---|---|
| Current Price | $0.003935 |
| 24-Hour Change | +2.07% |
| 7-Day Change | -11.18% |
| 30-Day Change | -22.03% |
| 1-Year Change | -80.74% |
| All-Time High | $0.323362 (December 22, 2020) |
| All-Time Low | $0.00376604 (December 19, 2025) |
Market Metrics
- 24-Hour Trading Volume: $18,209.23
- Market Capitalization: $32,276,421.03
- Fully Diluted Valuation: $39,350,000.00
- Market Sentiment: Neutral (Index: 1)
- Circulating Supply: 8,202,394,162 POND (82.02% of total supply)
- Total Supply: 10,000,000,000 POND
- Number of Holders: 11,247
- Exchange Listings: 20 exchanges
II. Token Utility and Ecosystem Function
Marlin (POND) is an open protocol providing high-performance programmable network infrastructure for DeFi and Web3.0 applications. The native POND token serves three primary functions:
I. Governance
POND token holders can participate in governance decisions, including:
- Fund allocation and resource management within the network
- Network resource distribution mechanisms
II. Protocol Incentives
Users engaging with the Marlin network earn POND rewards for:
- Data transmission activities
- Data reception operations
III. Staking Requirements
Network nodes must stake POND tokens to:
- Join the Marlin network
- Participate in network validation and operation
III. Technical Infrastructure
Blockchain Network: Ethereum (ETH)
- Contract Address: 0x57b946008913b82e4df85f501cbaed910e58d26c
- Verification: Etherscan
IV. Community and Resources
| Channel | Link |
|---|---|
| Official Website | https://www.marlin.org/ |
| https://twitter.com/marlinprotocol | |
| https://www.reddit.com/r/marlinprotocol/ | |
| https://www.facebook.com/marlinprotocol | |
| GitHub | https://github.com/marlinprotocol/OpenWeaver |
Access real-time POND market price: Gate POND Price
Report Date: December 19, 2025
Data Source: Gate Crypto Research Database
Market Rank: 665 (by market capitalization)
Marlin (POND) Investment Analysis Report
Report Date: December 19, 2025
I. Executive Summary
Marlin (POND) is an open protocol providing high-performance programmable network infrastructure for DeFi and Web 3.0 applications. As of December 19, 2025, POND is trading at $0.003935, representing a significant decline from its all-time high of $0.323362 reached on December 22, 2020. The token currently ranks 665th by market capitalization with a fully diluted valuation of $39.35 million and a circulating supply of 8.2 billion tokens out of a maximum supply of 10 billion tokens.
II. Core Factors Influencing Whether Marlin (POND) Is a Good Investment
Supply Mechanism and Scarcity
Marlin operates with a fixed maximum supply of 10 billion POND tokens, with approximately 82.02% currently in circulation (8.2 billion tokens). The circulating-to-maximum supply ratio indicates limited remaining token inflation, which theoretically provides scarcity characteristics. However, the substantial already-circulated supply limits the scarcity argument compared to tokens with lower circulation ratios.
Investment Implication: The fixed supply cap provides predictable tokenomics, but the high circulation ratio (82.02%) means limited future scarcity-driven price appreciation from supply dynamics alone.
Token Utility Framework
POND serves three primary functions within the Marlin ecosystem:
Governance: Token holders can vote on governance decisions, including fund allocation within liquidity pools and network resource distribution.
Protocol Incentives: Users earn POND tokens as rewards when sending or receiving data on the Marlin network, creating ongoing demand and utility-driven value.
Staking and Network Participation: Nodes must stake POND tokens to join and participate in the Marlin network, establishing a direct link between token supply requirements and network expansion.
Investment Implication: Functional utility provides fundamental demand drivers beyond speculative trading, though the magnitude of this demand remains variable based on network adoption.
Technical and Ecosystem Development
Marlin's infrastructure enables programmable network capabilities for decentralized finance and Web 3.0 applications. The protocol's positioning as network infrastructure creates potential for application-layer adoption that could drive token utility growth.
Investment Implication: Infrastructure-layer protocols require sustained ecosystem development and adoption to realize their value proposition. Progress in these areas directly impacts long-term investment fundamentals.
III. Market Performance Analysis
Price Dynamics and Trends
| Period | Price Change | Change Amount |
|---|---|---|
| 1 Hour | +1.60% | +$0.000062 |
| 24 Hours | +2.07% | +$0.000080 |
| 7 Days | -11.18% | -$0.000495 |
| 30 Days | -22.03% | -$0.001112 |
| 1 Year | -80.74% | -$0.016496 |
Key Observations:
- Short-term momentum shows minor gains (1-hour and 24-hour periods positive)
- Medium-term weakness persists (7-day and 30-day periods negative)
- Severe long-term decline of 80.74% over the past year reflects sustained bearish pressure
- Current price of $0.003935 represents a 98.78% decline from the all-time high of $0.323362
Market Positioning
- Market Capitalization (Circulating): $32.28 million
- Fully Diluted Valuation: $39.35 million
- Market Dominance: 0.0012%
- 24-Hour Trading Volume: $18,209.23
- Token Holders: 11,247
- Exchange Listings: 20 exchanges
Analysis: The relatively low trading volume ($18,209.23 in 24 hours) relative to market cap indicates limited liquidity and trading activity. The small holder base (11,247 addresses) suggests concentrated ownership and limited retail distribution.
IV. Risk Factors and Market Sentiment
Bearish Technical Outlook
Multiple forecasts indicate a bearish technical outlook for POND in 2025, with quantitative technical indicators suggesting unfavorable momentum. Market emotion indicators reflect negative sentiment regarding near-term price prospects.
Liquidity Constraints
The combination of moderate trading volume relative to market capitalization and limited exchange listings (20 exchanges) creates potential liquidity challenges for significant position entries or exits.
Historical Performance Context
The 80.74% annual decline and movement toward all-time lows (the low price of $0.00376604 was recorded recently) demonstrate sustained bearish pressure unrelieved by recovery attempts.
V. Contract and Verification Information
Blockchain Network: Ethereum (ETH)
Contract Address: 0x57b946008913b82e4df85f501cbaed910e58d26c
Etherscan Verification: Available on Etherscan
Official Resources:
- Website: https://www.marlin.org/
- Twitter: https://twitter.com/marlinprotocol
- GitHub: https://github.com/marlinprotocol/OpenWeaver
- Reddit: https://www.reddit.com/r/marlinprotocol/
- Facebook: https://www.facebook.com/marlinprotocol
VI. Conclusion
Marlin (POND) presents a contrarian investment opportunity for those believing in infrastructure-layer protocol development. However, current market indicators—including bearish technical sentiment, significant year-over-year decline, limited trading activity, and concentration in holder distribution—suggest substantial risks for near-term investors. The token's utility framework provides fundamental value drivers, but their realization depends on sustained ecosystem adoption and network growth that remains uncertain.
Disclaimer: This analysis presents factual market data and does not constitute investment advice. Cryptocurrency investments carry substantial risks, and past performance does not guarantee future results. Conduct independent research and consult financial professionals before making investment decisions.
III. POND Future Investment Predictions and Price Outlook
Short-term Investment Prediction (2025, short-term POND investment outlook)
- Conservative forecast: $0.0025 - $0.0035
- Neutral forecast: $0.0035 - $0.0042
- Optimistic forecast: $0.0042 - $0.0053
Mid-term Investment Outlook (2026-2027, mid-term Marlin(POND) investment forecast)
- Market phase expectations: Gradual network adoption with potential institutional interest in infrastructure solutions; protocol functionality improvements and MEV integration progress.
- Investment return predictions:
- 2026: $0.0036 - $0.0043
- 2027: $0.0040 - $0.0043
- Key catalysts: Arbitrum migration implementation, OpenWeaver adoption by major chains, MEV-aware validator partnerships, staking mechanism optimization, and developer ecosystem expansion.
Long-term Investment Outlook (Is POND a good long-term investment?)
- Base case scenario: $0.0037 - $0.0064 (progressive network adoption with stable staking activity and moderate new use cases)
- Optimistic scenario: $0.0064 - $0.0100+ (rapid low-latency overlay adoption across multiple chains combined with favorable staking economics and limited liquid supply)
- Risk scenario: $0.0015 - $0.0025 (execution risks from integration delays, competitive infrastructure solutions, or adverse regulatory environment)
Click to view POND long-term investment and price predictions: Price Prediction
2025-2030 Long-term Outlook
- Base scenario: $0.0037 - $0.0064 USD (corresponding to steady progress in network functionality and mainstream infrastructure adoption)
- Optimistic scenario: $0.0064 - $0.0100+ USD (corresponding to large-scale MEV integration, multi-chain relay adoption, and favorable market conditions)
- Transformative scenario: $0.0150+ USD (if ecosystem achieves breakthrough progress in low-latency solutions and captures significant share of DeFi infrastructure demand)
- 2030-12-31 predicted high: $0.0064 USD (based on optimistic development assumptions)
Disclaimer: This analysis is based on available market data and prediction models as of December 19, 2025. Price predictions are speculative and subject to significant uncertainties including market volatility, technology execution risks, regulatory changes, and broader cryptocurrency market cycles. Past performance does not guarantee future results. Token unlock schedules, liquidity dynamics, and competitive developments may materially impact actual prices. Investors should conduct thorough due diligence and consider their risk tolerance before making investment decisions.
| 年份 | 预测最高价 | 预测平均价格 | 预测最低价 | 涨跌幅 |
|---|---|---|---|---|
| 2025 | 0.00423684 | 0.003923 | 0.00251072 | 0 |
| 2026 | 0.004283916 | 0.00407992 | 0.0036311288 | 4 |
| 2027 | 0.00430737554 | 0.004181918 | 0.0039728221 | 7 |
| 2028 | 0.0053482549302 | 0.00424464677 | 0.0037352891576 | 8 |
| 2029 | 0.005563882986116 | 0.0047964508501 | 0.00431680576509 | 22 |
| 2030 | 0.006423406978453 | 0.005180166918108 | 0.003677918511856 | 32 |
Marlin (POND) Investment Analysis Report
I. Executive Summary
Marlin (POND) is an open protocol providing high-performance programmable network infrastructure for DeFi and Web 3.0 applications. As of December 19, 2025, POND is trading at $0.003935 with a market capitalization of approximately $32.3 million and a fully diluted valuation of $39.35 million. The token has experienced significant long-term depreciation, declining 80.74% over the past year.
II. Project Overview
Protocol Architecture
Marlin is designed as an open protocol that delivers high-performance network infrastructure tailored for decentralized finance and Web 3.0 ecosystems. The protocol enables participants to leverage programmable network capabilities for enhanced interoperability and data transmission.
Token Economics
POND Token Specifications:
- Current Price: $0.003935
- Total Supply: 10,000,000,000 POND
- Circulating Supply: 8,202,394,162 POND (82.02% of total supply)
- Market Capitalization: $32,276,421.03
- Fully Diluted Valuation: $39,350,000.00
- Active Holders: 11,247
- Exchange Listings: 20
Token Launch Details:
- Launch Date: December 21, 2020
- Initial Price: $0.008
- All-Time High: $0.323362 (December 22, 2020)
- All-Time Low: $0.00376604 (December 19, 2025)
III. Token Utility & Use Cases
Governance Function
POND token holders possess voting rights on critical governance decisions, including:
- Capital allocation within fund pools
- Network resource distribution and management
Protocol Incentives
Users participating in data transmission within the Marlin network earn POND token rewards for sending or receiving data, creating economic incentives for network engagement.
Staking & Network Participation
Node operators are required to stake POND tokens as collateral to join and participate in the Marlin network, establishing a barrier to entry while securing network operations.
IV. Market Performance Analysis
Price Performance
Short-term Movements:
- 1-Hour Change: +1.60% (+$0.000062)
- 24-Hour Change: +2.07% (+$0.000080)
- 7-Day Change: -11.18% (-$0.000495)
- 30-Day Change: -22.03% (-$0.001112)
- 1-Year Change: -80.74% (-$0.016496)
Trading Activity:
- 24-Hour Volume: $18,209.23
- Market Dominance: 0.0012%
- Circulating Supply Ratio: 82.02%
V. Investment Strategy & Risk Management
Investment Methodology
Long-term Holding (HODL POND) Suitable for conservative investors seeking exposure to network infrastructure protocols. This strategy involves acquiring POND tokens and maintaining positions through market cycles, capitalizing on potential protocol adoption growth and staking rewards.
Active Trading Dependent on technical analysis and range-bound operations. Given POND's volatility patterns and relatively low trading volume ($18,209 in 24-hour volume), active traders should employ strict entry and exit protocols with defined risk parameters.
Risk Management Framework
Asset Allocation Guidelines:
- Conservative Investors: 1-3% portfolio allocation to POND
- Active Investors: 3-7% tactical allocation
- Professional Investors: Strategic allocation within sector-weighted DeFi infrastructure basket
Diversification Strategy Avoid concentrated exposure to single infrastructure protocols. Combine POND holdings with:
- Established layer-1 blockchains
- Diversified DeFi protocol exposure
- Stablecoin reserves
Security Protocols:
- Hot Wallet: Exchange holdings for active trading (limit exposure)
- Cold Wallet: Hardware wallet storage for long-term positions (Ledger, Trezor)
- Multi-signature solutions for institutional-scale holdings
VI. Investment Risks & Challenges
Market Risk
Marlin demonstrates extreme volatility with an 80.74% annual decline and persistent low trading liquidity ($18,209 daily volume). Price manipulation risks are elevated given the token's small market cap and concentrated holder base of 11,247 accounts.
Regulatory Risk
Network infrastructure tokens face evolving regulatory treatment across jurisdictions. Policy uncertainty regarding staking mechanisms, governance token classification, and cross-border DeFi operations presents material downside scenarios.
Technology Risk
Network security vulnerabilities in programmable infrastructure protocols could trigger loss of user confidence. Protocol upgrade failures or smart contract exploits would directly impact token utility and network participation.
Market Adoption Risk
Marlin faces competition from established network infrastructure providers. Insufficient developer adoption or failure to capture DeFi market share would limit token utility and demand.
VII. Conclusion: Is POND a Good Investment?
Investment Value Assessment
Marlin operates within the network infrastructure segment of DeFi, addressing legitimate technical requirements for high-performance data transmission. However, POND exhibits characteristics of a speculative-stage asset:
Positive Factors:
- Clear token utility through staking requirements and governance participation
- Established protocol with multi-exchange listing support
- Active development and community engagement (GitHub, social channels)
Negative Factors:
- Severe long-term depreciation (80.74% annually)
- Low trading liquidity creates slippage risk
- Minimal market capitalization ($32.3 million) indicates limited institutional adoption
- Price currently at all-time low represents extreme risk environment
Investor Recommendations
✅ Beginners:
- Dollar-cost averaging (DCA) strategy with 0.5-1% portfolio allocation
- Mandatory hardware wallet storage for security
- 18-24 month minimum holding horizon to tolerate volatility
✅ Experienced Investors:
- Range-bound trading between support ($0.0037) and resistance levels
- Position sizing limited to 3-5% of active trading capital
- Complement with established infrastructure token holdings
✅ Institutional Investors:
- Strategic allocation contingent upon protocol development milestones
- Requirement for enhanced due diligence on development team capabilities
- Consideration of POND as secondary position within diversified blockchain infrastructure strategy
Risk Warning
⚠️ IMPORTANT DISCLAIMER: Cryptocurrency investments carry substantial risk of total capital loss. POND exhibits elevated volatility, low liquidity, and weak long-term price performance. This analysis is provided for informational purposes only and does not constitute investment advice, financial recommendation, or solicitation to purchase. Investors must conduct independent research, understand their risk tolerance, and consult qualified financial advisors before making investment decisions. Past performance does not guarantee future results.
Report Date: December 19, 2025 Data Source: GateData Market Analysis Update Frequency: Real-time market data as of report publication
Marlin (POND) Investment Analysis Report
I. Executive Summary
Marlin (POND) is an open protocol providing high-performance programmable network infrastructure for DeFi and Web 3.0 applications. As of December 19, 2025, POND is trading at $0.003935 with a market capitalization of approximately $32.3 million. The token has experienced significant long-term depreciation, declining 80.74% over the past year from a peak of $0.323362 in December 2020.
II. Project Overview
Marlin is designed as an open protocol delivering high-performance network infrastructure for decentralized finance and Web 3.0 ecosystems. The POND token serves as the native utility token within this infrastructure, supporting governance, protocol incentives, and network staking mechanisms.
Current Market Metrics (December 19, 2025):
- Current Price: $0.003935
- Market Capitalization: $32,276,421
- Fully Diluted Valuation: $39,350,000
- Total Supply: 10,000,000,000 POND
- Circulating Supply: 8,202,394,162 POND (82.02%)
- Active Holders: 11,247
- Exchange Listings: 20
III. Token Utility & Ecosystem Function
I. Governance
POND token holders can participate in governance decisions including fund allocation and network resource distribution mechanisms.
II. Protocol Incentives
Users earn POND rewards for data transmission activities within the Marlin network, creating economic incentives for network engagement.
III. Staking Requirements
Network nodes must stake POND tokens to join and participate in the Marlin network, establishing direct utility linkage between token supply and network expansion.
IV. Market Performance Analysis
Price Performance Trends:
| Time Period | Change | Amount |
|---|---|---|
| 1 Hour | +1.60% | +$0.000062 |
| 24 Hours | +2.07% | +$0.000080 |
| 7 Days | -11.18% | -$0.000495 |
| 30 Days | -22.03% | -$0.001112 |
| 1 Year | -80.74% | -$0.016496 |
Key Observations:
- Short-term momentum shows minor gains
- Medium-term weakness persists over 7-30 day periods
- Severe long-term decline of 80.74% reflects sustained bearish pressure
- Current price represents 98.78% decline from all-time high
V. Long-term Price Outlook (2025-2030)
| Year | Predicted High | Average Price | Predicted Low | Change |
|---|---|---|---|---|
| 2025 | $0.004237 | $0.003923 | $0.002511 | 0% |
| 2026 | $0.004284 | $0.004080 | $0.003631 | +4% |
| 2027 | $0.004307 | $0.004182 | $0.003973 | +7% |
| 2028 | $0.005348 | $0.004245 | $0.003735 | +8% |
| 2029 | $0.005564 | $0.004796 | $0.004317 | +22% |
| 2030 | $0.006423 | $0.005180 | $0.003678 | +32% |
VI. Risk Assessment
Critical Risk Factors
Liquidity Risk: 24-hour trading volume of $18,209 creates significant slippage risk for larger transactions relative to the $32.3 million market cap.
Concentration Risk: Limited holder base of 11,247 addresses indicates concentrated ownership structure vulnerable to large sell-offs.
Technology Risk: Network security vulnerabilities in programmable infrastructure could trigger loss of confidence and reduced protocol adoption.
Regulatory Risk: Evolving regulatory treatment of staking mechanisms and governance tokens presents uncertainty.
VII. FAQ
Q1: What are the primary use cases for POND tokens within the Marlin ecosystem?
A: POND tokens serve three primary functions: (1) Governance—holders vote on fund allocation and network resource distribution; (2) Protocol Incentives—users earn POND rewards for sending or receiving data on the Marlin network; (3) Staking Mechanism—node operators must stake POND to participate in network validation and operations. These utility functions create fundamental demand drivers beyond speculative trading.
Q2: Is POND a good investment given its current market price and performance?
A: POND presents a speculative opportunity with significant risks. The token has declined 80.74% over the past year and currently trades at all-time lows. However, it maintains legitimate utility through its role in network infrastructure. Suitable only for risk-tolerant investors with long-term horizons (18-24 months minimum). Recommended allocation: 0.5-3% of portfolio for conservative investors, maximum 7% for experienced traders. Conduct independent research before investing.
Q3: What is driving POND's recent price weakness and bearish technical outlook?
A: Multiple factors contribute to POND's decline: (1) Limited trading volume ($18,209 daily) creates thin market conditions; (2) Bearish technical indicators signal unfavorable momentum; (3) Limited exchange listings (20 exchanges) restrict accessibility; (4) Uncertain mainstream adoption of Marlin's infrastructure despite utility; (5) Broader cryptocurrency market cycles affecting infrastructure tokens. Recovery depends on demonstrating substantial developer adoption and network growth.
Q4: How does POND's token supply structure affect long-term investment potential?
A: POND operates with a fixed maximum supply of 10 billion tokens, with 82.02% already in circulation (8.2 billion). The high circulation ratio limits scarcity-driven appreciation from supply dynamics alone. However, the fixed supply cap provides predictable tokenomics. Future value appreciation depends primarily on increased utility demand from network adoption rather than supply-side constraints. No additional supply inflation is expected given the circulating supply ratio.
Q5: What price targets and timeframes should investors consider for POND?
A: Short-term (2025): Conservative forecast $0.0025-$0.0035; Neutral $0.0035-$0.0042; Optimistic $0.0042-$0.0053. Mid-term (2026-2027): Expected range $0.0036-$0.0043. Long-term (2030): Base scenario $0.0037-$0.0064; Optimistic scenario $0.0064-$0.0100+; Transformative scenario $0.0150+. Success depends on Arbitrum migration, OpenWeaver adoption, MEV integration, and developer ecosystem expansion.
Q6: What security and storage recommendations apply to POND holdings?
A: For small positions, exchange storage is acceptable for active trading. For holdings exceeding $1,000 or longer-term positions, use hardware wallets (Ledger, Trezor) for cold storage. Institutional-scale holdings should employ multi-signature solutions. Never store significant amounts on exchanges due to counterparty risk. Ensure private key backup and secure seed phrase storage in physical form at separate locations.
Q7: How does POND compare to competing network infrastructure protocols?
A: Marlin positions itself in the network infrastructure layer with focus on high-performance, low-latency data transmission for DeFi applications. Primary competitive advantages: (1) Established protocol with multi-chain integration potential; (2) Clear staking mechanism creating utility demand; (3) Active development team. Competitive disadvantages: (1) Smaller market cap ($32.3M) versus established competitors; (2) Limited adoption metrics; (3) Lower trading liquidity restricts institutional access. Investors should evaluate against other infrastructure tokens before allocating capital.
Q8: What are the key development milestones that would validate POND as a long-term investment?
A: Critical catalysts include: (1) Successful Arbitrum migration implementation; (2) OpenWeaver adoption by multiple major blockchain networks; (3) MEV-aware validator partnerships with significant exchanges or protocols; (4) Staking mechanism optimization increasing validator participation; (5) Developer ecosystem expansion evidenced by application launches; (6) Trading volume increases above $100,000 daily; (7) Holder base growth beyond 50,000 active addresses. Achievement of these milestones would substantiate the investment thesis and support price recovery toward mid-term forecasts.
Disclaimer
This analysis presents factual market data and does not constitute investment advice, financial recommendation, or solicitation to purchase. Cryptocurrency investments carry substantial risk of total capital loss. POND exhibits elevated volatility, low liquidity, and weak recent performance. Past performance does not guarantee future results. Investors must conduct independent research, understand their risk tolerance, and consult qualified financial advisors before making investment decisions.
Report Date: December 19, 2025
Data Source: Gate Crypto Research Database
Market Rank: 665 (by market capitalization)
Share
How to Buy Cryptocurrency


Trending Cryptocurrencies


Sei Network 2025 Development Status and Investment Opportunity Analysis

Analysis of the Development Status and Investment Opportunities of the SEI Ecosystem in 2025

SEI Staking Analysis: 60-70% Supply Locked and Its Price Impact

What Is Staking: A Guide for Crypto Investors in 2025

Gate 2025 staking tutorial: Decentralized Finance strategies and yield calculation guide

Latest Analysis and Investment Outlook for Chainlink Price in June 2025
BTC Dominance Chart

KINGSHIB vs NEAR: Comparing Two Emerging Blockchain Projects in the Cryptocurrency Market

LYP vs VET: A Comprehensive Comparison of Two Leading Blockchain Supply Chain Solutions

WHYPAD vs GRT: A Comprehensive Comparison of Two Leading Blockchain Data Indexing Platforms

Funding Rate