Is Rarible (RARI) a good investment?: A Comprehensive Analysis of the NFT Platform's Tokenomics, Market Position, and Future Potential in the Digital Art Ecosystem


Introduction: Rarible (RARI) Investment Position and Market Prospects
RARI is an important asset in the crypto industry. Since its launch in 2020, it has achieved significant accomplishments in onchain commerce infrastructure and NFT marketplace governance. As of December 2025, RARI maintains a market capitalization of USD 5,287,500 with a circulating supply of approximately 18.12 million tokens, while the current price hovers around USD 0.2115. With its positioning as the "native governance token powering onchain commerce infrastructure," RARI has gradually become a focal point for investors considering whether Rarible (RARI) represents a sound investment opportunity. This article provides a comprehensive analysis of RARI's investment value, historical price trends, future price forecasts, and investment risks to serve as a reference for investors.
Rarible (RARI) Comprehensive Research Report
I. Price History Review and Current Investment Value Status
RARI Historical Price Trends and Investment Returns
Based on available data as of December 24, 2025:
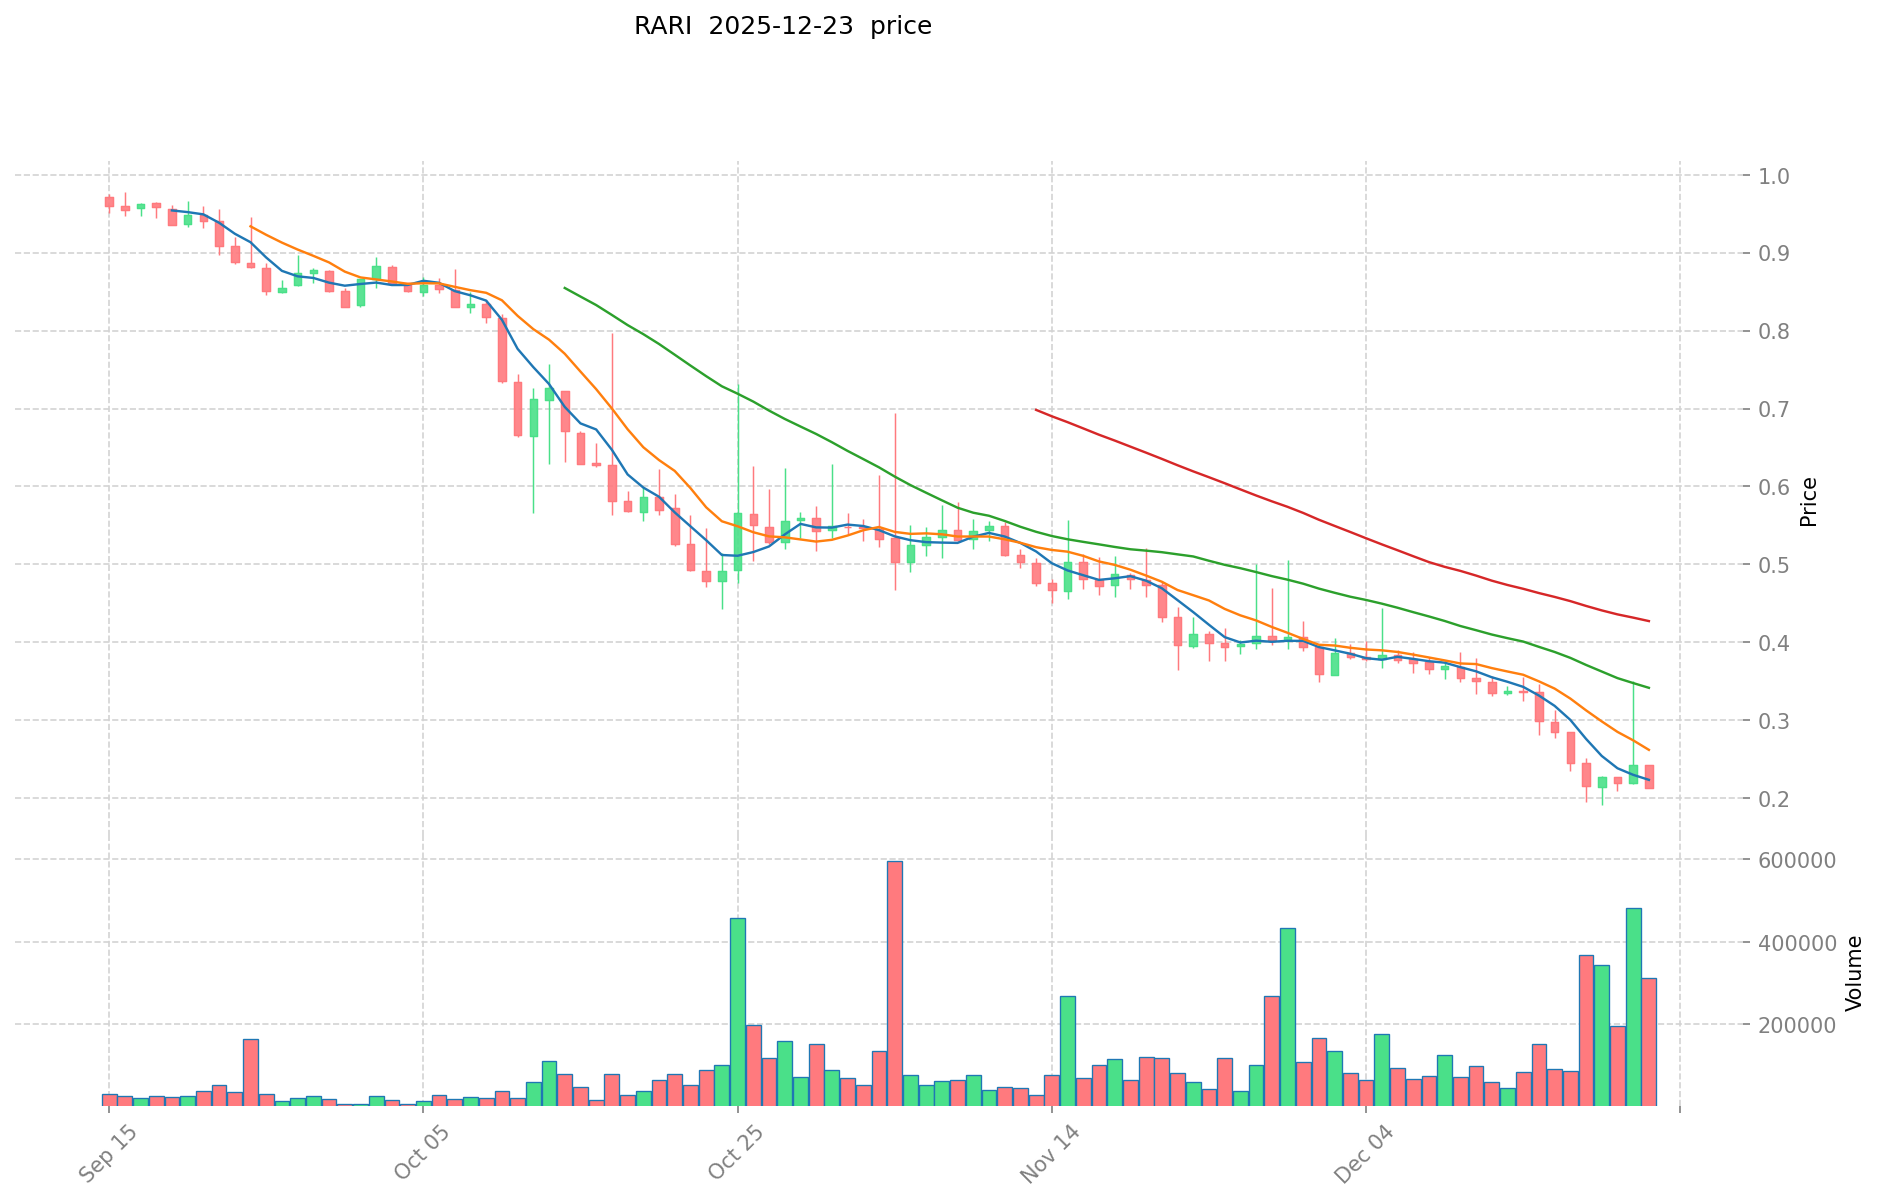
- All-Time High (ATH): USD 46.70 reached on March 30, 2021 → representing peak market enthusiasm during the 2021 NFT boom
- All-Time Low (ATL): USD 0.191384 recorded on December 19, 2025 → indicating significant recent market correction
- Year-over-Year Performance: -91.93% decline over the past 12 months
- 30-Day Performance: -48.44% decline
- 7-Day Performance: -25.91% decline
The token has experienced substantial depreciation from its peak valuation, with cumulative losses exceeding 99% from ATH levels.
Current RARI Market Status (December 24, 2025)
| Metric | Value |
|---|---|
| Current Price | USD 0.2115 |
| 24-Hour Change | -2.44% |
| 1-Hour Change | -1.22% |
| 24-Hour Trading Volume | USD 128,280.18 |
| Market Capitalization | USD 3,832,778.10 |
| Fully Diluted Valuation (FDV) | USD 5,287,500.00 |
| Market Cap to FDV Ratio | 72.49% |
| Circulating Supply | 18,121,882.26 RARI (72.49% of total) |
| Total Supply | 25,000,000 RARI |
| Market Dominance | 0.00016% |
| Active Holders | 24,455 |
| Exchange Listings | 7 exchanges |
| 24-Hour High | USD 0.2543 |
| 24-Hour Low | USD 0.2104 |
Market sentiment indicator shows neutral positioning, reflecting subdued investor confidence amid ongoing price pressures.
II. Project Overview and Ecosystem Function
Core Functionality
$RARI serves as the native governance token of the Rarible ecosystem, stewarded by the RARI Foundation on behalf of the community. The token powers infrastructure for onchain commerce with the following key characteristics:
- Governance Role: RARI holders can delegate voting power and participate in platform management and community decisions
- Incentive Mechanism: Every transaction on the Rarible NFT marketplace generates fees that are collected by the Foundation and distributed to users in $RARI tokens
- Staking Rewards: Token holders can stake RARI to earn annualized percentage yield (APY) while participating in ecosystem governance
- Value Distribution: Holders share in the long-term value created by the Rarible ecosystem
Cross-Chain Rewards Program
The RARI Foundation facilitates a cross-chain rewards program on Rarible.com designed to promote long-term growth and deepen liquidity across multiple blockchain networks. This structure enables broader ecosystem participation while incentivizing platform activity.
III. Tokenomics Analysis
Supply Structure
- Maximum Supply: 25,000,000 RARI (fixed cap)
- Circulating Supply: 18,121,882.26 RARI
- Circulation Ratio: 72.49%
- Outstanding Supply: 6,878,117.74 RARI (27.51% not yet in circulation)
Market Distribution
The circulating supply represents nearly three-quarters of the total allocation, with 27.51% remaining for future distribution. This structure maintains moderate dilution risk as the remaining tokens enter circulation over time.
IV. Market Performance Context
Platform Integration
Users can leverage the Rarible platform to create customized NFT assets, purchase, and sell digital collectibles. RARI empowers the most active creators and collectors on Rarible to vote on platform upgrades and participate in governance and content moderation.
Market Position
- CoinGecko Ranking: 1,703
- Market Cap Position: Among lower-ranked cryptocurrencies by market capitalization
- Network Base: Primarily deployed on Ethereum blockchain (contract address: 0xfca59cd816ab1ead66534d82bc21e7515ce441cf)
V. Key Observations
Price Volatility
The token exhibits significant price volatility with daily fluctuations between -1.22% (1-hour) and continued downward pressure over longer timeframes. The recent 48.44% monthly decline and 91.93% annual decline indicate sustained selling pressure and diminished investor confidence.
Holder Distribution
With 24,455 active token holders, RARI maintains a moderately distributed holder base, though trading volume concentration and whale holdings patterns remain relevant factors for price stability assessment.
Liquidity Position
Current 24-hour trading volume of USD 128,280 relative to market capitalization of USD 3.8 million suggests moderate liquidity conditions, with potential challenges for large position movements.
Data Source: Market data as of December 24, 2025 UTC
Blockchain Network: Ethereum (ETH)
Official Resources: Rarible Platform | Smart Contract
Rarible (RARI) Investment Analysis Report
Report Date: December 24, 2025
I. Executive Summary
Rarible (RARI) is the native governance token of the Rarible ecosystem, designed to power infrastructure for onchain commerce. As of the report date, RARI is trading at $0.2115 with a market capitalization of approximately $3.83 million and a fully diluted valuation of $5.29 million. The token has experienced significant depreciation, declining 91.93% over the past year and 48.44% over the past 30 days.
II. Core Factors Influencing RARI as an Investment
Supply Mechanism and Scarcity (RARI Investment Scarcity)
- Token Supply Structure: RARI has a maximum supply of 25,000,000 tokens, with 18,121,882 tokens currently in circulation (representing 72.49% circulation ratio).
- Fee Distribution Model: Every trade on the NFT marketplace generates fees that are collected by the RARI Foundation and distributed to users in RARI tokens, creating ongoing token distribution pressure.
- Recent Policy Change: Since September 2025, 100% of Rarible's marketplace fees now fund RARI buybacks, replacing previous token reward programs. This represents a significant shift toward scarcity enhancement through token reduction mechanisms.
- Investment Implications: The transition from reward distribution to buyback programs suggests an attempt to support long-term token scarcity and potentially enhance holder value.
Token Economics and Holder Benefits
- Staking Mechanism: Token holders can stake RARI to delegate voting power and earn annual percentage yield (APY), enabling participation in ecosystem governance while capturing long-term value creation.
- Community Governance: RARI is stewarded by the RARI Foundation on behalf of the community, establishing a decentralized governance structure.
- Cross-Chain Rewards Program: The RARI Foundation facilitates cross-chain rewards initiatives on Rarible.com designed to fuel long-term growth and deepen liquidity across multiple blockchain networks.
Market Performance and Valuation Metrics
- Current Price Position: Trading at $0.2115 as of December 24, 2025, representing significant depreciation from all-time high of $46.70 (reached on March 30, 2021).
- Recent Price Trend:
- 1-hour change: -1.22%
- 24-hour change: -2.44%
- 7-day change: -25.91%
- 30-day change: -48.44%
- 1-year change: -91.93%
- Trading Activity: 24-hour trading volume of $128,280.18 with 7 exchange listings, indicating moderate liquidity.
- Holder Base: Approximately 24,455 token holders, reflecting a distributed ownership structure.
Ecosystem and Utility Development
- NFT Marketplace Infrastructure: RARI powers the Rarible NFT marketplace, which generates transaction fees that support the token distribution and buyback mechanisms.
- Onchain Commerce Focus: The token is designed to support broader infrastructure for onchain commerce, extending beyond NFT trading to general commerce applications.
- Multi-Chain Presence: The token operates on the Ethereum network, with cross-chain reward programs indicating expansion to multiple blockchain ecosystems.
Market Sentiment and Volatility
- Market Capitalization Position: RARI ranks 1,703 by market capitalization with a market dominance of 0.00016%, indicating limited systemic importance.
- Price Volatility: The token exhibits significant volatility, trading within a 24-hour range of $0.2104 to $0.2543, suggesting high price uncertainty.
- Historical Volatility: All-time low of $0.191384 reached on December 19, 2025, reflects extreme downward pressure during recent market conditions.
III. Key Risk Factors
- Severe Depreciation: The 91.93% one-year decline represents substantial value erosion for long-term holders.
- Low Market Capitalization: The relatively small market cap of $3.83 million suggests limited institutional participation and liquidity concentration risk.
- NFT Market Dependency: Rarible's success is directly tied to NFT market activity, which has experienced significant cyclical fluctuations.
- Regulatory Uncertainty: Changes in cryptocurrency and NFT regulations could impact marketplace operations and token utility.
IV. Data Sources and References
- Real-Time Price Data: As of December 24, 2025, 07:20:59 UTC
- Contract Address: 0xfca59cd816ab1ead66534d82bc21e7515ce441cf (Ethereum network)
- Official Resources:
- Application: https://app.rarible.com/rari
- Blockchain Explorer: https://etherscan.io/token/0xfca59cd816ab1ead66534d82bc21e7515ce441cf
- Social Media: https://twitter.com/rariblecom
Disclaimer: This report presents factual market data and ecosystem information. Investment decisions should be based on independent research and consultation with qualified financial advisors.
III. RARI Future Investment Predictions and Price Outlook (Is Rarible(RARI) worth investing in 2025-2030)
Short-term Investment Prediction (2025, short-term RARI investment outlook)
- Conservative forecast: $0.1314 - $0.1870
- Neutral forecast: $0.1870 - $0.2119
- Optimistic forecast: $0.2119 - $0.2839
Mid-term Investment Outlook (2026-2028, mid-term Rarible(RARI) investment forecast)
- Market phase expectations: Gradual recovery and stabilization phase with incremental growth potential in the NFT marketplace infrastructure segment
- Investment return predictions:
- 2026: $0.2380 - $0.3545 (17% upside potential)
- 2027: $0.1807 - $0.3615 (42% upside potential)
- 2028: $0.1690 - $0.3645 (56% upside potential)
- Key catalysts: Cross-chain rewards program expansion, ecosystem fee distribution mechanisms, governance participation incentives, and staking yield improvements
Long-term Investment Outlook (Is RARI a good long-term investment?)
- Base scenario: $0.2420 - $0.3653 (assumes steady ecosystem development and stable NFT market conditions)
- Optimistic scenario: $0.3474 - $0.4653 (assumes significant adoption of onchain commerce infrastructure and enhanced liquidity provision)
- Risk scenario: $0.1700 - $0.2400 (assumes market contraction or competitive pressures in NFT trading platforms)
View RARI long-term investment and price prediction: Price Prediction
2025-12-24 to 2030-12-31 Long-term Outlook
- Base scenario: $0.2420 - $0.3653 USD (corresponding to steady growth and mainstream NFT infrastructure adoption)
- Optimistic scenario: $0.3474 - $0.4653 USD (corresponding to large-scale onchain commerce adoption and favorable market environment)
- Transformative scenario: $0.4653 USD and above (if ecosystem achieves breakthrough progress and mainstream adoption accelerates)
- 2030-12-31 predicted high: $0.4653 USD (based on optimistic development assumptions)
Disclaimer: This analysis is based on historical data and third-party forecasts. Cryptocurrency markets are highly volatile and unpredictable. Past performance does not guarantee future results. This information is for educational purposes only and should not be construed as investment advice. Investors should conduct thorough research and consider their risk tolerance before making any investment decisions.
| 年份 | 预测最高价 | 预测平均价格 | 预测最低价 | 涨跌幅 |
|---|---|---|---|---|
| 2025 | 0.283946 | 0.2119 | 0.131378 | 0 |
| 2026 | 0.35452989 | 0.247923 | 0.23800608 | 17 |
| 2027 | 0.361471734 | 0.301226445 | 0.180735867 | 42 |
| 2028 | 0.36448399845 | 0.3313490895 | 0.168988035645 | 56 |
| 2029 | 0.3966248601315 | 0.347916543975 | 0.26093740798125 | 64 |
| 2030 | 0.465338377566562 | 0.37227070205325 | 0.241975956334612 | 76 |
Rarible (RARI) Investment Analysis Report
I. Executive Summary
Project Overview
Rarible (RARI) is the native governance token of the Rarible ecosystem, stewarded by the RARI Foundation on behalf of the community. The token powers infrastructure for onchain commerce by functioning as the governance mechanism for the NFT marketplace platform.
Key Metrics (as of December 24, 2025)
| Metric | Value |
|---|---|
| Current Price | $0.2115 |
| 24h Change | -2.44% |
| Market Cap | $3,832,778.10 |
| Fully Diluted Valuation | $5,287,500.00 |
| Circulating Supply | 18,121,882.26 RARI |
| Total Supply | 25,000,000 RARI |
| Market Ranking | #1,703 |
| 24h Trading Volume | $128,280.18 |
II. Token Economics & Distribution
Supply Structure
- Circulating Supply: 18,121,882.26 RARI (72.49% of total supply)
- Total Supply: 25,000,000 RARI
- Max Supply: 25,000,000 RARI
- Circulation Ratio: 72.49%
Historical Price Performance
| Timeframe | Change |
|---|---|
| 1 Hour | -1.22% |
| 24 Hours | -2.44% |
| 7 Days | -25.91% |
| 30 Days | -48.44% |
| 1 Year | -91.93% |
All-Time High (ATH): $46.70 (March 30, 2021)
All-Time Low (ATL): $0.191384 (December 19, 2025)
24h Range: $0.2104 - $0.2543
Token Utility
RARI serves multiple functions within the ecosystem:
-
Fee Distribution: Every transaction on the NFT marketplace generates fees collected by the Foundation and distributed to users in $RARI tokens.
-
Governance: Token holders can participate in ecosystem governance decisions through voting rights.
-
Staking Rewards: Holders can stake RARI to delegate voting power and earn annual percentage yield (APY), allowing them to participate in governance while sharing in long-term ecosystem value creation.
III. Ecosystem & Use Cases
Cross-Chain Rewards Program
The RARI Foundation operates a cross-chain rewards program on Rarible.com designed to:
- Fuel long-term growth of the ecosystem
- Deepen liquidity across supported networks
- Incentivize user participation and trading activity
Holder Community
- Token Holders: 24,455 addresses
- Active Exchanges: 7 trading platforms
- Market Sentiment: Neutral to positive (sentiment index: 1)
IV. Investment Strategy & Risk Management
Investment Methodology (RARI Investment Strategy)
Long-Term Holding (HODL RARI)
- Suitable for conservative investors focused on governance participation and staking rewards
- Benefit from fee distribution mechanisms and ecosystem growth over extended periods
- Earn staking APY while maintaining voting rights
Active Trading
- Relies on technical analysis given recent volatile price action (72% decline over 12 months)
- Wave-based trading strategies may capitalize on short-term price fluctuations
- Requires active monitoring of market sentiment and trading volume
Risk Management (Risk Management for RARI Investment)
Asset Allocation Ratios
- Conservative Investors: 0-2% portfolio allocation for speculative NFT ecosystem tokens
- Aggressive Investors: 2-5% allocation with active trading components
- Professional Investors: Strategic allocation with hedging instruments and position sizing based on risk tolerance
Risk Mitigation Strategies
- Portfolio Diversification: Combine RARI holdings with established cryptocurrencies and traditional assets
- Hedge Instruments: Utilize derivatives markets for downside protection if available
- Position Sizing: Limit single-position exposure to manage volatility impact
Secure Storage
- Hot Wallets: Use reputable exchange wallets for active trading (minimal holdings)
- Cold Storage: Hardware wallets (Ledger, Trezor) recommended for long-term holdings and staking
- Multi-Signature Security: For significant holdings, implement multi-sig wallet solutions
V. Investment Risks & Challenges
Market Risk
- Extreme Volatility: 91.93% decline over 12 months and 25.91% decline over 7 days demonstrate substantial price instability
- Low Liquidity: $128,280 daily volume relative to market cap indicates potential slippage on larger trades
- Price Manipulation Risk: Relatively small market cap makes the token susceptible to market manipulation
Regulatory Risk
- NFT Market Regulation: Regulatory uncertainty surrounding NFT markets and trading platforms in major jurisdictions
- Governance Token Classification: Potential regulatory reclassification of governance tokens as securities in various countries
- Geographic Restrictions: Compliance challenges may limit user access in certain markets
Technology Risk
- Smart Contract Security: On-chain infrastructure vulnerability and contract upgrade risks
- Platform Dependency: Token value directly dependent on Rarible platform performance and adoption
- Cross-Chain Integration: Risks associated with multi-chain reward programs and bridge protocols
Ecosystem Risk
- Market Competition: Increasing competition from other NFT marketplaces and blockchain platforms
- User Adoption: Heavy dependence on NFT market growth and marketplace usage
- Foundation Governance: Centralized decision-making by RARI Foundation despite decentralization goals
VI. Conclusion: Is RARI a Good Investment?
Investment Value Summary
RARI presents a specialized investment opportunity centered on NFT marketplace participation and governance. However, the token exhibits concerning characteristics:
Strengths:
- Clear utility through fee distribution and staking mechanisms
- Established ecosystem with active governance framework
- Potential for long-term value creation if NFT market recovers
Weaknesses:
- Severe price depreciation (91.93% over one year) indicates significant value destruction
- Limited trading liquidity and small market cap create execution challenges
- High volatility and recent ATL suggest market weakness and investor skepticism
Investment Recommendations
✅ Beginners:
- Dollar-cost averaging (DCA) strategy recommended if considering exposure
- Allocate only 0-1% of portfolio to speculative positions
- Utilize hardware wallet storage for security
- Begin with small test purchases before larger commitments
✅ Experienced Investors:
- Wave-based trading opportunities may exist given volatility
- Combine with portfolio hedging strategies
- Monitor governance developments and staking yield opportunities
- Consider relative value compared to competitive NFT ecosystem tokens
✅ Institutional Investors:
- Strategic allocation contingent on NFT market recovery thesis
- Negotiate custom staking arrangements for yield optimization
- Implement sophisticated risk management and position sizing
- Evaluate long-term ecosystem viability and competitive positioning
⚠️ Disclaimer
Cryptocurrency investments carry substantial risk, including potential total loss of capital. This analysis is provided for informational purposes only and does not constitute investment advice, financial recommendation, or solicitation to buy or sell RARI tokens. Past performance does not guarantee future results. Investors should conduct independent research, consult with qualified financial advisors, and fully understand their risk tolerance before making investment decisions. The regulatory landscape for cryptocurrencies and NFTs remains uncertain and subject to change.
Report Generated: December 24, 2025
Data Source: Gate Data
Disclaimer: This report is for educational and informational purposes only.
Rarible (RARI) Frequently Asked Questions
I. Market Performance and Price Outlook
Q1: What is the current price of RARI and how has it performed recently?
A: As of December 24, 2025, RARI is trading at $0.2115 with a market capitalization of $3,832,778.10. The token has experienced significant recent declines: -1.22% over the past hour, -2.44% over 24 hours, -25.91% over 7 days, -48.44% over 30 days, and -91.93% over the past 12 months. The all-time high of $46.70 was reached on March 30, 2021, while the recent all-time low of $0.191384 was recorded on December 19, 2025.
Q2: What are the price predictions for RARI in 2025-2030?
A: The forecasts vary by scenario. For short-term 2025, predictions range from $0.1314 to $0.2839 depending on market conditions. Mid-term forecasts (2026-2028) suggest potential recovery with 2026 projected at $0.2380-$0.3545, 2027 at $0.1807-$0.3615, and 2028 at $0.1690-$0.3645. For 2030, the base scenario predicts $0.2420-$0.3653, the optimistic scenario suggests $0.3474-$0.4653, and the transformative scenario projects $0.4653 and above. These forecasts assume varying levels of ecosystem adoption and NFT market recovery.
II. Token Utility and Economics
Q3: What is the primary utility of RARI tokens?
A: RARI serves as the native governance token for the Rarible ecosystem with multiple functions: (1) Governance participation through voting rights for RARI holders to influence platform decisions; (2) Fee distribution mechanism where every transaction on the NFT marketplace generates fees collected by the RARI Foundation and distributed to users in RARI tokens; (3) Staking rewards allowing holders to delegate voting power and earn annual percentage yield (APY); and (4) Value sharing in long-term ecosystem growth. Since September 2025, 100% of marketplace fees now fund RARI buybacks, transitioning from direct token reward programs to scarcity enhancement mechanisms.
Q4: How does the RARI token supply structure work?
A: RARI has a fixed maximum supply of 25,000,000 tokens. As of December 24, 2025, the circulating supply is 18,121,882.26 RARI (representing 72.49% of total supply), with 6,878,117.74 RARI (27.51%) remaining for future distribution. This supply structure maintains moderate dilution risk as outstanding tokens gradually enter circulation. The shift toward fee-based buybacks rather than token distribution suggests an attempt to enhance long-term scarcity and support holder value.
III. Investment Considerations
Q5: Is RARI a suitable investment for beginners?
A: RARI presents significant risks for beginning investors. The token exhibits extreme volatility, having declined 91.93% over the past year. Recommended strategies for beginners include: (1) Dollar-cost averaging (DCA) if considering exposure; (2) Limiting allocation to 0-1% of total portfolio for speculative positions; (3) Using hardware wallets (Ledger, Trezor) for secure storage; and (4) Starting with small test purchases before larger commitments. Beginners should prioritize understanding both the technology and risks before investing meaningful capital.
Q6: What are the primary risks associated with investing in RARI?
A: Key risks include: (1) Market Risk - Extreme volatility with 91.93% annual decline and low liquidity ($128,280 daily volume) creates execution challenges and manipulation susceptibility; (2) Regulatory Risk - Uncertain NFT market regulations and potential governance token reclassification as securities; (3) Technology Risk - Smart contract vulnerabilities, platform dependency, and cross-chain integration risks; (4) Ecosystem Risk - Competition from other NFT marketplaces, heavy dependence on NFT market adoption, and centralized Foundation governance despite decentralization goals. Investors face potential total capital loss.
Q7: What investment strategies are recommended for different investor types?
A: Recommended strategies vary by experience level: Beginners should use dollar-cost averaging with 0-1% portfolio allocation and prioritize secure storage. Experienced Investors may employ wave-based trading strategies given volatility, combine holdings with portfolio hedging, monitor governance developments, and evaluate competitive positioning. Institutional Investors should assess the long-term NFT market recovery thesis, negotiate custom staking arrangements, implement sophisticated risk management with position sizing, and evaluate relative value against competitive tokens. All investor types should limit single-position exposure to manage volatility impact effectively.
Q8: What ecosystem developments could positively impact RARI's value?
A: Key catalysts for potential price appreciation include: (1) Cross-chain rewards program expansion to additional blockchain networks; (2) Enhanced ecosystem fee distribution mechanisms and increased marketplace transaction volumes; (3) Improved governance participation incentives and voting mechanisms; (4) Increased staking yield opportunities and improved APY returns; (5) Recovery in the broader NFT market and increased user adoption of Rarible platform; and (6) Development of onchain commerce infrastructure beyond NFT trading. Success in these areas would likely be reflected in increased trading volume, holder growth from the current 24,455 addresses, and potential price recovery toward mid-term forecast levels.
Share
How to Buy Cryptocurrency


Trending Cryptocurrencies


SEI Staking Analysis: 60-70% Supply Locked and Its Price Impact

ALU vs FLOW: Evaluating Different Computational Architectures for Modern Machine Learning Applications

2025 DEGOPrice Prediction: Analyzing Key Factors and Market Trends for Long-Term Growth Potential

SWELL vs RUNE: Comparing Two Leading DeFi Protocols in the Cross-Chain Liquidity Race
2025 ALCX Price Prediction: Future Outlook and Market Analysis for Alchemix Token

2025 ALUPrice Prediction: Market Analysis and Future Outlook for Aluminum Commodity Trends

What is TWAP (Time-Weighted Average Price) Strategy and How Does It Work

How to Delete My Account

What is P2P Trading on a Leading Platform?

BTC Option Flows Explained, Why Bitcoin Above 93,000 Suggests a Bullish Start to 2026
Bitcoin Options Traders Eye USD $100,000 as Derivatives Signal Market Reset