PROVE vs ETH: Comparing the Scalability Solutions for Blockchain Networks
Introduction: Investment Comparison between PROVE and ETH
In the cryptocurrency market, the comparison between Succinct (PROVE) vs Ethereum (ETH) remains an unavoidable topic for investors. The two not only show significant differences in market cap ranking, application scenarios, and price performance, but also represent different crypto asset positioning.
Succinct (PROVE): Since its launch, it has gained market recognition for its decentralized prover network and zero-knowledge proof infrastructure.
Ethereum (ETH): Since 2015, it has been hailed as the foundation for decentralized applications and smart contracts, and is one of the cryptocurrencies with the highest global trading volume and market capitalization.
This article will comprehensively analyze the investment value comparison between PROVE vs ETH, focusing on historical price trends, supply mechanisms, institutional adoption, technological ecosystems, and future predictions, attempting to answer the question investors care about most:
"Which is the better buy right now?"
I. Price History Comparison and Current Market Status
PROVE and ETH Historical Price Trends
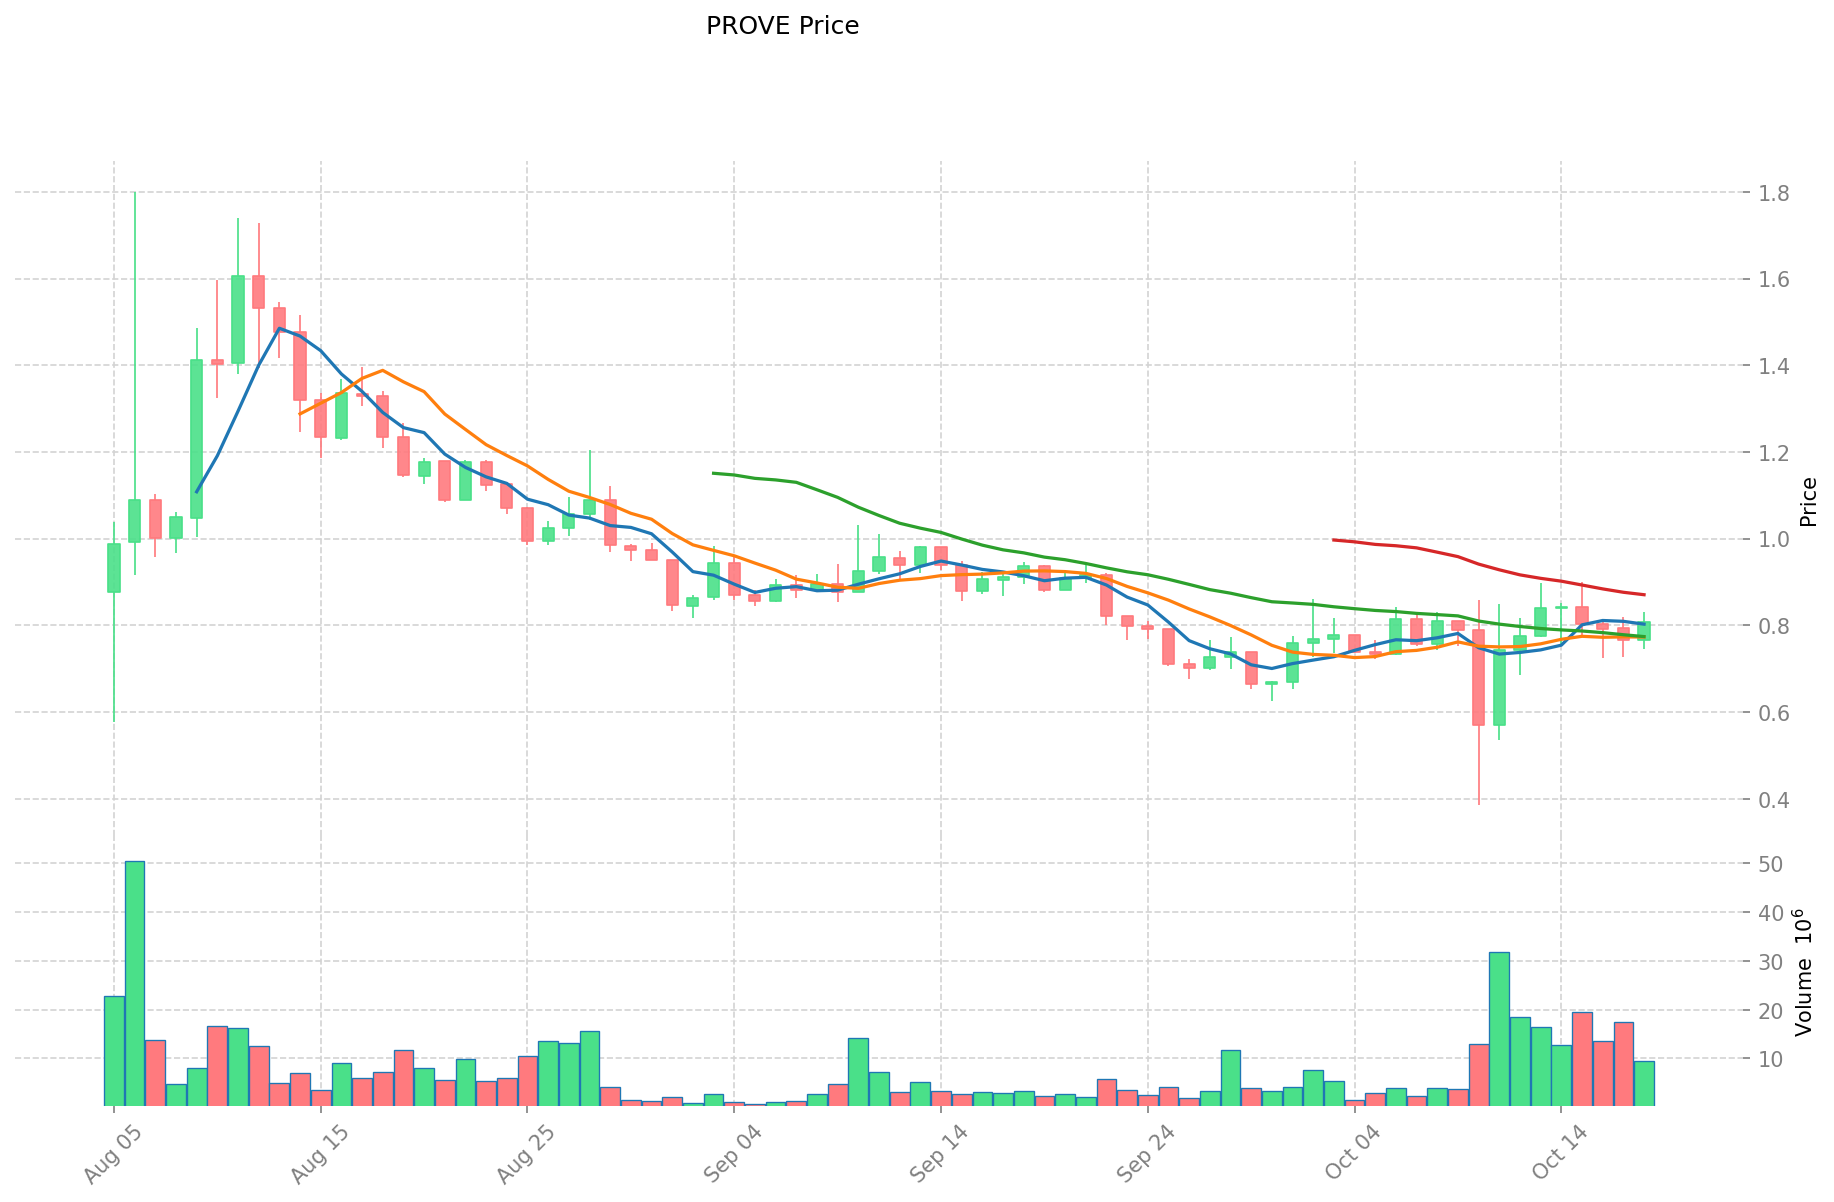
- 2025: PROVE reached its all-time high of $1.8 on August 6, 2025, and its all-time low of $0.3845 on October 10, 2025.
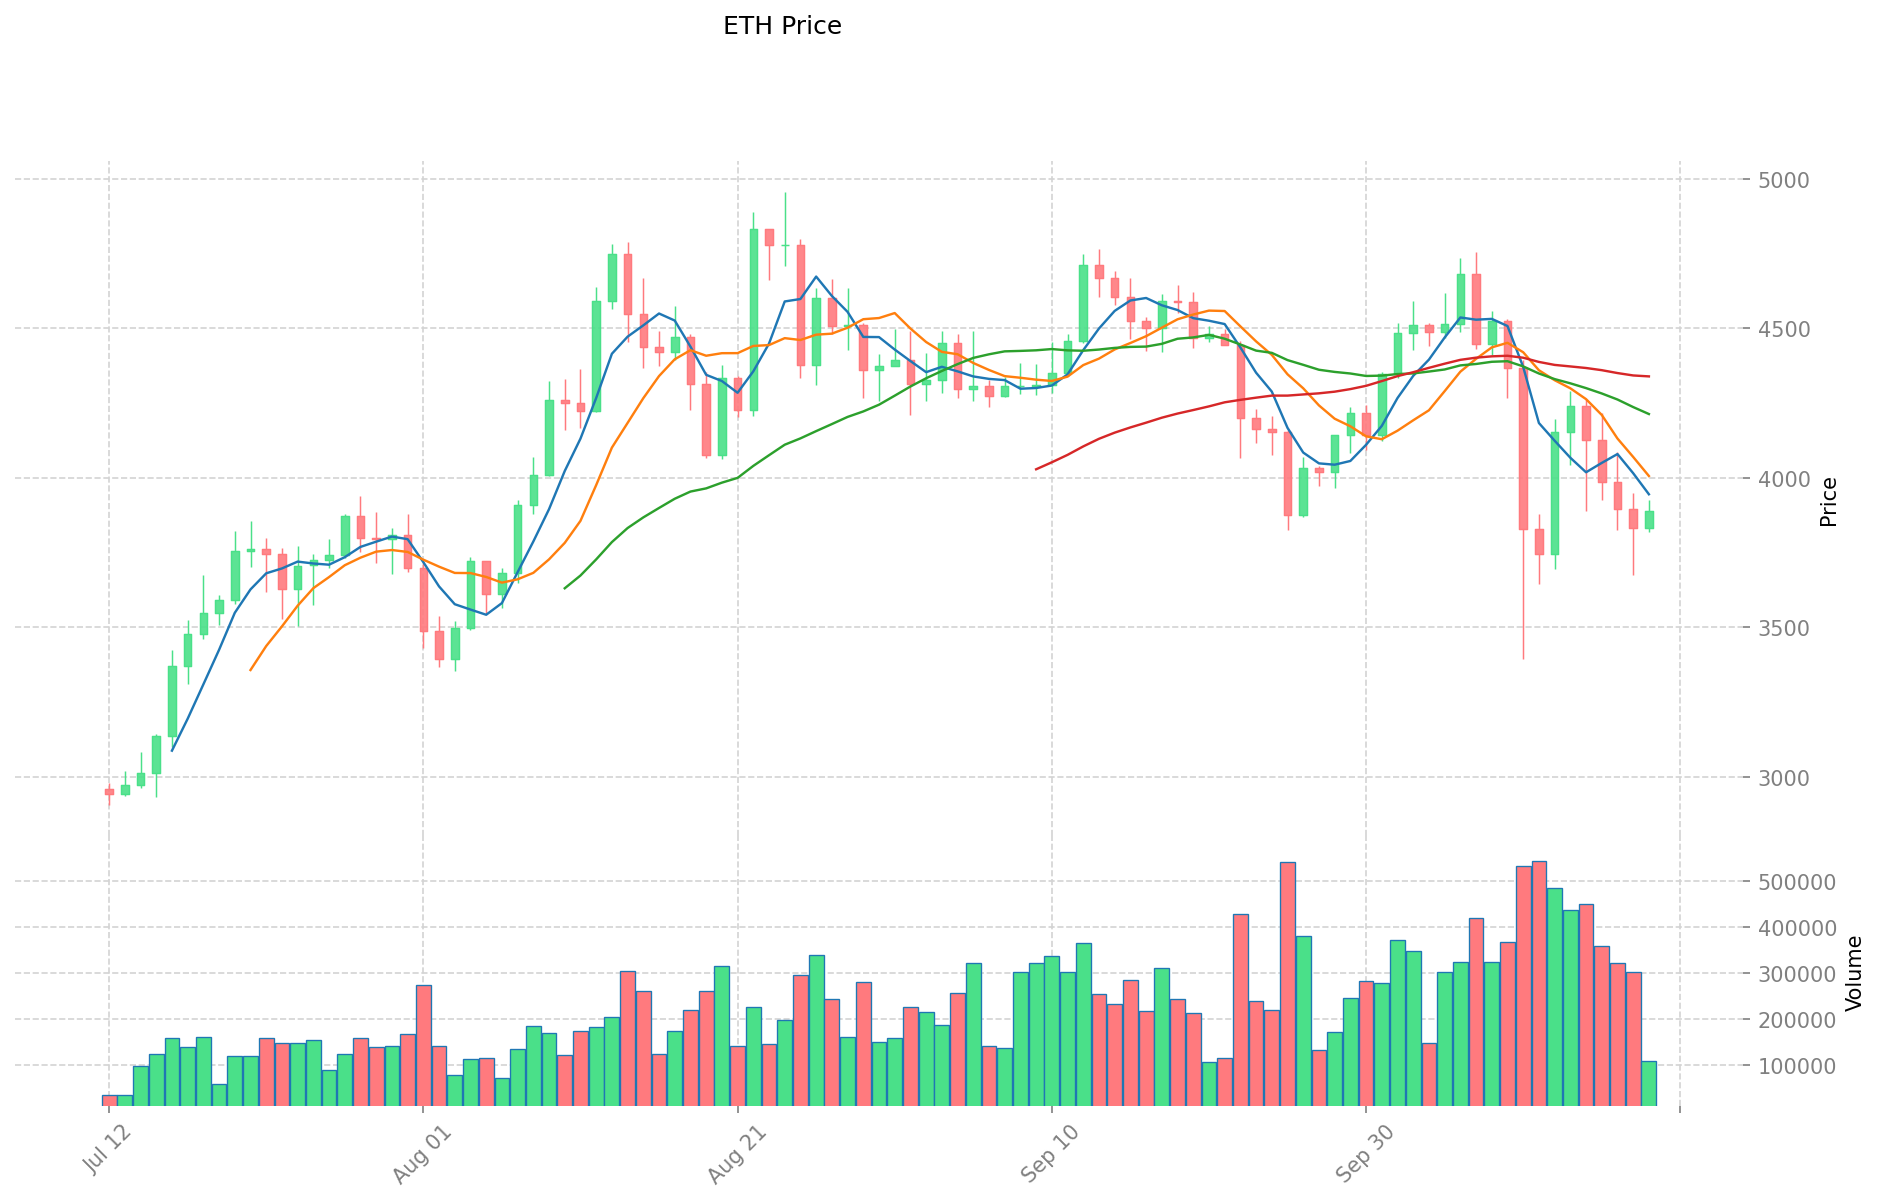
- 2025: ETH achieved its all-time high of $4,946.05 on August 25, 2025.
- Comparative Analysis: In the recent market cycle, PROVE experienced significant volatility, dropping from its high of $1.8 to a low of $0.3845, while ETH has shown more stability, maintaining a price above $3,800.
Current Market Situation (2025-10-19)
- PROVE current price: $0.8361
- ETH current price: $3,885.04
- 24-hour trading volume: PROVE $8,604,141.06 vs ETH $419,558,871.38
- Market Sentiment Index (Fear & Greed Index): 23 (Extreme Fear)
Click to view real-time prices:
- Check PROVE current price Market Price
- Check ETH current price Market Price
II. Core Factors Influencing PROVE vs ETH Investment Value
Supply Mechanism Comparison (Tokenomics)
- PROVE: Fixed maximum supply cap of 1 billion tokens with gradual distribution over 4 years (25% per year)
- ETH: Post-EIP-1559 implementation features a burn mechanism creating potential deflationary pressure
- 📌 Historical pattern: Fixed supply tokens like PROVE tend to create scarcity-driven price discovery, while ETH's burning mechanism potentially reduces inflation and supports long-term value appreciation during high network usage.
Institutional Adoption and Market Applications
- Institutional holdings: ETH has significant institutional support through ETFs and corporate treasury holdings, while PROVE remains in early adoption phase
- Enterprise adoption: ETH is widely used across DeFi, NFTs, and enterprise blockchain solutions; PROVE aims to capture zkRollup infrastructure market
- Regulatory attitudes: ETH has gained regulatory clarity in most jurisdictions as a non-security, while PROVE and other new L2 tokens face evolving regulatory frameworks
Technical Development and Ecosystem Building
- PROVE technical focus: zkRollup infrastructure for Ethereum L2 scalability, supporting transactions bundled and verified cryptographically on mainnet
- ETH technical development: Transitioning toward sharding and further scaling solutions following the successful Merge to proof-of-stake
- Ecosystem comparison: ETH dominates with extensive DeFi ($87B+ TVL), NFT markets, and thousands of dApps; PROVE ecosystem focuses specifically on zkRollup scalability applications
Macroeconomic Factors and Market Cycles
- Inflation environment performance: ETH has demonstrated moderate correlation with risk assets during inflationary periods, while PROVE lacks historical data
- Monetary policy impacts: Both tokens show sensitivity to Federal Reserve policies and risk-asset correlations
- Geopolitical factors: ETH benefits from global liquidity and recognized status; PROVE's value proposition centers on solving Ethereum's scaling limitations
III. 2025-2030 Price Prediction: PROVE vs ETH
Short-term Prediction (2025)
- PROVE: Conservative $0.46 - $0.82 | Optimistic $0.82 - $1.12
- ETH: Conservative $2,445.89 - $3,882.36 | Optimistic $3,882.36 - $5,124.72
Mid-term Prediction (2027)
- PROVE may enter a growth phase, with estimated price range $0.70 - $1.31
- ETH may enter a bullish market, with estimated price range $3,418.19 - $5,746.51
- Key drivers: Institutional inflows, ETF, ecosystem development
Long-term Prediction (2030)
- PROVE: Base scenario $1.14 - $1.62 | Optimistic scenario $1.62 - $1.88
- ETH: Base scenario $5,395.02 - $7,598.63 | Optimistic scenario $7,598.63 - $10,410.12
Disclaimer
PROVE:
| 年份 | 预测最高价 | 预测平均价格 | 预测最低价 | 涨跌幅 |
|---|---|---|---|---|
| 2025 | 1.119144 | 0.8229 | 0.460824 | -1 |
| 2026 | 1.4079819 | 0.971022 | 0.51464166 | 16 |
| 2027 | 1.308452145 | 1.18950195 | 0.7018061505 | 42 |
| 2028 | 1.3988542932 | 1.2489770475 | 0.7493862285 | 49 |
| 2029 | 1.9196777220075 | 1.32391567035 | 0.9135018125415 | 58 |
| 2030 | 1.88128416756735 | 1.62179669617875 | 1.135257687325125 | 93 |
ETH:
| 年份 | 预测最高价 | 预测平均价格 | 预测最低价 | 涨跌幅 |
|---|---|---|---|---|
| 2025 | 5124.7152 | 3882.36 | 2445.8868 | 0 |
| 2026 | 5404.24512 | 4503.5376 | 4233.325344 | 15 |
| 2027 | 5746.5139776 | 4953.89136 | 3418.1850384 | 27 |
| 2028 | 7864.797923136 | 5350.2026688 | 3049.615521216 | 37 |
| 2029 | 8589.7503847584 | 6607.500295968 | 6078.90027229056 | 70 |
| 2030 | 10410.116716297584 | 7598.6253403632 | 5395.023991657872 | 95 |
IV. Investment Strategy Comparison: PROVE vs ETH
Long-term vs Short-term Investment Strategy
- PROVE: Suitable for investors focused on L2 scaling solutions and ecosystem potential
- ETH: Suitable for investors seeking stability and smart contract platform exposure
Risk Management and Asset Allocation
- Conservative investors: PROVE: 10% vs ETH: 90%
- Aggressive investors: PROVE: 30% vs ETH: 70%
- Hedging tools: Stablecoin allocation, options, cross-token portfolio
V. Potential Risk Comparison
Market Risk
- PROVE: High volatility due to lower market cap and trading volume
- ETH: Susceptible to broader crypto market trends and macroeconomic factors
Technical Risk
- PROVE: Scalability, network stability
- ETH: Network congestion, high gas fees during peak usage
Regulatory Risk
- Global regulatory policies may impact both tokens differently, with ETH having more regulatory clarity
VI. Conclusion: Which Is the Better Buy?
📌 Investment Value Summary:
- PROVE advantages: Potential for high growth in L2 scaling solutions market
- ETH advantages: Established ecosystem, institutional adoption, and ongoing technical improvements
✅ Investment Advice:
- New investors: Consider a higher allocation to ETH for stability
- Experienced investors: Balanced approach with both PROVE and ETH based on risk tolerance
- Institutional investors: ETH for established presence, PROVE for potential growth exposure
⚠️ Risk Warning: Cryptocurrency markets are highly volatile. This article does not constitute investment advice. None
FAQ
Q1: What are the main differences between PROVE and ETH? A: PROVE is a newer token focused on zkRollup infrastructure for Ethereum L2 scalability, while ETH is the established foundation for decentralized applications and smart contracts. PROVE has a fixed supply cap of 1 billion tokens, while ETH has a burning mechanism. ETH has wider institutional adoption and a more extensive ecosystem.
Q2: Which token has shown better price stability recently? A: ETH has shown more price stability recently. While PROVE experienced significant volatility, dropping from $1.8 to $0.3845, ETH has maintained a price above $3,800 in the current market cycle.
Q3: How do the supply mechanisms of PROVE and ETH differ? A: PROVE has a fixed maximum supply of 1 billion tokens distributed over 4 years. ETH, post-EIP-1559 implementation, features a burn mechanism that potentially creates deflationary pressure during high network usage.
Q4: What are the key factors influencing the investment value of PROVE and ETH? A: Key factors include supply mechanisms, institutional adoption, market applications, technical development, ecosystem building, and macroeconomic factors such as inflation and monetary policies.
Q5: What are the long-term price predictions for PROVE and ETH by 2030? A: For PROVE, the base scenario predicts $1.14 - $1.62, with an optimistic scenario of $1.62 - $1.88. For ETH, the base scenario predicts $5,395.02 - $7,598.63, with an optimistic scenario of $7,598.63 - $10,410.12.
Q6: How should investors allocate their portfolio between PROVE and ETH? A: Conservative investors might consider allocating 10% to PROVE and 90% to ETH, while more aggressive investors might opt for 30% PROVE and 70% ETH. The exact allocation should be based on individual risk tolerance and investment goals.
Q7: What are the main risks associated with investing in PROVE and ETH? A: PROVE faces higher volatility risk due to its lower market cap and trading volume, as well as potential technical risks related to scalability and network stability. ETH is susceptible to broader crypto market trends, network congestion, and high gas fees during peak usage. Both tokens may be impacted by regulatory risks, though ETH currently has more regulatory clarity.
Share
Content