QUBIC vs KAVA: Comparing Two Emerging Blockchain Platforms for DeFi Innovation
Introduction: QUBIC vs KAVA Investment Comparison
In the cryptocurrency market, the comparison between QUBIC and KAVA has always been a topic that investors cannot ignore. The two not only have significant differences in market cap ranking, application scenarios, and price performance, but also represent different cryptocurrency positioning.
QUBIC (QUBIC): Since its launch, it has gained market recognition for its AI technology integration and high-speed smart contract capabilities.
KAVA (KAVA): Established as a cross-chain decentralized financial platform, it has been recognized for providing mainstream digital asset mortgage and stablecoin services.
This article will comprehensively analyze the investment value comparison between QUBIC and KAVA, focusing on historical price trends, supply mechanisms, institutional adoption, technological ecosystems, and future predictions, attempting to answer the question most concerning investors:
"Which is the better buy right now?"
I. Price History Comparison and Current Market Status
QUBIC (Coin A) and KAVA (Coin B) Historical Price Trends
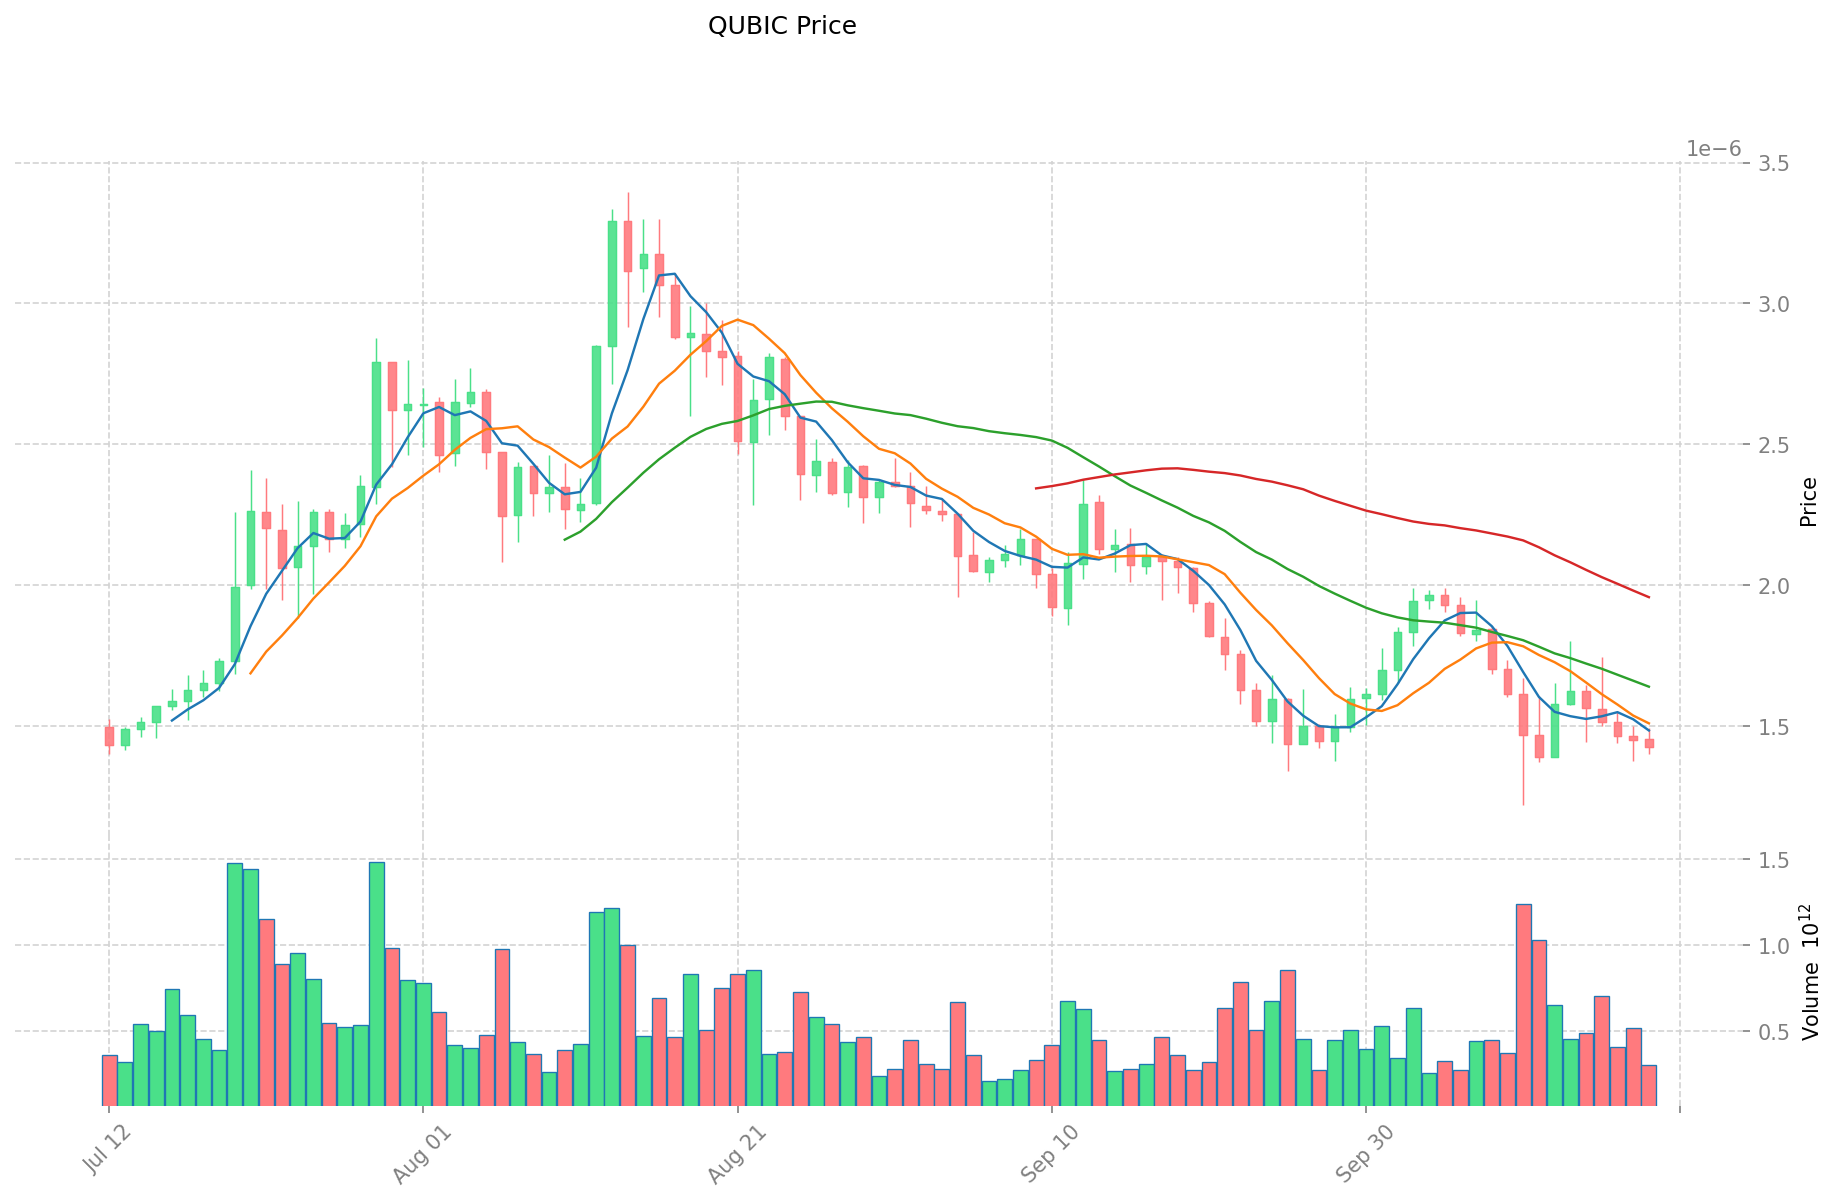
- 2024: QUBIC reached its all-time high of $0.0000076 on May 9, 2024.
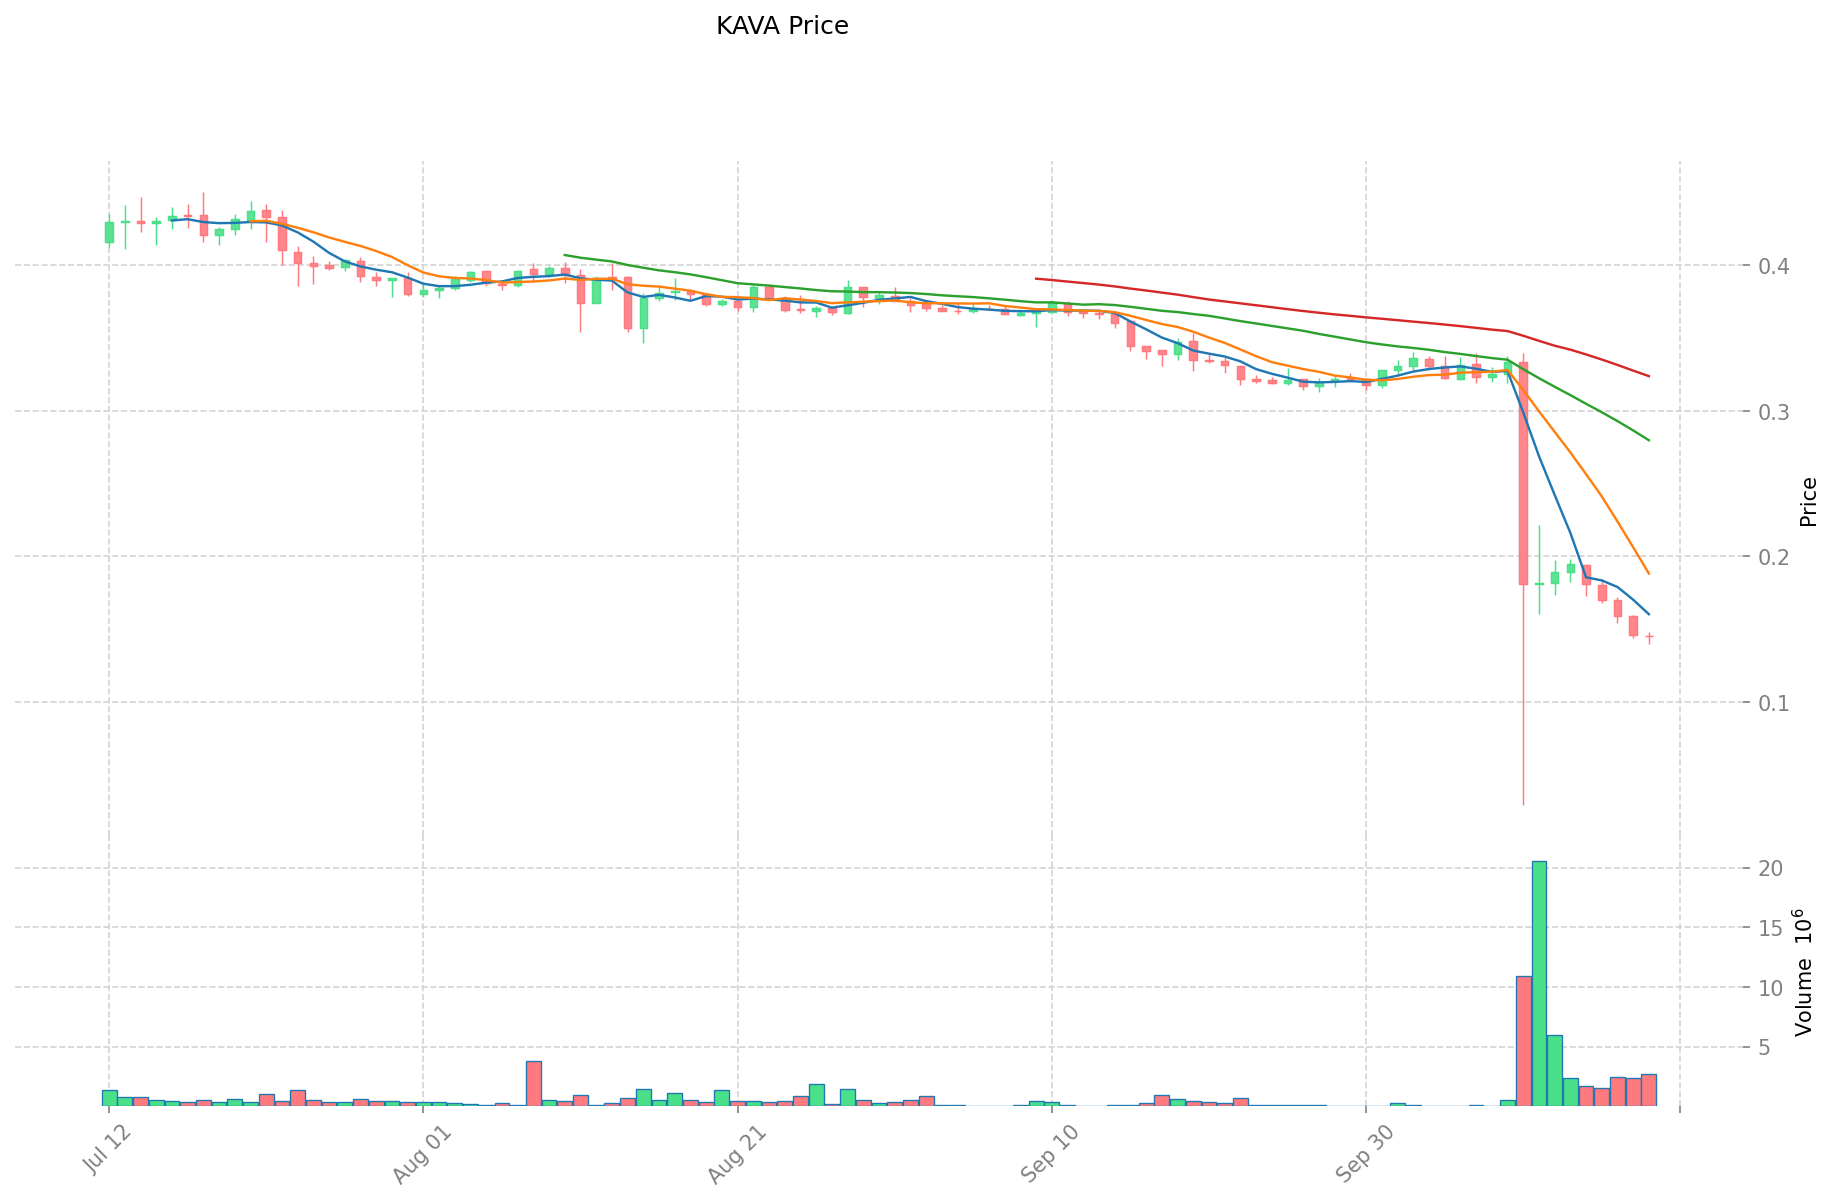
- 2025: KAVA hit its all-time low of $0.138058 on October 11, 2025.
- Comparative analysis: In the recent market cycle, QUBIC dropped from its high of $0.0000076 to a low of $0.0000006999, while KAVA declined from its all-time high of $9.12 to its current price of $0.14523.
Current Market Situation (2025-10-19)
- QUBIC current price: $0.0000014206
- KAVA current price: $0.14523
- 24-hour trading volume: $439,498.35 (QUBIC) vs $393,475.30 (KAVA)
- Market Sentiment Index (Fear & Greed Index): 23 (Extreme Fear)
Click to view real-time prices:
- Check QUBIC current price Market Price
- Check KAVA current price Market Price
II. Core Factors Affecting the Investment Value of QUBIC vs KAVA
Supply Mechanisms Comparison (Tokenomics)
- QUBIC: Uses a proof-of-work consensus mechanism with a fixed total supply cap, creating a scarcity model similar to Bitcoin.
- KAVA: Implements an inflationary model with staking rewards, though with controlled inflation through governance mechanisms and token burns.
- 📌 Historical pattern: Fixed supply models like QUBIC's tend to create price appreciation during demand increases, while KAVA's controlled inflation model balances network security with moderate price stability.
Institutional Adoption and Market Applications
- Institutional holdings: KAVA has gained more institutional recognition with partnerships in the DeFi space, while QUBIC remains primarily retail-focused.
- Enterprise adoption: KAVA has established itself as a cross-chain lending platform with real-world financial applications, whereas QUBIC is still developing its enterprise use cases.
- Regulatory attitudes: KAVA has worked within regulatory frameworks to ensure compliance, giving it an advantage in jurisdictions with stricter crypto regulations.
Technical Development and Ecosystem Building
- QUBIC technical upgrades: Focuses on AI computing capabilities and distributed intelligence networks, positioning itself as an alternative computing paradigm.
- KAVA technical development: Continues building cross-chain infrastructure, recently enhancing its Cosmos-Ethereum interoperability and expanding DeFi capabilities.
- Ecosystem comparison: KAVA has a more mature DeFi ecosystem with lending, borrowing, and yield farming protocols already live, while QUBIC is developing its computing network with potential applications in AI and distributed computing.
Macroeconomic and Market Cycles
- Performance during inflation: QUBIC's fixed supply model theoretically provides better inflation protection, though lacks historical data to confirm this.
- Macroeconomic monetary policy: Both are affected by interest rate changes, with KAVA's yield-generating mechanisms potentially offering advantages during low interest rate environments.
- Geopolitical factors: KAVA's cross-chain functionality makes it more resilient to regional regulatory changes, while QUBIC's distributed computing focus may find demand in regions seeking technological sovereignty.
III. 2025-2030 Price Prediction: QUBIC vs KAVA
Short-term Prediction (2025)
- QUBIC: Conservative $0.000000865041 - $0.0000014181 | Optimistic $0.0000014181 - $0.000001900254
- KAVA: Conservative $0.0839956 - $0.14482 | Optimistic $0.14482 - $0.1506128
Mid-term Prediction (2027)
- QUBIC may enter a growth phase, with expected prices ranging from $0.00000185827824 to $0.000002490092841
- KAVA may enter a steady growth phase, with expected prices ranging from $0.166919532 to $0.18861907116
- Key drivers: Institutional capital inflow, ETF developments, ecosystem growth
Long-term Prediction (2030)
- QUBIC: Base scenario $0.000002373395291 - $0.000002444597149 | Optimistic scenario up to $0.000002444597149
- KAVA: Base scenario $0.23678870970456 - $0.262835467772061 | Optimistic scenario up to $0.262835467772061
Disclaimer: The above predictions are based on historical data and market analysis. Cryptocurrency markets are highly volatile and subject to rapid changes. These projections should not be considered as financial advice. Always conduct your own research before making investment decisions.
QUBIC:
| 年份 | 预测最高价 | 预测平均价格 | 预测最低价 | 涨跌幅 |
|---|---|---|---|---|
| 2025 | 0.000001900254 | 0.0000014181 | 0.000000865041 | 0 |
| 2026 | 0.00000205737948 | 0.000001659177 | 0.00000107846505 | 16 |
| 2027 | 0.000002490092841 | 0.00000185827824 | 0.000001728198763 | 30 |
| 2028 | 0.000002456829661 | 0.00000217418554 | 0.00000136973689 | 53 |
| 2029 | 0.000002431282981 | 0.000002315507601 | 0.00000150507994 | 62 |
| 2030 | 0.000002444597149 | 0.000002373395291 | 0.000001352835315 | 67 |
KAVA:
| 年份 | 预测最高价 | 预测平均价格 | 预测最低价 | 涨跌幅 |
|---|---|---|---|---|
| 2025 | 0.1506128 | 0.14482 | 0.0839956 | 0 |
| 2026 | 0.186122664 | 0.1477164 | 0.109310136 | 1 |
| 2027 | 0.18861907116 | 0.166919532 | 0.14355079752 | 14 |
| 2028 | 0.248877022212 | 0.17776930158 | 0.1653254504694 | 22 |
| 2029 | 0.26025425751312 | 0.213323161896 | 0.14505975008928 | 46 |
| 2030 | 0.262835467772061 | 0.23678870970456 | 0.213109838734104 | 63 |
IV. Investment Strategy Comparison: QUBIC vs KAVA
Long-term vs Short-term Investment Strategies
- QUBIC: Suitable for investors focused on AI technology and distributed computing potential
- KAVA: Suitable for investors seeking DeFi exposure and cross-chain functionality
Risk Management and Asset Allocation
- Conservative investors: QUBIC: 20% vs KAVA: 80%
- Aggressive investors: QUBIC: 60% vs KAVA: 40%
- Hedging tools: Stablecoin allocation, options, cross-currency portfolio
V. Potential Risk Comparison
Market Risk
- QUBIC: High volatility due to lower market cap and trading volume
- KAVA: Exposure to DeFi market fluctuations and cross-chain risks
Technical Risk
- QUBIC: Scalability, network stability
- KAVA: Smart contract vulnerabilities, cross-chain bridge security
Regulatory Risk
- Global regulatory policies may have differing impacts on both assets
VI. Conclusion: Which Is the Better Buy?
📌 Investment Value Summary:
- QUBIC advantages: AI integration, fixed supply model, potential for high growth
- KAVA advantages: Established DeFi ecosystem, cross-chain functionality, institutional adoption
✅ Investment Advice:
- New investors: Consider a small allocation to KAVA as part of a diversified portfolio
- Experienced investors: Balanced approach with both QUBIC and KAVA based on risk tolerance
- Institutional investors: Focus on KAVA due to its more established ecosystem and regulatory compliance
⚠️ Risk Warning: The cryptocurrency market is highly volatile. This article does not constitute investment advice. None
VII. FAQ
Q1: What are the key differences between QUBIC and KAVA? A: QUBIC focuses on AI technology integration and high-speed smart contracts, with a fixed supply model similar to Bitcoin. KAVA is a cross-chain decentralized financial platform offering mainstream digital asset mortgage and stablecoin services, with a controlled inflationary model.
Q2: Which coin has shown better price performance recently? A: Based on the current market data, QUBIC has shown more resilience, dropping from its all-time high of $0.0000076 to $0.0000014206, while KAVA declined from $9.12 to $0.14523.
Q3: How do the supply mechanisms of QUBIC and KAVA differ? A: QUBIC uses a proof-of-work consensus mechanism with a fixed total supply cap, creating scarcity. KAVA implements an inflationary model with staking rewards, controlled through governance mechanisms and token burns.
Q4: Which coin has better institutional adoption? A: KAVA has gained more institutional recognition with partnerships in the DeFi space and has worked within regulatory frameworks, giving it an advantage in jurisdictions with stricter crypto regulations. QUBIC remains primarily retail-focused.
Q5: What are the long-term price predictions for QUBIC and KAVA by 2030? A: For QUBIC, the base scenario predicts a range of $0.000002373395291 to $0.000002444597149. For KAVA, the base scenario predicts a range of $0.23678870970456 to $0.262835467772061.
Q6: How should investors allocate their portfolios between QUBIC and KAVA? A: Conservative investors might consider allocating 20% to QUBIC and 80% to KAVA, while aggressive investors might opt for 60% QUBIC and 40% KAVA. However, individual allocations should be based on personal risk tolerance and investment goals.
Q7: What are the main risks associated with investing in QUBIC and KAVA? A: QUBIC faces high volatility due to lower market cap and trading volume, as well as potential scalability and network stability issues. KAVA is exposed to DeFi market fluctuations, cross-chain risks, and potential smart contract vulnerabilities. Both are subject to regulatory risks depending on global policies.
Share
Content