YFI vs ENJ: Kripto Para Arenasında DeFi Devlerinin Mücadelesi


Giriş: YFI ile ENJ Yatırımı Karşılaştırması
Kripto para piyasasında YearnFinance (YFI) ile Enjin Coin (ENJ) karşılaştırması, yatırımcıların göz ardı edemediği bir başlıktır. İki varlık; piyasa değeri sıralaması, kullanım alanları ve fiyat performansı açısından belirgin farklılıklar gösterirken, kripto varlık konumlandırması bakımından da birbirinden ayrılır.
YearnFinance (YFI): 2020’de piyasaya sürüldüğünden bu yana, kredi platformlarına getiri çıktısı sunan verileri toplayan bir agregasyon platformu olarak piyasanın takdirini kazanmıştır.
Enjin Coin (ENJ): 2017’de piyasaya çıkarılmıştır ve blokzincir tabanlı oyun alanında öncü olarak görülmekte; özellikle oyunlar için sanal varlıklar ve topluluk değeri oluşturmaya odaklanmaktadır.
Bu makalede, YFI ile ENJ’nin yatırım değerleri; geçmiş fiyat hareketleri, arz mekanizmaları, kurumsal benimseme, teknik ekosistemler ve gelecek öngörüleri bakımından kapsamlı şekilde analiz edilecek ve yatırımcıların en çok merak ettiği şu soruya yanıt aranacaktır:
"Şu anda hangisi daha avantajlı bir alım?"
I. Fiyat Geçmişi ve Güncel Piyasa Durumu Karşılaştırması
YFI ile ENJ Geçmiş Fiyat Hareketleri
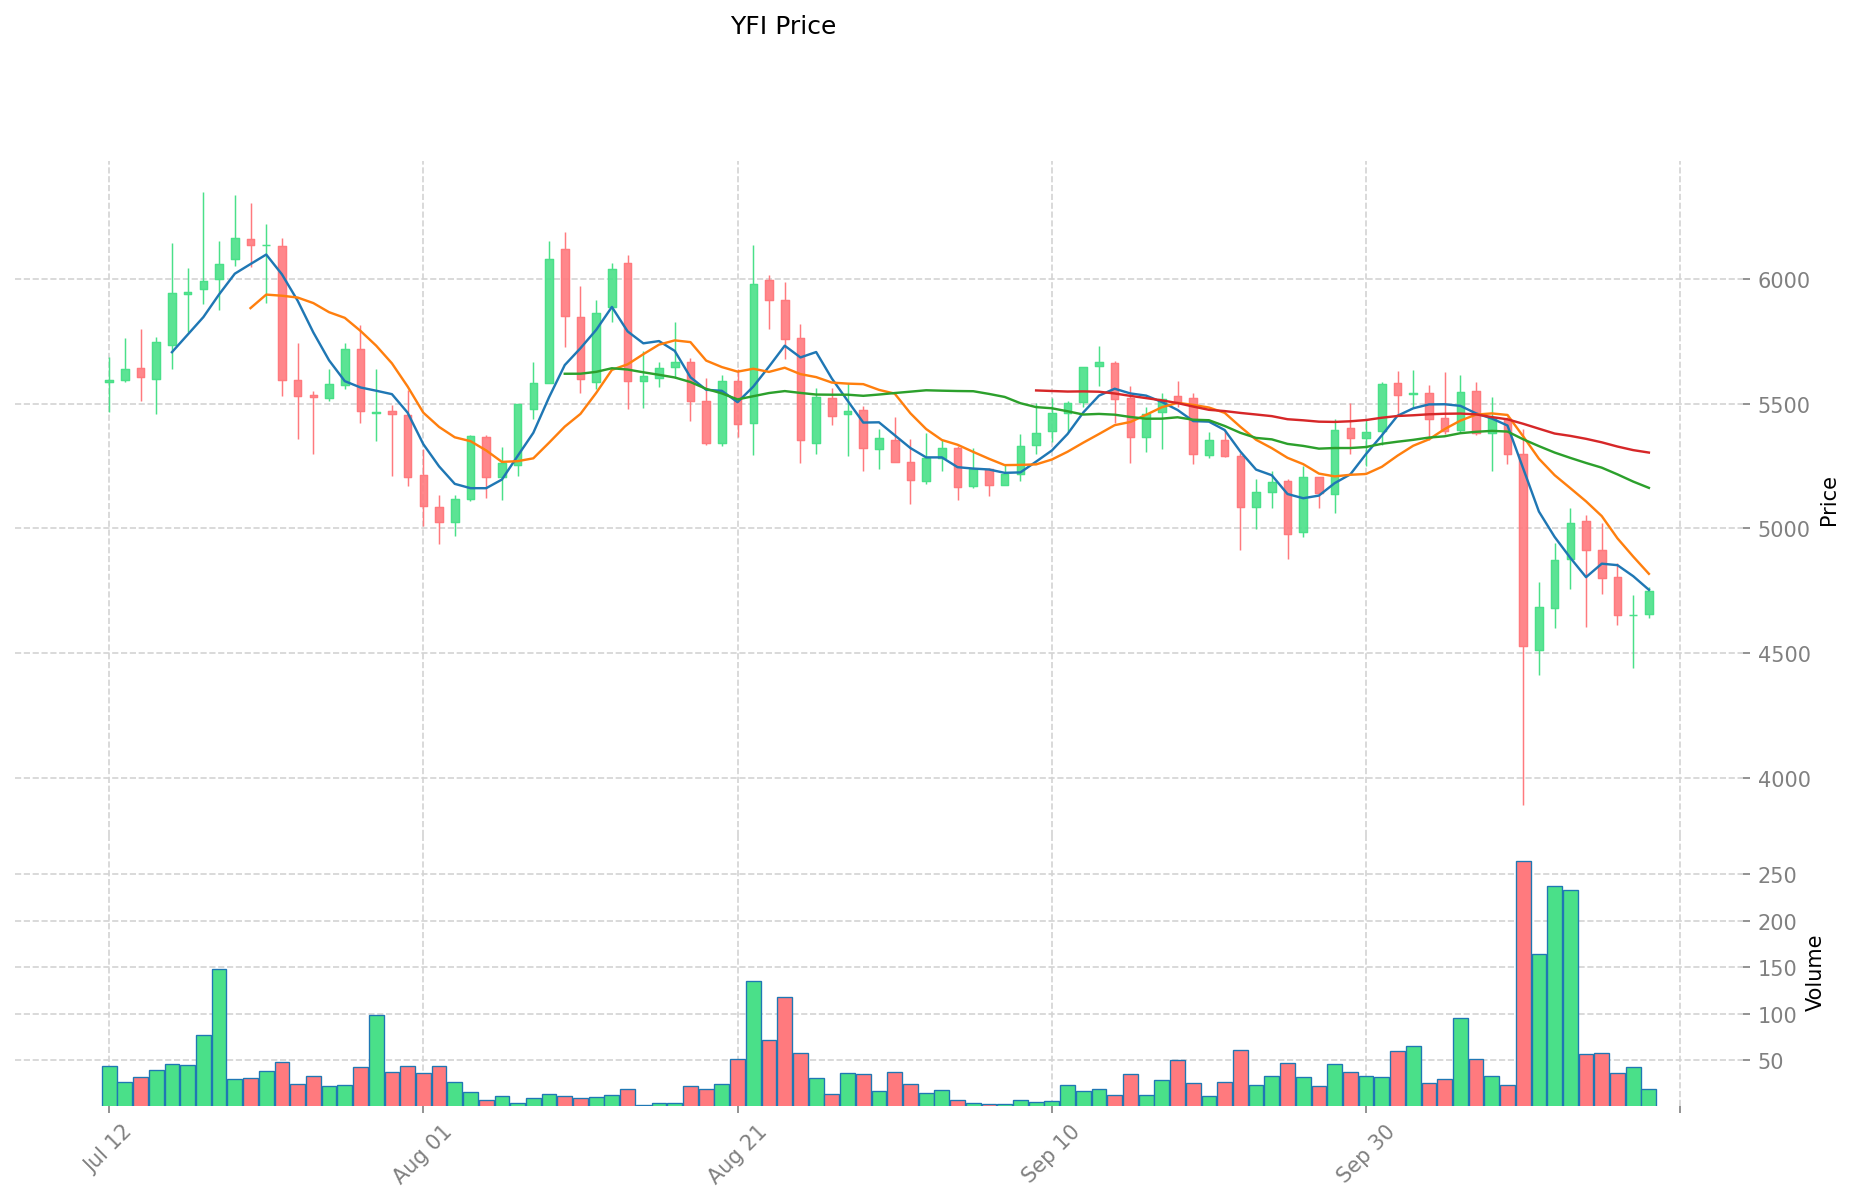
- 2021: YFI, 12 Mayıs 2021’de 90.787 dolar ile tüm zamanların en yüksek seviyesine ulaştı.
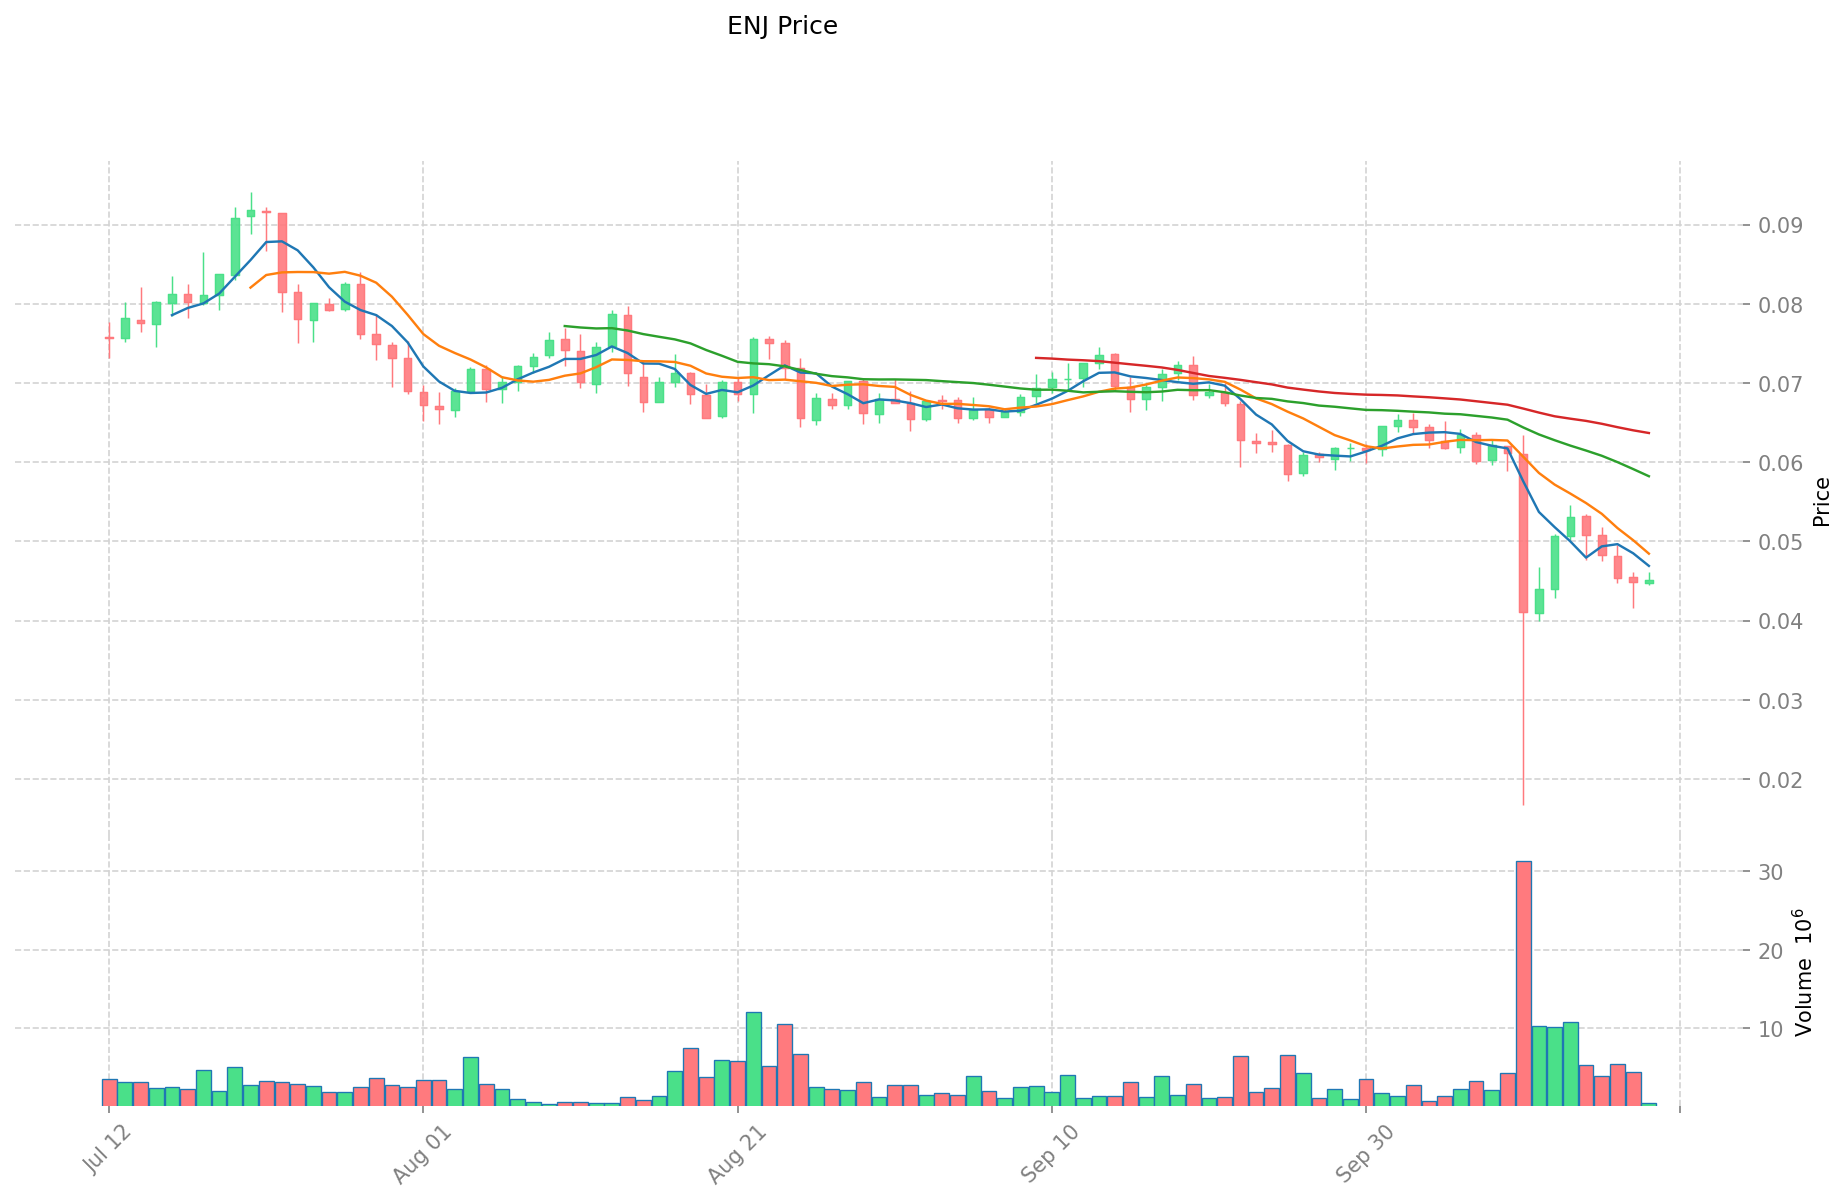
- 2021: ENJ, 25 Kasım 2021’de 4,82 dolar ile zirve yaptı.
- Karşılaştırma: YFI, zirvesinden 90.787 dolardan 4.733 dolara gerilerken; ENJ ise 4,82 dolardan 0,04493 dolara düştü.
Güncel Piyasa Durumu (19 Ekim 2025)
- YFI mevcut fiyatı: 4.733 dolar
- ENJ mevcut fiyatı: 0,04493 dolar
- 24 saatlik işlem hacmi: YFI 91.766,94536 dolar; ENJ 21.106,0028501 dolar
- Piyasa Duyarlılık Endeksi (Korku & Açgözlülük Endeksi): 23 (Aşırı Korku)
Canlı fiyatları görmek için tıklayın:
- YFI güncel fiyatı Piyasa Fiyatı
- ENJ güncel fiyatı Piyasa Fiyatı
II. YFI ile ENJ’nin Yatırım Değerine Etki Eden Temel Unsurlar
Arz Mekanizması Karşılaştırması (Tokenomik)
- YFI: 36.666 adet sabit arz limiti; tüm tokenler önceden üretilmiş
- ENJ: 1 milyar ENJ maksimum arz ve dijital varlıklarda token kilitleme ile deflasyonist mekanizma
- 📌 Geçmişte: YFI’nın sınırlı arzı, yüksek fiyat dalgalanmasına yol açarken; ENJ’nin deflasyonist modeli, varlık üretimiyle dolaşımdan sürekli token çıkışı sağlar.
Kurumsal Benimseme ve Piyasa Uygulamaları
- Kurumsal portföyler: YFI, DeFi yönetim tokeni olarak kurumsal ilgi görürken; ENJ, esas olarak oyun şirketleri ile NFT geliştiricileri tarafından tercih ediliyor
- Kurumsal kullanım: YFI, DeFi protokollerinde getiri optimizasyonu için yönetim tokeni olarak görev yaparken; ENJ, oyun varlıklarının üretimi ve NFT altyapısı için kullanılıyor
- Düzenleyici bakış açısı: Her iki token da farklı ülkelerde regülasyona tabi; oyun odaklı ENJ, DeFi odaklı YFI’ya göre daha az düzenleyici engelle karşılaşabilir
Teknik Gelişim ve Ekosistem Oluşumu
- YFI teknik güncellemeleri: v3 kasalar ile getiri stratejileri ve risk yönetimi iyileştirildi
- ENJ teknik ilerleme: Enjin Beam ile temassız blokzincir deneyimi ve NFT’lere özel Polkadot parachain’i Efinity geliştirildi
- Ekosistem karşılaştırması: YFI, DeFi getiri optimizasyonunda çoklu kasa stratejileriyle güçlü konumunu korurken; ENJ, oyun ve NFT sektörlerinde geliştiricilere blokzincir entegrasyonu sunan araçlarla yer edinmiştir
Makroekonomik Etkiler ve Piyasa Döngüleri
- Enflasyon dönemlerinde performans: YFI, getiri stratejileriyle enflasyona karşı koruma sunabilir
- Makro para politikası: Her iki token da piyasa genelindeki para politikaları ve likiditeye bağlı olarak etkilenir; YFI ve benzeri DeFi tokenleri, likidite şartlarına daha hassastır
- Jeopolitik etkiler: Oyun odaklı ENJ, DeFi regülasyonuna yönelik baskılardan YFI’ya göre daha az etkilenebilir
III. 2025-2030 Fiyat Tahmini: YFI ile ENJ
Kısa Vadeli Tahmin (2025)
- YFI: Muhafazakar 2.601,83 - 4.730,6 | İyimser 4.730,6 - 6.575,534
- ENJ: Muhafazakar 0,0345961 - 0,04493 | İyimser 0,04493 - 0,0507709
Orta Vadeli Tahmin (2027)
- YFI, büyüme dönemine girerek 3.721,69665945 - 8.388,5861213 dolar arası fiyat öngörüleriyle değerlendiriliyor
- ENJ, istikrarlı büyüme ile 0,04260604068 - 0,05224312131 dolar arası bir fiyat aralığına sahip olabilir
- Başlıca etkenler: Kurumsal sermaye girişi, ETF gelişmeleri, ekosistem büyümesi
Uzun Vadeli Tahmin (2030)
- YFI: Temel senaryo 5.166,2175695892762 - 9.935,033787671685 | İyimser senaryo 9.935,033787671685 - 11.623,98953157587145
- ENJ: Temel senaryo 0,037808600499432 - 0,059075938280362 | İyimser senaryo 0,059075938280362 - 0,064983532108398
Feragatname
YFI:
| Yıl | Tahmini En Yüksek | Tahmini Ortalama | Tahmini En Düşük | Değişim Oranı |
|---|---|---|---|---|
| 2025 | 6.575,534 | 4.730,6 | 2.601,83 | 0 |
| 2026 | 6.161,84303 | 5.653,067 | 4.126,73891 | 19 |
| 2027 | 8.388,5861213 | 5.907,455015 | 3.721,69665945 | 24 |
| 2028 | 10.436,110029499 | 7.148,02056815 | 3.931,4113124825 | 51 |
| 2029 | 11.078,00227651887 | 8.792,0652988245 | 4.923,55656734172 | 85 |
| 2030 | 11.623,98953157587145 | 9.935,033787671685 | 5.166,2175695892762 | 109 |
ENJ:
| Yıl | Tahmini En Yüksek | Tahmini Ortalama | Tahmini En Düşük | Değişim Oranı |
|---|---|---|---|---|
| 2025 | 0,0507709 | 0,04493 | 0,0345961 | 0 |
| 2026 | 0,053592504 | 0,04785045 | 0,025839243 | 6 |
| 2027 | 0,05224312131 | 0,050721477 | 0,04260604068 | 12 |
| 2028 | 0,0535415911212 | 0,051482299155 | 0,0422154853071 | 14 |
| 2029 | 0,065639931422625 | 0,0525119451381 | 0,030982047631479 | 16 |
| 2030 | 0,064983532108398 | 0,059075938280362 | 0,037808600499432 | 31 |
IV. Yatırım Stratejisi Karşılaştırması: YFI ile ENJ
Uzun Vadeli ve Kısa Vadeli Yatırım Stratejisi
- YFI: DeFi getiri optimizasyonu ve yönetim potansiyeline odaklanan yatırımcılar için ideal
- ENJ: Oyun ve NFT ekosisteminin büyümesine odaklanan yatırımcılar için uygun
Risk Yönetimi ve Varlık Dağılımı
- Temkinli yatırımcılar için: YFI %30, ENJ %70
- Agresif yatırımcılar için: YFI %60, ENJ %40
- Korumalı portföy araçları: Stablecoin tahsisi, opsiyonlar, çapraz para portföyleri
V. Olası Risk Karşılaştırması
Piyasa Riski
- YFI: Sınırlı arz ve DeFi piyasasının dalgalanması nedeniyle yüksek volatilite
- ENJ: Oyun sektörü trendleri ve NFT piyasası duyarlılığına bağlı risk
Teknik Risk
- YFI: Akıllı kontrat açıkları, ölçeklenebilirlik kısıtları
- ENJ: Ağ tıkanıklığı, birlikte çalışabilirlik sorunları
Düzenleyici Risk
- Küresel regülasyonlar, DeFi odaklı YFI üzerinde daha etkili olabilirken; ENJ, oyun ve NFT alanında daha az denetime tabidir
VI. Sonuç: Hangisi Daha Avantajlı Alım?
📌 Yatırım Değeri Özeti:
- YFI avantajları: DeFi getiri optimizasyonunda güçlü, sınırlı arz, yüksek getiri potansiyeli
- ENJ avantajları: Oyun ve NFT sektörlerinde yerleşik, deflasyonist tokenomik, daha geniş benimsenme potansiyeli
✅ Yatırım Tavsiyesi:
- Yeni yatırımcılar: Oyun sektöründe daha belirgin kullanım nedeniyle ENJ ağırlıklı dengeli bir portföy tercih edilebilir
- Tecrübeli yatırımcılar: DeFi büyüme potansiyeli için YFI’ya yüksek ağırlık, ENJ ile çeşitlendirme sağlanabilir
- Kurumsal yatırımcılar: Hem YFI ile DeFi’ye hem de ENJ ile oyun/NFT sektörüne stratejik portföy oluşturulmalı
⚠️ Risk Uyarısı: Kripto para piyasası son derece oynaktır, bu makale yatırım tavsiyesi içermez. None
VII. Sıkça Sorulan Sorular
S1: YFI ile ENJ arasındaki temel fark nedir? C: YFI, 36.666 tokenlik sınırlı arz ile DeFi getiri optimizasyonuna odaklanır; ENJ ise 1 milyar maksimum arz ve deflasyonist mekanizma ile oyun ve NFT alanına yöneliktir.
S2: Geçmişte hangi token daha iyi fiyat performansı sergiledi? C: YFI, Mayıs 2021’de 90.787 dolar ile daha yüksek bir zirveye ulaştı; ENJ ise Kasım 2021’de 4,82 dolara çıktı. Her ikisi de zirveden bu yana ciddi düşüşler yaşadı.
S3: YFI ile ENJ’nin arz mekanizmaları nasıl ayrışıyor? C: YFI’nın sabit 36.666 token arzı mevcut ve tüm tokenler basıldı. ENJ; 1 milyar maksimum arz ve dijital varlıklarda token kilitleme ile deflasyonist mekanizmaya sahip.
S4: YFI ile ENJ’nin yatırım değerine etki eden başlıca faktörler neler? C: Arz mekanizmaları, kurumsal benimseme, teknik gelişim, ekosistem oluşturma, enflasyon ve para politikası gibi makroekonomik etkenler öne çıkıyor.
S5: 2030’a kadar YFI ve ENJ için uzun vadeli fiyat tahminleri nedir? C: YFI için temel senaryo 5.166,22 - 9.935,03 dolar, iyimser senaryo 9.935,03 - 11.623,99 dolar; ENJ için temel senaryo 0,038 - 0,059 dolar, iyimser senaryo 0,059 - 0,065 dolardır.
S6: YFI ile ENJ için yatırım stratejileri nasıl ayrışıyor? C: YFI, DeFi getiri ve yönetim odaklı yatırımcılar için; ENJ ise oyun ve NFT ekosistemine ilgi duyan yatırımcılar için uygundur. Temkinli yatırımcılar YFI’ya %30, ENJ’ye %70; agresif yatırımcılar YFI’ya %60, ENJ’ye %40 ağırlık verebilir.
S7: YFI ile ENJ’ye yatırımda başlıca riskler nelerdir? C: YFI, sınırlı arz ve DeFi dalgalanmalarıyla yüksek volatiliteye sahip; ENJ ise oyun sektörü ve NFT piyasası trendlerine duyarlı. Her iki token, akıllı kontrat riskleri ve düzenleyici baskılarla karşı karşıya; YFI, DeFi odağı nedeniyle daha fazla regülasyon riski taşır.
Share
Content
Giriş: YFI ile ENJ Yatırımı Karşılaştırması
I. Fiyat Geçmişi ve Güncel Piyasa Durumu Karşılaştırması
II. YFI ile ENJ’nin Yatırım Değerine Etki Eden Temel Unsurlar
III. 2025-2030 Fiyat Tahmini: YFI ile ENJ
IV. Yatırım Stratejisi Karşılaştırması: YFI ile ENJ
V. Olası Risk Karşılaştırması
VI. Sonuç: Hangisi Daha Avantajlı Alım?
VII. Sıkça Sorulan Sorular
How to Buy Cryptocurrency


Trending Cryptocurrencies


HIFI vs ENJ: NFT Ekosisteminde Önde Gelen İki Dijital Varlık Platformunun Karşılaştırılması

Aavegotchi (GHST) Yatırım İçin Uygun mu?: NFT Oyun Tokeni Pazarında Potansiyel Büyüme ve Risklerin Değerlendirilmesi

LISTA ve FLOW: Seyrek Sinyal Kurtarımı İçin İki Yinelemeli Optimizasyon Algoritmasının Karşılaştırılması

GAME2 ve DYDX: Merkeziyetsiz Türev Piyasalarda Liderlik Yarışı

2025 SUPER Fiyat Tahmini: Dijital Varlık Ekosisteminde Piyasa Trendleri ve Yatırım Potansiyelinin Analizi

2025 DEGO Fiyat Tahmini: Uzun Vadeli Büyüme Potansiyeli Açısından Temel Faktörler ve Piyasa Trendlerinin Analizi

Toshi Kripto Varlıklar açıklaması, fiyat görünümü, riskler ve ticaret stratejileri
Hafta sonu vadeli işlem ticareti mümkün mü? Kripto piyasaları ile geleneksel piyasalar arasındaki farklar açıklandı
Hafta sonları vadeli işlem ticareti mümkün mü? Kripto piyasaları ile geleneksel piyasaların farkları detaylı şekilde ele alındı

Sui Hangi Ülkenin? Sui Blockchain’in Kökenleri Hakkında Bilgi Edinmek

Birleşik Krallık Hazine Bakanlığı Kripto Düzenleyici Çerçevesini Duyurdu: Şirketler 2027’ye Kadar Nelere Dikkat Etmeli