Bitcoin (BTC) continues to hold steady around the $70,000 mark despite escalating tensions in the Middle East, which are driving oil prices higher and raising concerns about global inflation pressures. Data from the derivatives market shows a strong return of retail investors, evidenced by a significant increase in new positions. Meanwhile, altcoins such as Internet Computer (ICP), Hyperliquid (HYPE), and Render (RENDER) stand out with impressive gains, leading the market rally over the past 24 hours.
Crypto Market Remains Resilient Despite Oil Price Fluctuations
West Texas Intermediate (WTI) crude oil surged 7% on Thursday, reaching $92 per barrel, after Iran attacked two oil tankers in Iraqi waters on Wednesday, heightening geopolitical tensions in the Middle East.
To curb the rising oil prices, the International Energy Agency (IEA) approved a plan to release 400 million barrels from emergency reserves. Additionally, the United States proposed releasing an extra 172 million barrels from strategic reserves to stabilize supply.
In another development, Donald Trump approved expanding offshore oil drilling off Southern California. The US leader also reaffirmed that Washington will soon complete its campaign against Iran.
Energy tensions are putting pressure on global financial markets, raising fears of a return to inflation. However, the cryptocurrency market remains relatively stable amid macroeconomic volatility.
At the time of writing on Thursday, Bitcoin traded around $70,000, up more than 5% for the week.
Derivatives and On-Chain Data
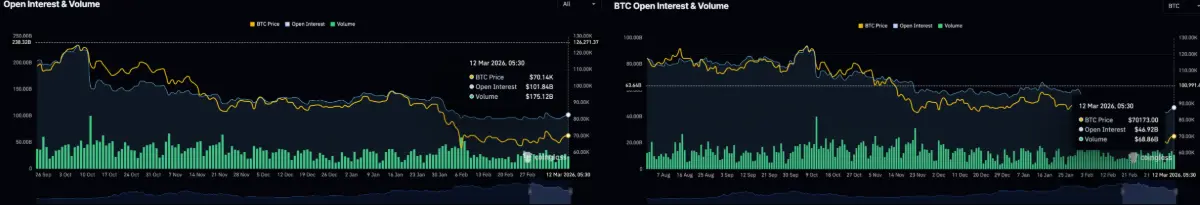
In the derivatives market, open interest (OI) across the entire crypto sector increased to $101.84 billion, up from $99.88 billion on Wednesday, with trading volume reaching $175.12 billion, indicating active speculative activity.
Notably, Bitcoin futures open interest rose to $46.92 billion from $46.06 billion previously, showing continued capital inflow into BTC-related derivatives.
 Open interest data | Source: CoinGlassHowever, Bitcoin’s long/short ratio decreased to 0.9713, signaling a somewhat bearish market sentiment in the short term.
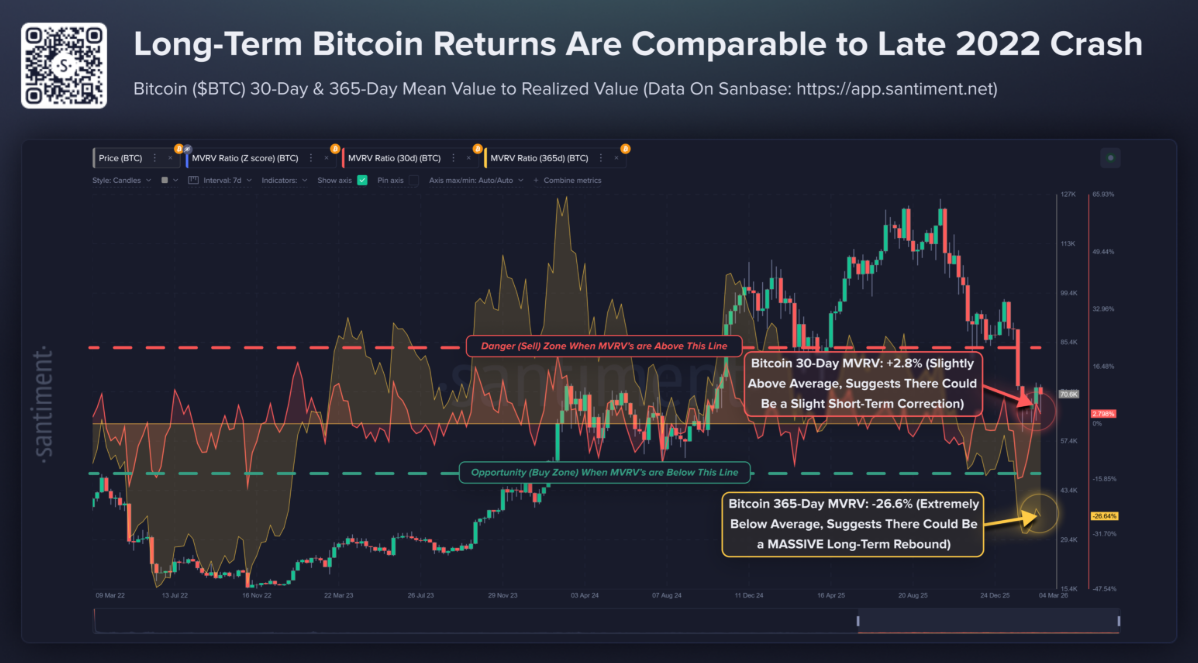
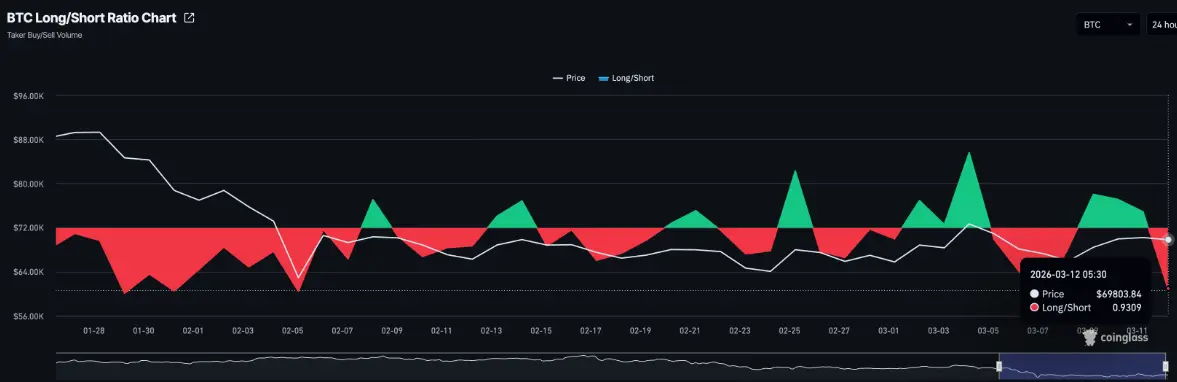 Bitcoin long/short ratio | Source: CoinGlassOn-chain metrics from Santiment reveal that the 365-day MVRV ratio for BTC is significantly below its average, suggesting a oversold condition with potential for long-term price appreciation. Conversely, the 30-day MVRV remains near its average, indicating that short-term volatility risks have not been fully eliminated.
Strong Performers: ICP, HYPE, and RENDER Lead Gains
Internet Computer (ICP) declined about 4% at the time of writing on Thursday, after experiencing a nearly 12% surge the previous day.
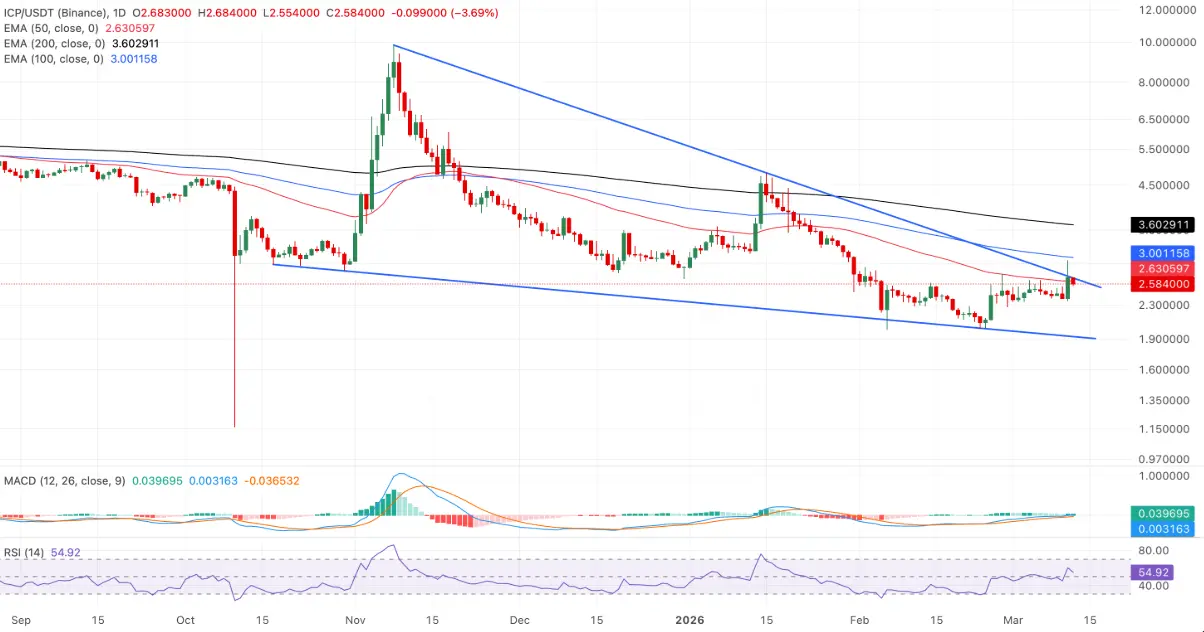 Daily ICP/USDT chart | Source: TradingView Despite a short-term correction, the lower timeframe trend remains mildly bullish. The price rebounded from support around $2.30 and broke above recent trading ranges, indicating renewed buying interest. The MACD remains above its signal line and above zero, reflecting strengthening bullish momentum. Meanwhile, RSI hovers around 54 — a neutral yet positive zone, suggesting room for further upside without being overbought.
However, ICP’s long-term technical outlook remains cautious as the price stays below the 50, 100, and 200-day EMAs. This indicates the primary trend is still downward, and the current rally may be a corrective move within a broader downtrend.
Key resistance levels are near $2.68 — the recent high — before aiming for $2.80. Support levels are around $2.45 and $2.30. If selling pressure intensifies, the $2.20 zone could serve as the next support area.
Hyperliquid (HYPE) is approaching the $40 mark after gaining about 6% on Wednesday. Currently trading around $38, HYPE remains above its 50, 100, and 200-day EMAs, signaling a more positive market trend following previous corrections.
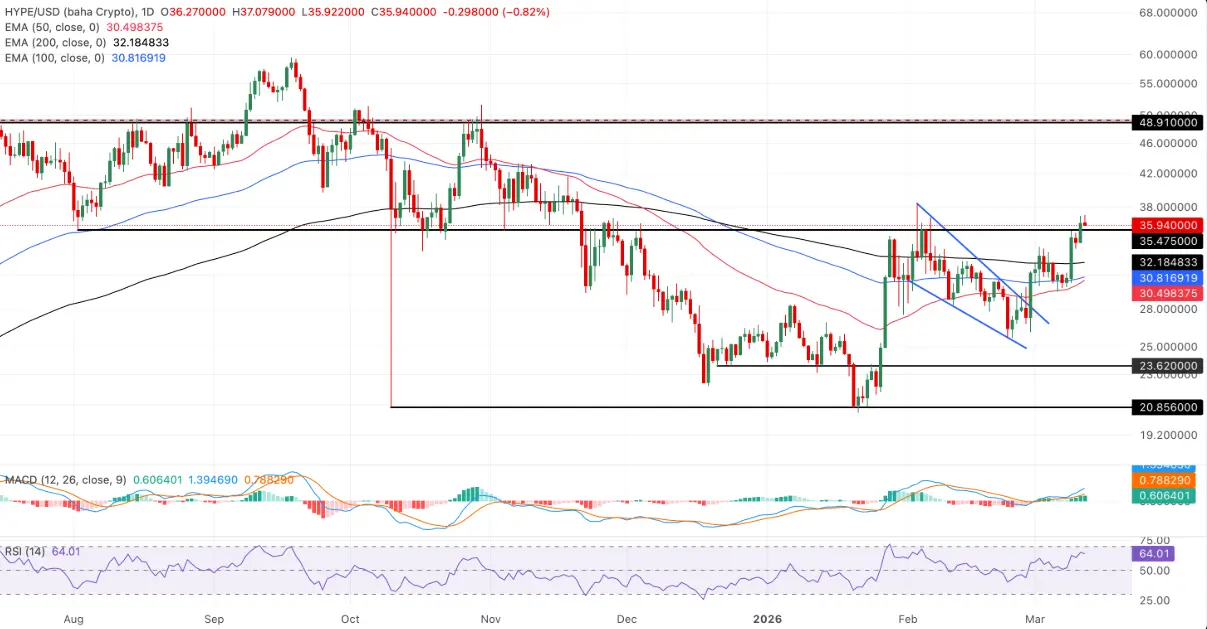 Daily HYPE/USDT chart | Source: TradingView Technical resistance is near $36.25, with the psychological level at $40 as the next target. A decisive close above $40 could extend the rally toward $50.
Bullish momentum is supported by the MACD staying above its signal line and the histogram expanding, indicating increasing buying strength. RSI at 64 suggests there’s still room for upside without entering overbought territory.
Support levels are around $32.80–$32.20, where recent trendlines and the 200-day EMA converge, providing a cushion if a correction occurs.
Render (RENDER) is approaching a key resistance zone near the 50-day EMA at $1.51 after a midweek rebound. A close above this level could push the price toward $1.60. Further resistance lies at $1.70, where the 100-day EMA intersects, representing the next major hurdle for bulls.
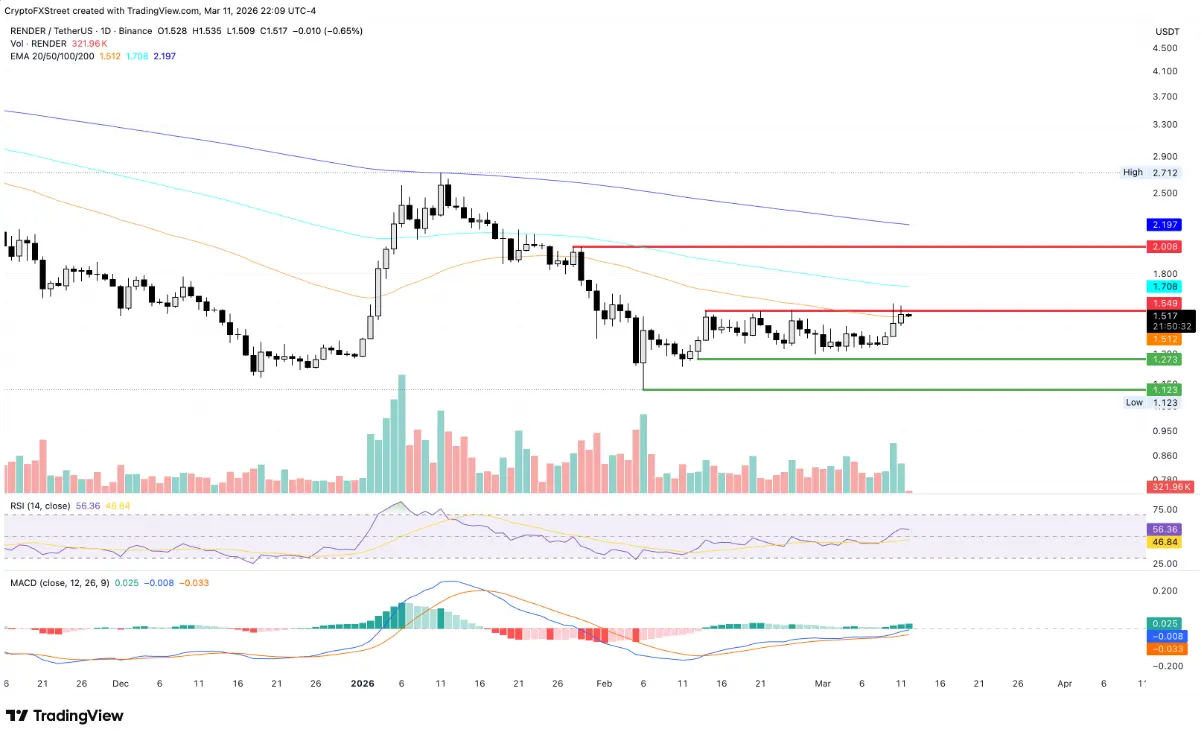 Daily RENDER/USDT chart | Source: TradingView Short-term technical signals remain mildly bullish. The MACD stays above its signal line, with the histogram widening, indicating momentum is strengthening. RSI around 55 suggests ongoing recovery potential without overbought conditions.
If a correction occurs, support is near $1.47 — the recent breakout zone. If this level is broken, next supports are at $1.43 and $1.36, aligned with recent lows.
Nour
Disclaimer: The information on this page may come from third parties and does not represent the views or opinions of Gate. The content displayed on this page is for reference only and does not constitute any financial, investment, or legal advice. Gate does not guarantee the accuracy or completeness of the information and shall not be liable for any losses arising from the use of this information. Virtual asset investments carry high risks and are subject to significant price volatility. You may lose all of your invested principal. Please fully understand the relevant risks and make prudent decisions based on your own financial situation and risk tolerance. For details, please refer to
Disclaimer.