Author: Benji Siem, IOSG
1. Introduction
This research begins with a simple observation: the power system is being asked to perform a task it was never designed for.
As the penetration of renewable energy accelerates, electrification advances across sectors, and AI-driven data centers demand surges, the traditional model of “building more generation and transmission capacity to meet peak loads” is breaking down. Infrastructure buildout cycles are too long, grid interconnection queues are backloged, and capital intensity remains high.
Against this backdrop, flexibility—the ability to dynamically adjust supply and demand in real time—has risen from a supporting function to a core pillar of grid reliability. The flexibility previously supplied mainly by large industrial loads and peaking plants is evolving into a complex multi-layered market, coordinating distributed energy resources (DER), software platforms, and aggregators to balance millions of assets.
We are at a structural inflection point. Winners in this transition will not be the players controlling generation assets, but those building the connectivity and orchestration layers, enabling large-scale flexibility deployment. Emerging crypto-native coordination models and token-based incentives could further accelerate this shift, enabling decentralized participation, transparent settlement, and global liquidity for flexibility services.
As this paper explores in depth, flexibility is no longer just a technical capability; it is becoming an emerging economic infrastructure—creating new value pools through revenue stacking across capacity markets, ancillary services, demand response, and local markets, reshaping how energy is traded, managed, and monetized.
Core Thesis
The electricity flexibility market is at a tipping point. Rising renewable penetration, growing data center demand, and regulatory pushes are creating a structural imbalance between supply and demand for flexibility services.
- The demand for power to fuel AI and application development is rapidly outpacing grid supply capacity, driven by:
- Global data center electricity consumption projected to double by 2030 to about 945 TWh, slightly above Japan’s current total electricity use. AI is the primary driver of this growth, alongside increasing demand for other digital services. Notably, lack of flexibility could become a bottleneck for AI expansion.
Power markets urgently need operational efficiency and flexibility to mitigate risks. Under infrastructure buildout delays, the demand and necessity for flexibility services are rising sharply.
- Many regions’ grids are under immense stress: it’s estimated that unless capacity risks are addressed, about 20% of planned data center projects could face delays.
- In the US, grid operator congestion issues mean roughly 10,300 projects are queued, with a total capacity of 2,300 GW—twice the current total installed generation capacity.
The middle layer of aggregation and connectivity infrastructure will be the biggest winner. It bridges the supply side (users with idle capacity) and the demand side (strained grid operators).
- Software-centric platforms that aggregate and optimize DER will capture disproportionate value as the market expands from about $98.2 billion in 2025 to roughly $293.6 billion in 2034 (CAGR 12.94%).
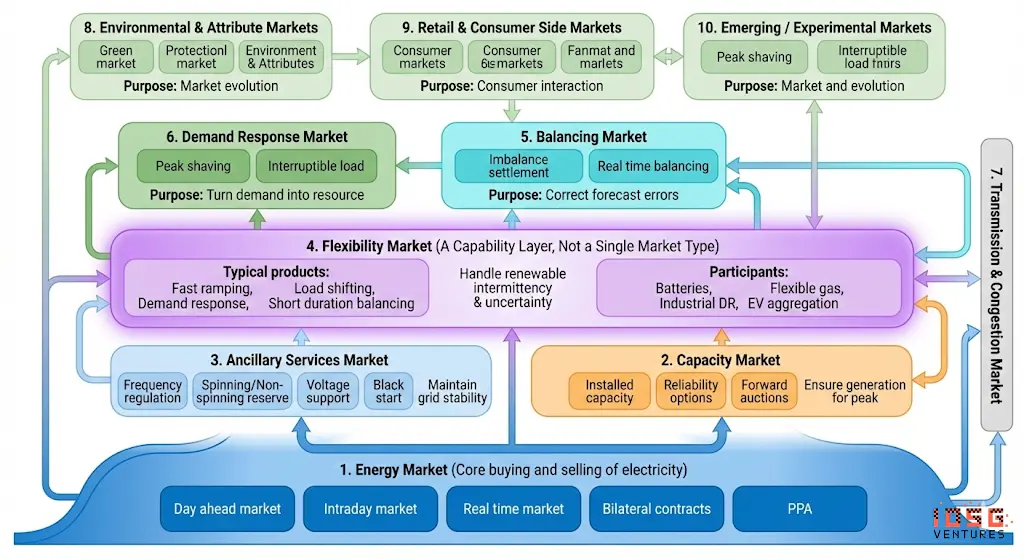
2. Overview of Flexibility Markets
What is flexibility in energy markets?
In power systems, flexibility = the ability to rapidly adjust generation and/or demand in response to signals (electric prices, grid congestion, frequency, etc.) to maintain supply-demand balance and prevent outages.
Historically, flexibility came almost entirely from flexible generators (gas peaking plants, hydro). As renewable energy and electrification scale up, system operators now also procure flexibility from:
- Demand Response: load reduction or shifting
- Storage: batteries, EVs, thermal storage
- Distributed Generation: rooftop PV, small CHP
A “flexibility market” is a collection of markets and contracts where flexibility is bought and sold, including wholesale markets, balancing/ancillary services, capacity markets, and local distribution system platforms. Aggregators act as intermediaries, providing platforms that enable grid operators to procure flexibility from end-users, forming a critical infrastructure layer (see “Flexibility Trading and Pricing” chapter). Settlements are handled by transmission system operators (TSOs), who pay aggregators, who deduct commissions and pay customers.

Flexibility delivery modes:
- Implicit Flexibility: achieved automatically via static price signals, e.g., time-of-use tariffs. For example, smart EV chargers delay charging until night low-price periods. Behavior driven by price signals.
- Explicit Flexibility: involves active response to specific grid operator requests. These behaviors are consciously executed and coordinated via market platforms for direct compensation.
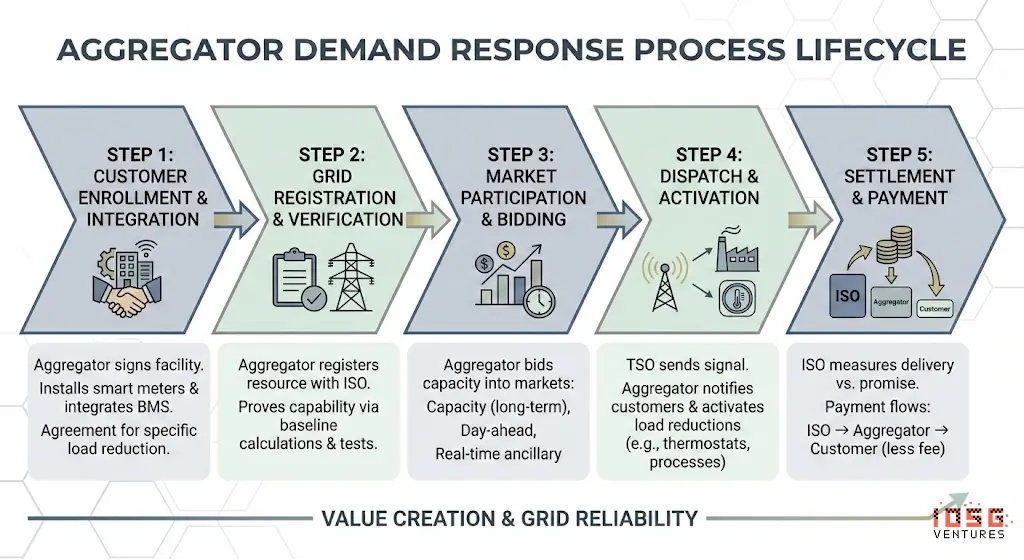
Detailed Example
#Step 1: Customer Registration
Aggregator (e.g., CPower) signs a manufacturing company, installs monitoring devices (smart meters, controllers), and connects to its building management system. Customer agrees to reduce 2 MW load when called upon.
#Step 2: Register with Grid Operator
Aggregator registers this 2 MW (along with thousands of other sites) as a “demand response resource” with ISO. Must demonstrate capability, including baseline calculation, metering protocols, sometimes testing dispatch.
#Step 3: Market Participation
Aggregator bids capacity into various markets:
- Capacity Market (annual/multi-year): “I commit to keep 500 MW available during summer peaks”
- Day-Ahead Energy Market: “I can reduce 200 MW between 16:00-20:00 tomorrow”
- Real-Time Ancillary Services: “I can respond within 10 minutes to frequency deviations”
#Step 4: Dispatch
When grid needs flexibility, TSO sends signal to aggregator. The aggregator’s platform executes: sends notifications (SMS, email, auto-control signals); activates pre-programmed load reductions (e.g., raise thermostat setpoints, dim lighting, pause industrial processes); monitors real-time performance.
#Step 5: Settlement
Post-event, ISO measures actual delivered vs. committed. Funds flow: ISO → aggregator → customer (minus aggregator’s fee).
3. Key Participants
Exchanges — Market Platforms
Flexibility trading venues that match buyers (DSO/TSO) with sellers (aggregators, DER owners). Fast frequency reserve markets also provide another trading platform.
#Representative Projects
EPEX SPOT, Nord Pool, Piclo Flex, NODES, GOPACS, Enera
#Business Models
- Cleared transaction fees (typically 0.5-2% of trade value or €0.01-0.05/MWh)
- Market access subscription/membership fees (annual participant fees)
- Some platforms operate as regulated utilities (recover costs via grid tariffs), others commercially
#Pricing
- Platforms do not set prices but facilitate price discovery via auctions (pay-as-bid or uniform clearing)
- Local flexibility platforms (Piclo, NODES) congestion prices typically €50-200/MWh
- Wholesale balancing markets can spike above €1,000+/MWh during scarcity
- Classic wholesale markets (e.g., EPEX) may have negative prices, effectively representing active procurement of flexibility in dedicated markets
Aggregators / Virtual Power Plants (VPPs)
Control clusters of flexible assets; revenues depend on winning contracts and proper dispatch.
#Representative Companies
Enel X, CPower, Voltus, Next Kraftwerke, Flexitricity, Limejump
#Business Models
- Revenue sharing with asset owners: 20-50% of market revenues retained by aggregator, rest paid to customers
- Some charge upfront registration or monthly SaaS fees
- Possible performance bonuses for exceeding utility dispatch targets
#Pricing
- Capacity payments: $30-150/kW·year (varies by market/product)
- Energy payments: pass-through of market prices (minus aggregator profit)
- Typical customer returns: C&I load $50-200/kW·year, residential batteries $100-400/year
DERMS / Optimization Software
Smart software for forecasting, control, bidding, and compliance, forming the intelligent layer of the system. Can be embedded within aggregator platforms.
#Representative Companies
AutoGrid (Uplight), Enbala (Generac), Opus One, Smarter Grid Solutions, GE GridOS, Siemens EnergyIP
#Business Models
- Enterprise SaaS licenses: annual contracts based on MW managed or assets controlled
- Implementation/integration fees: one-time project costs for utilities ($500K–$5M+)
- Managed services: ongoing optimization-as-a-service based on performance
#Pricing
- Software licenses typically $2-10/kW·year (varies by features and scale)
- Total contract value for large utility DERMS deployments can reach $50-200 million+ (over 5+ years)
- Some vendors offer revenue sharing (5-15% of incremental value)
Asset Side
Physical supply-side assets: EVs, batteries, thermostats, heat pumps, industrial loads, etc.
Power buyers
Demand-side: utilities and system operators procuring flexibility to manage congestion, balance, and peaks, including DSO, TSO, vendors, municipal utilities.
#Representative Agencies
PJM, CAISO, National Grid ESO, TenneT, UK Power Networks, E.ON, Con Edison
#Business Models
- Regulated entities recovering costs via grid tariffs or capacity charges
- Procurement when flexibility is cheaper than infrastructure upgrades (“non-wires alternatives”)
- Some vertically integrated utilities internalize DR projects, others outsource to aggregators
#Procurement Pricing
- Capacity: $20-330/MW·day (PJM auction 2026-27 hits $329/MW·day)
- Ancillary services: $5-50/MW·hour (frequency response, spinning reserves)
- Local flexibility (DSO): €50-300/MWh (auction-based, bid-based)
- Rule of thumb: flexibility must be 30-40% cheaper than grid reinforcement
#Fig 1: Mechanism Illustration
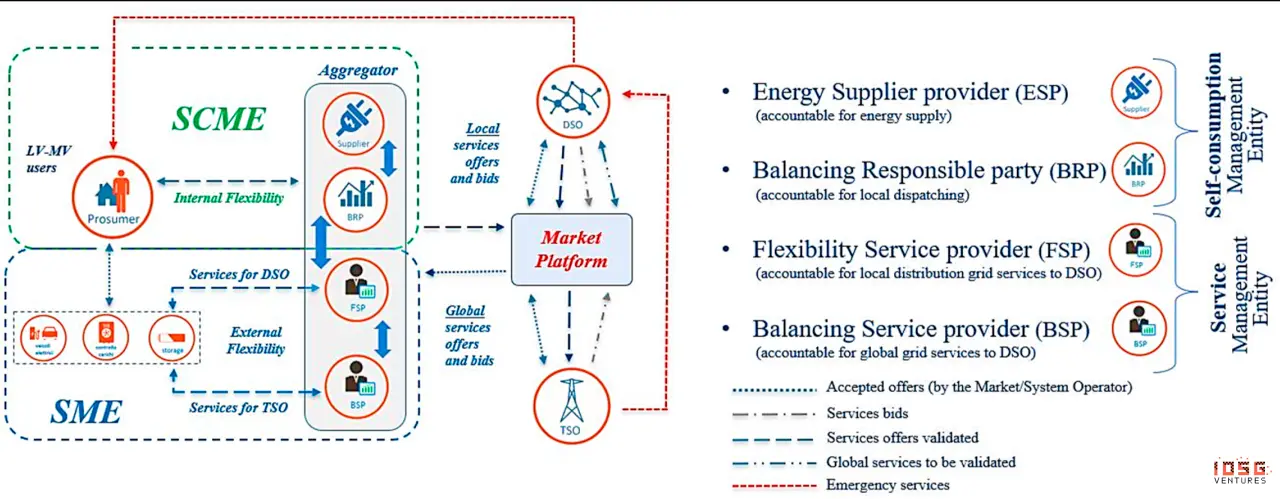
- Distribution System Operator (DSO): manages local distribution network (lines, substations), responsible for delivering power from main transmission to homes and businesses.
- Transmission System Operator (TSO): manages high-voltage grid (power lines, gas pipelines), responsible for long-distance energy transport from producers to local distributors or large consumers.
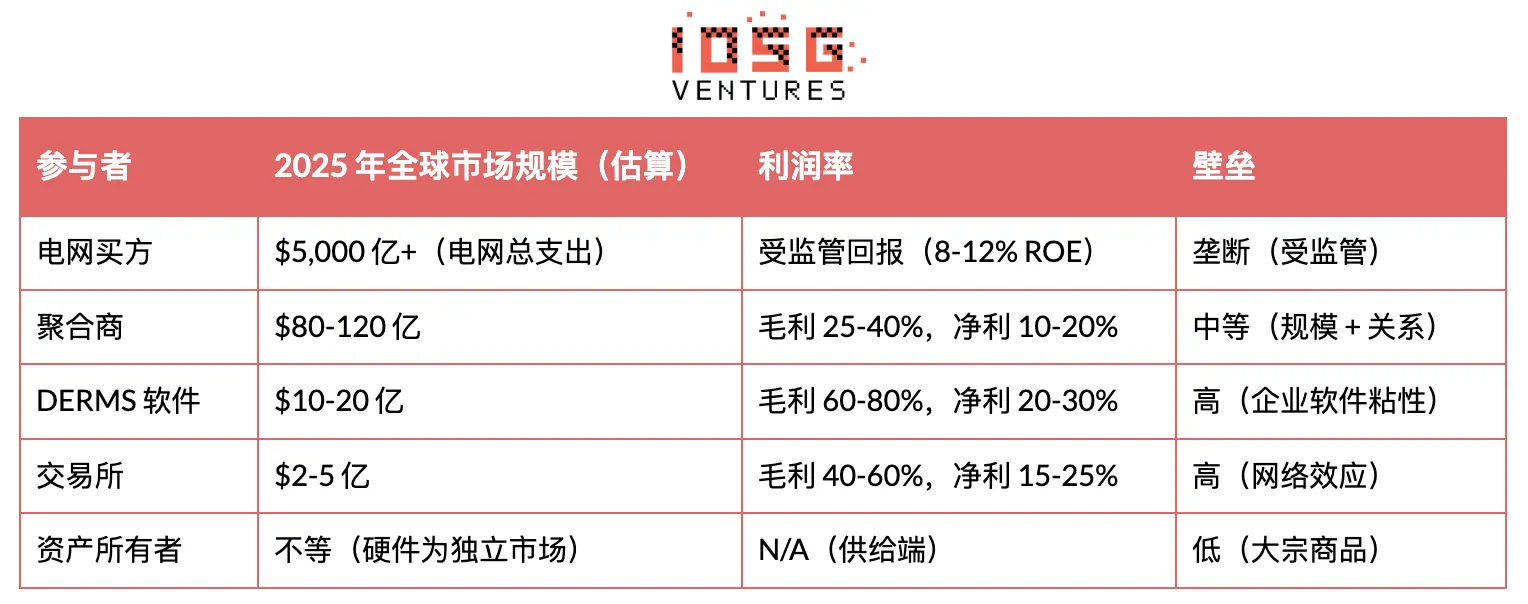
Participant Revenue Scale Estimates
4. Industry Status
The power system faces a fundamental supply-demand imbalance in generation capacity and grid infrastructure. This manifests in two interconnected issues: unprecedented interconnection queue backlog and surging demand from electrification and data centers.
Interconnection Queue Backlog
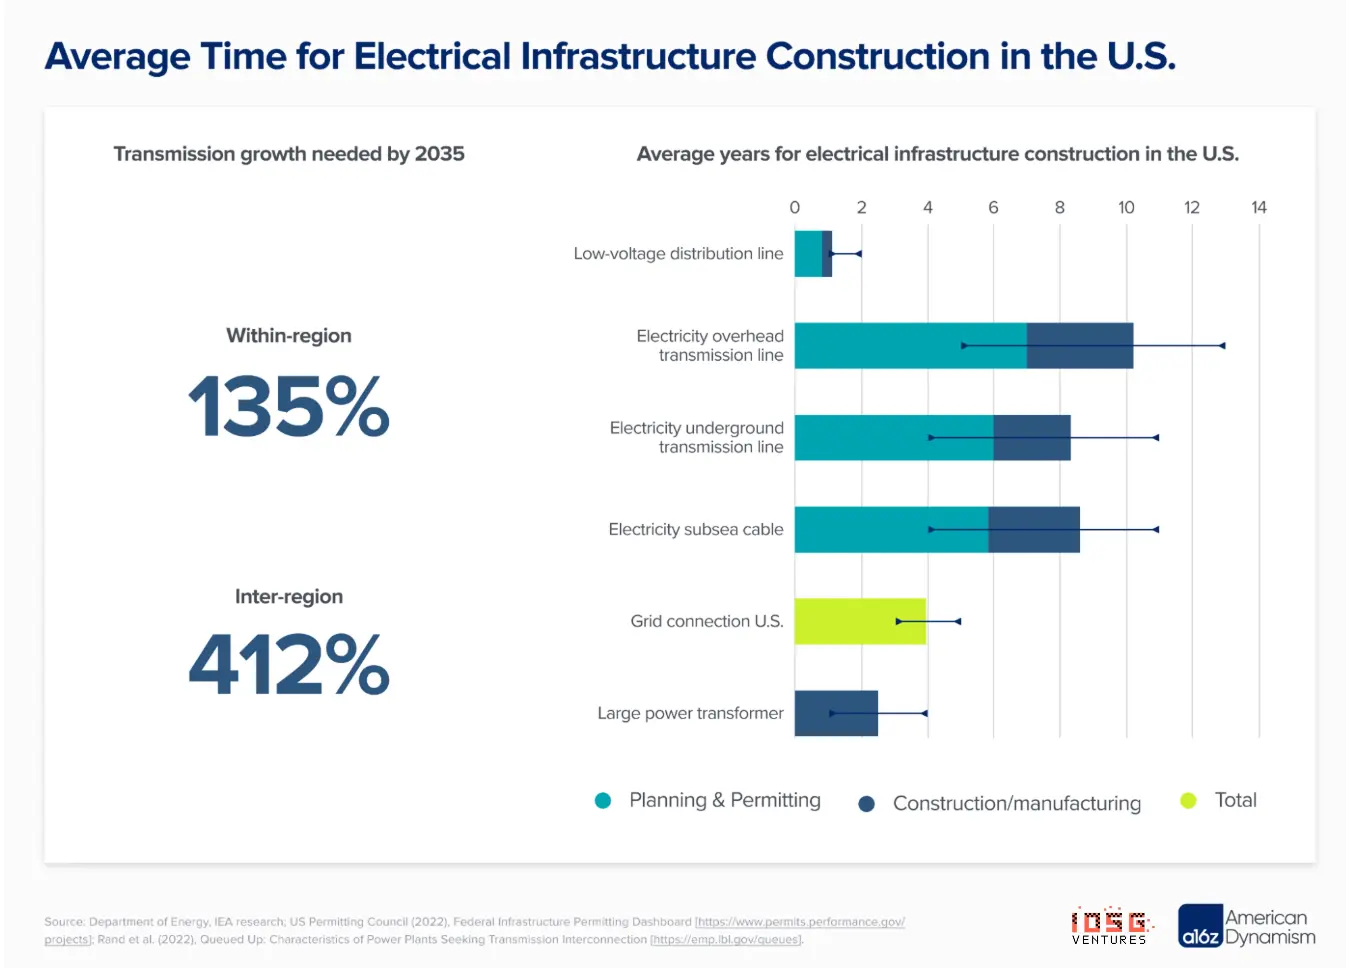
By end 2024, over 2,300 GW of generation and storage capacity in the US alone are seeking interconnection—more than double the existing total installed capacity (1,280 GW). This backlog is a major bottleneck for clean energy deployment.
Demand-Side Pressures
- Data centers: global power demand projected to double by 2030 to 1,000-1,200 TWh (roughly Japan’s total electricity consumption)
- PJM capacity prices: from $28.92/MW·day (2024-25) to $329.17/MW·day (2026-27), over 10x increase driven by data center commitments
- US grid planners’ 5-year demand forecasts nearly double; AI data centers require 99.999% uptime and massive power
- Grid upgrade costs: EU needs €730 billion in distribution + €477 billion in transmission investments by 2040; flexibility can save 30-40% compared to infrastructure buildout
Flexibility Trading and Pricing
Grid operators (e.g., PJM, ERCOT, CAISO) need real-time balancing but cannot directly communicate with millions of DERs (thermostats, batteries, industrial loads). Aggregators act as intermediaries.
Our analysis of aggregators (Enel X, CPower, Voltus) positions them between:
- Grid operators/utility needing flexibility capacity
- End customers with flexible loads or assets
Aggregators bundle thousands of small DERs into a “virtual power plant” (VPP) to bid into wholesale markets as a single entity.
Settlement Mechanisms
Unlike generation (measured in MWh output), demand response measures unconsumed MWh. This requires establishing a “baseline”—what the customer would have consumed without DR events. Common baseline methods:
- 10-of-10: average of last 10 similar days’ same period
- Weather-adjusted baselines
- Pre- or during-event metering comparisons
Settlement example:
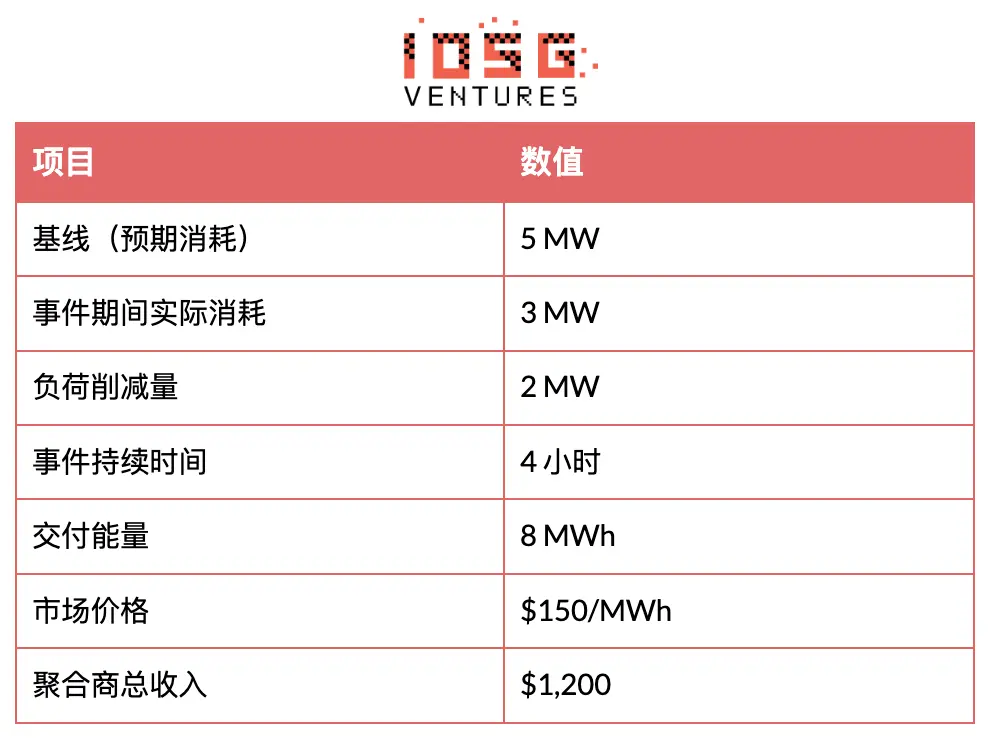
Aggregators then pay customers based on contracts (typically 50-80% of total revenue), with the remainder as their fee.
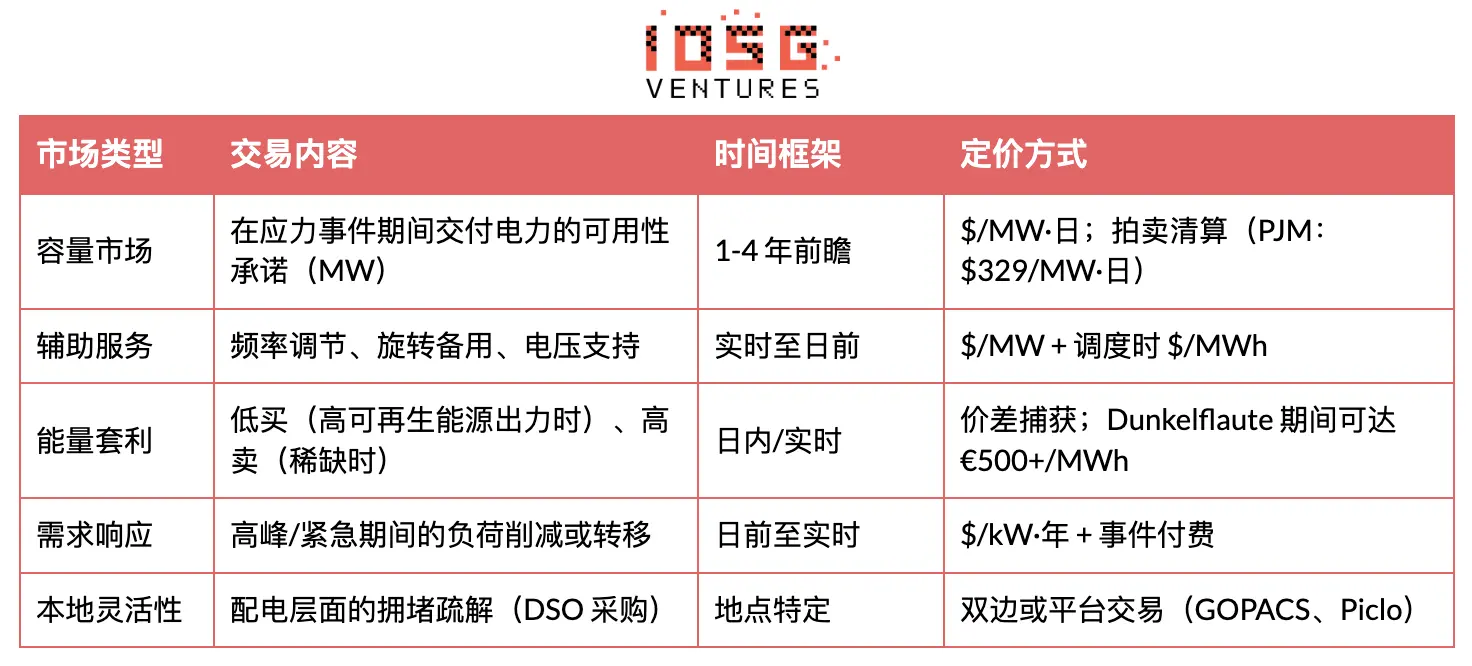
Flexibility monetization occurs via multiple market mechanisms, each with different timeframes, product types, and pricing structures. Vendors can perform “revenue stacking” across markets to maximize returns.
Additionally, energy communities—local citizen and small business cooperatives empowered by EU policies—are emerging as key flexibility aggregators. About 9,000 communities across the EU, representing roughly 1.5 million participants.
- By aggregating behind-the-meter assets (solar, batteries, controllable loads), these communities overcome scale and coordination barriers that typically prevent individual households from capturing multiple revenue streams.
- This aligns with research findings: flexibility providers can “stack” value across capacity, ancillary services, energy arbitrage, demand response, and local DSO markets. Energy communities create organizational and operational frameworks for cross-market participation, democratizing flexibility income while supporting grid decarbonization and resilience.
Why Flexibility Matters
Flexibility services offer a faster, cheaper alternative to building new generation and transmission. Virtual power plants can be “built” as fast as customer registration—no interconnection queues. Brattle estimates VPP peaking capacity is 40-60% cheaper than gas peakers or utility-scale batteries. ENTSO-E estimates that in the EU alone, flexibility can save €5 billion annually in generation costs.
For grid operators: real-time balancing; reduced reliance on costly peaking plants and grid upgrades; better integration of renewables; increased resilience under extreme weather.
For asset owners: new revenue streams from existing assets (batteries, EVs, HVAC, industrial loads); multi-service stacking can boost returns by 30-50%; minimal operational disruption.
For consumers: demand response incentives lower electricity bills; avoided infrastructure costs; improved reliability and fewer outages.
For energy transition: higher renewable penetration without curtailment; decarbonized grid services (replacing gas peakers); faster deployment compared to infrastructure-limited alternatives.
Structural Tailwinds
- Regulatory momentum: FERC Orders 2222/2023 (US), EU demand response regulations (2027), UK BSC P483 enable millions of households to participate. Over 45 countries are introducing flexibility markets.
- Grid investment surge: US utilities forecast $1.1 trillion in grid investments by 2029. EU needs €730 billion in distribution + €477 billion in transmission upgrades by 2040. Flexibility is a more economical alternative.
- Data center demand: global data center power use doubles to 1,000-1,200 TWh by 2030. PJM capacity prices surge 10x (2024→2027). Creates both flexibility demand (grid stress) and supply.
- DER proliferation: over 4 million US residential PV systems; 240,000+ home batteries; 1 million+ EVs sold in 2023. Critical mass reached, enabling aggregation and DER economics.
Key Risks to Watch
- Oversupply after 2030: large-scale battery investments may compress flexibility market margins. Some markets see revival of pumped hydro.
- Cybersecurity: millions of DERs expand attack surface. EU AI Act classifies grid operation as “high risk.” NFPA 855 increases city battery storage costs by 15-25%.
5. Aggregator Business Models
Revenue Streams
- Capacity payments ($/MW·year or $/MW·day): largest, most predictable revenue. Customers paid for availability, even if never dispatched. For example, PJM’s 2026-27 auction hit $329/MW·day.
- Energy payments ($/MWh): actual load reduction during events. More volatile, depends on dispatch frequency and market prices.
- Ancillary services ($/MW + $/MWh): frequency regulation, spinning reserves, etc. Higher value but require faster response (seconds to minutes). Voltus pioneered access to these higher-margin products.
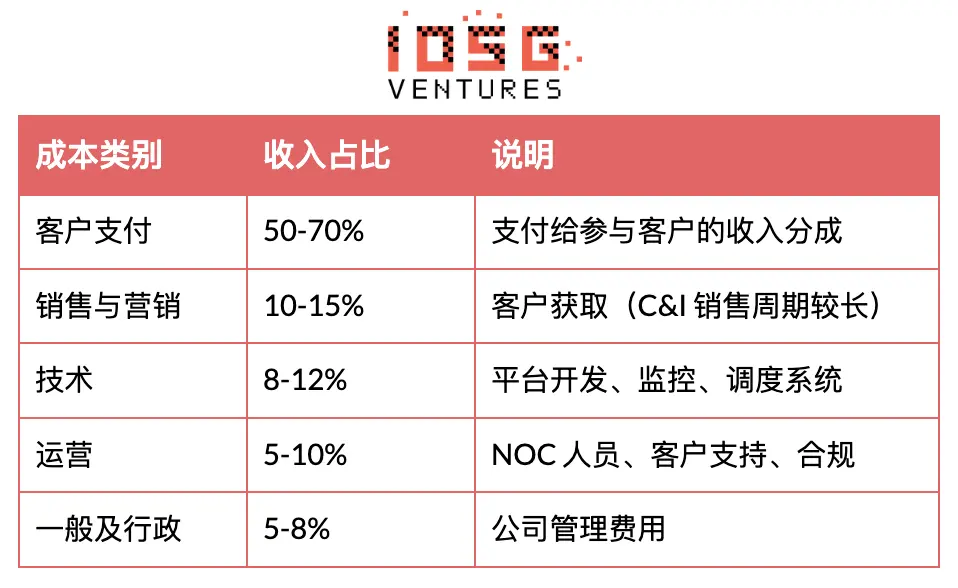
Cost Structure
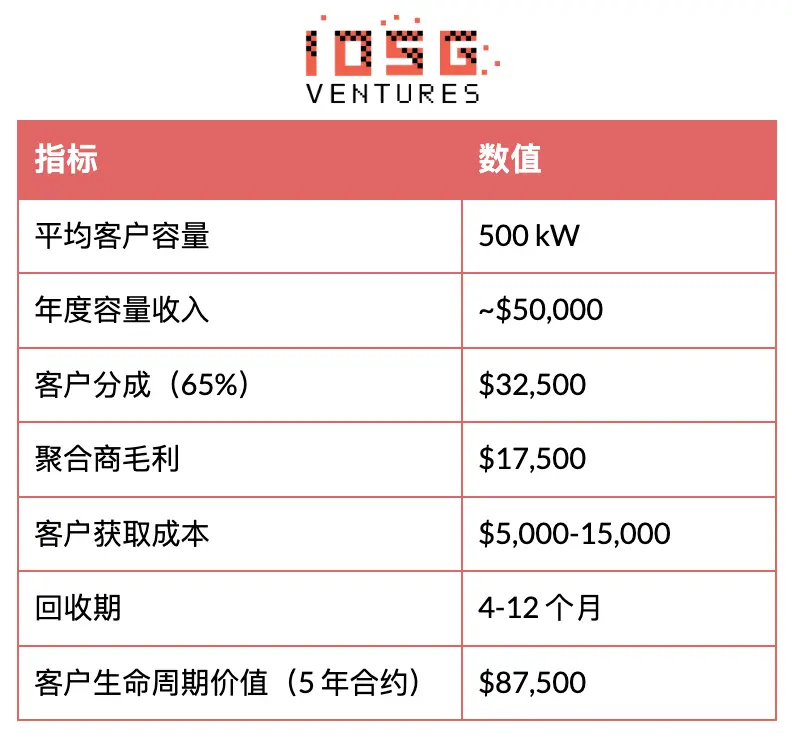
Unit Economics Example (C&I Customer)
Revenue Stacking: How Aggregators Maximize Value
Most mature aggregators “stack” multiple revenue streams from the same assets:
Example: 10 MW industrial load in PJM
This is why Enel’s DER.OS and Tesla’s Autobidder emphasize “coordinated optimization”—their AI assesses at each moment which market to participate in to maximize total returns.
6. Deep Dive: Key Players in the VPP/Aggregator Layer
Enel X — Global Market Leader
#Company Overview
Enel X is a division of Enel Group, one of the world’s largest utilities (€86 billion+ annual revenue), specializing in demand response and distributed energy. Originating from EnerNOC—founded in 2001 as a demand response pioneer, acquired by Enel in 2017—Enel X now operates the world’s largest commercial & industrial VPP, with over 9 GW of demand response capacity and 110+ active projects across 18 countries.
#Scale & Reach
- Global capacity: 9+ GW managed (Q1 2025), aiming for 13 GW
- North America: ~5 GW, covering 31 US states and 2 Canadian provinces, 10,000+ sites
- Projects: 80+ demand response projects, 30+ utility partnerships (including 11 exclusive bilateral agreements)
- Customer payouts: nearly $2 billion since 2011
- Tech investment: over $200 million in platform development
#Strategic Partnerships
In September 2024, Enel X partnered with Google to aggregate 1 GW of flexible load from data centers—creating the world’s largest enterprise VPP. This exemplifies the convergence of data center demand growth and flexibility supply: massive cloud providers driving grid stress, yet also capable of providing demand-side flexibility via UPS batteries and load shifting.
#Platform: DER.OS
Enel X’s DER.OS uses machine learning-driven dispatch optimization, which internal audits show can boost profitability by 12% over rule-based strategies. It streams data from 16,000+ sites and operates 24/7/365 control centers for real-time dispatch and monitoring.
#Core Customer Segment: C&I Facilities
These are large power consumers with interruptible loads—capable of temporary reduction without major disruption:
Key Insights
These customers already have “assets” (their loads). Enel X simply helps monetize the flexibility they don’t realize they have. The company positions itself on the demand side, asset-light, not owning generation assets. Demand reduction is equivalent to supply increase for the grid.
#Implications of Google Partnership
The September 2024 Google deal is notable because it disrupts traditional models:
- Traditional: Enel X recruits facilities → aggregates into VPP → sells to grid
- Google model: Google data centers become flexible assets → Enel X operates VPP → grid operators buy flexibility
Google’s data centers have large UPS batteries (for backup), flexible cooling loads, and some workload scheduling flexibility. Google no longer just consumes grid flexibility but provides it—Enel X orchestrates. This exemplifies the “data center as grid asset” thesis.
Revenue Breakdown
#Competitive Position
- Strengths: Largest global scale, deep utility relationships, integrated clean energy ecosystem (11 GW renewables + 1 GW storage), mature platform, Enel Group backing
- Weaknesses: Traditional enterprise sales model, slower innovation cycle compared to pure startups, higher corporate overhead
- Strategy: Focus on C&I niche, utility-scale renewable integration, data center flexibility partnerships
Voltus — Software-First Challenger
#Company Overview
Founded in 2016 by former EnerNOC executives Gregg Dixon and Matt Plante, Voltus positions itself as a tech-first alternative to traditional demand response providers. Its argument: superior software and broader market coverage can overcome scale disadvantages. As of September 2025, Voltus ranks first in managing GW capacity in Wood Mackenzie’s North American VPP report for the third consecutive year.
#Scale & Funding
- Capacity: 7.5+ GW (September 2025), up from 2 GW in 2021
- Market coverage: active in all 9 US wholesale markets and Canada—most geographically extensive among pure aggregators
- Funding: $121 million total, including investments from Equinor Ventures, Activate Capital, Prelude Ventures
- SPAC attempt: announced in December 2021 a $1.3 billion SPAC merger (valuation $1.3B), not completed
#Differentiation Strategy
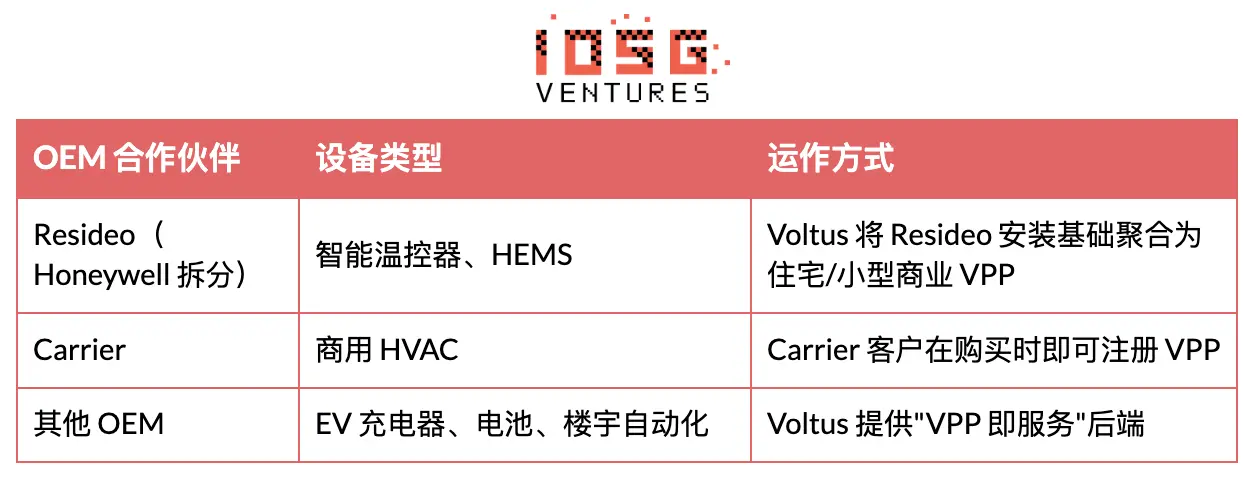
Voltus differentiates on three axes: (1) pioneering innovation—first to develop operational reserve projects with multiple grid operators; (2) broadest market coverage—active in projects others avoid due to complexity; (3) DER partnerships—not competing with OEMs but collaborating with Resideo, Carrier, aggregating their installed base into VPPs.
#Data Center Focus
In 2025, Voltus launched “Bring Your Own Capacity” (BYOC) products, tailored for data centers and hyperscale cloud providers. BYOC enables data center developers to deploy VPP-driven grid flexibility during project construction, offsetting capacity needs by procuring flexibility from Voltus’s distributed network, shortening time to energization. Partners include Cloverleaf Infrastructure.
#Core Customer: C&I Facilities (similar to Enel X)
#OEM Partnerships
#Why OEM Model Matters
Customer acquisition cost (CAC) is the biggest expense for aggregators. OEM partnerships:
- OEM handles customer relationships
- Voltus provides software and market access
- Revenue is shared among OEM, Voltus, and end customer
- CAC is significantly lower than direct enterprise sales
Revenue Model Comparison: Voltus vs Enel X
#Enel X: Capacity Market Focus
- Predictable (annual auctions)
- Lower $/kW but large volume
- Requires large MW commitments
#Voltus: Targeting niche ancillary services avoided by competitors
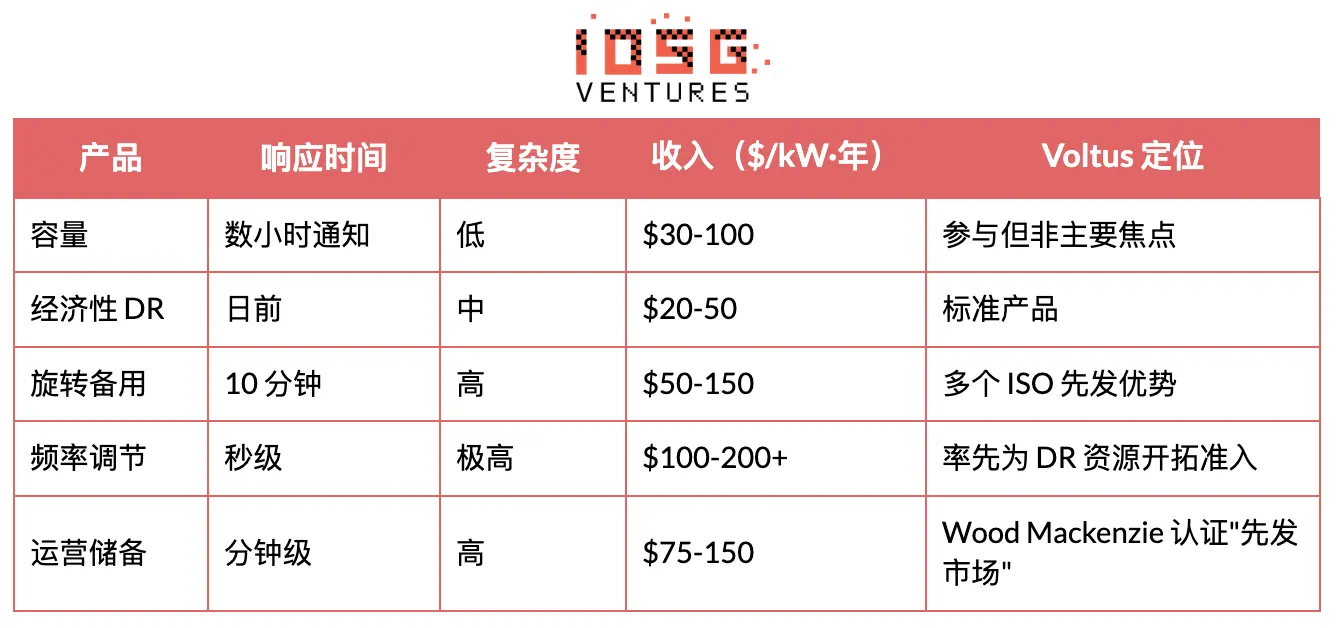
#Why Ancillary Services?
- Higher $/kW (2-3x capacity market)
- Fewer competitors (complexity barrier)
- Requires precise software (Voltus’s strength)
- Assets must respond faster (seconds to minutes)
Competitive Position
- Strengths: technical precision, broad market coverage, regulatory influence (former FERC chair Jon Wellinghoff as chief regulator), OEM partnerships, data center focus
- Weaknesses: smaller scale than Enel X, no utility-scale asset base, higher burn rate supported by VC, SPAC failure
- Strategy: monetize third-party DER via software, first-mover in ancillary services, data center collaborations
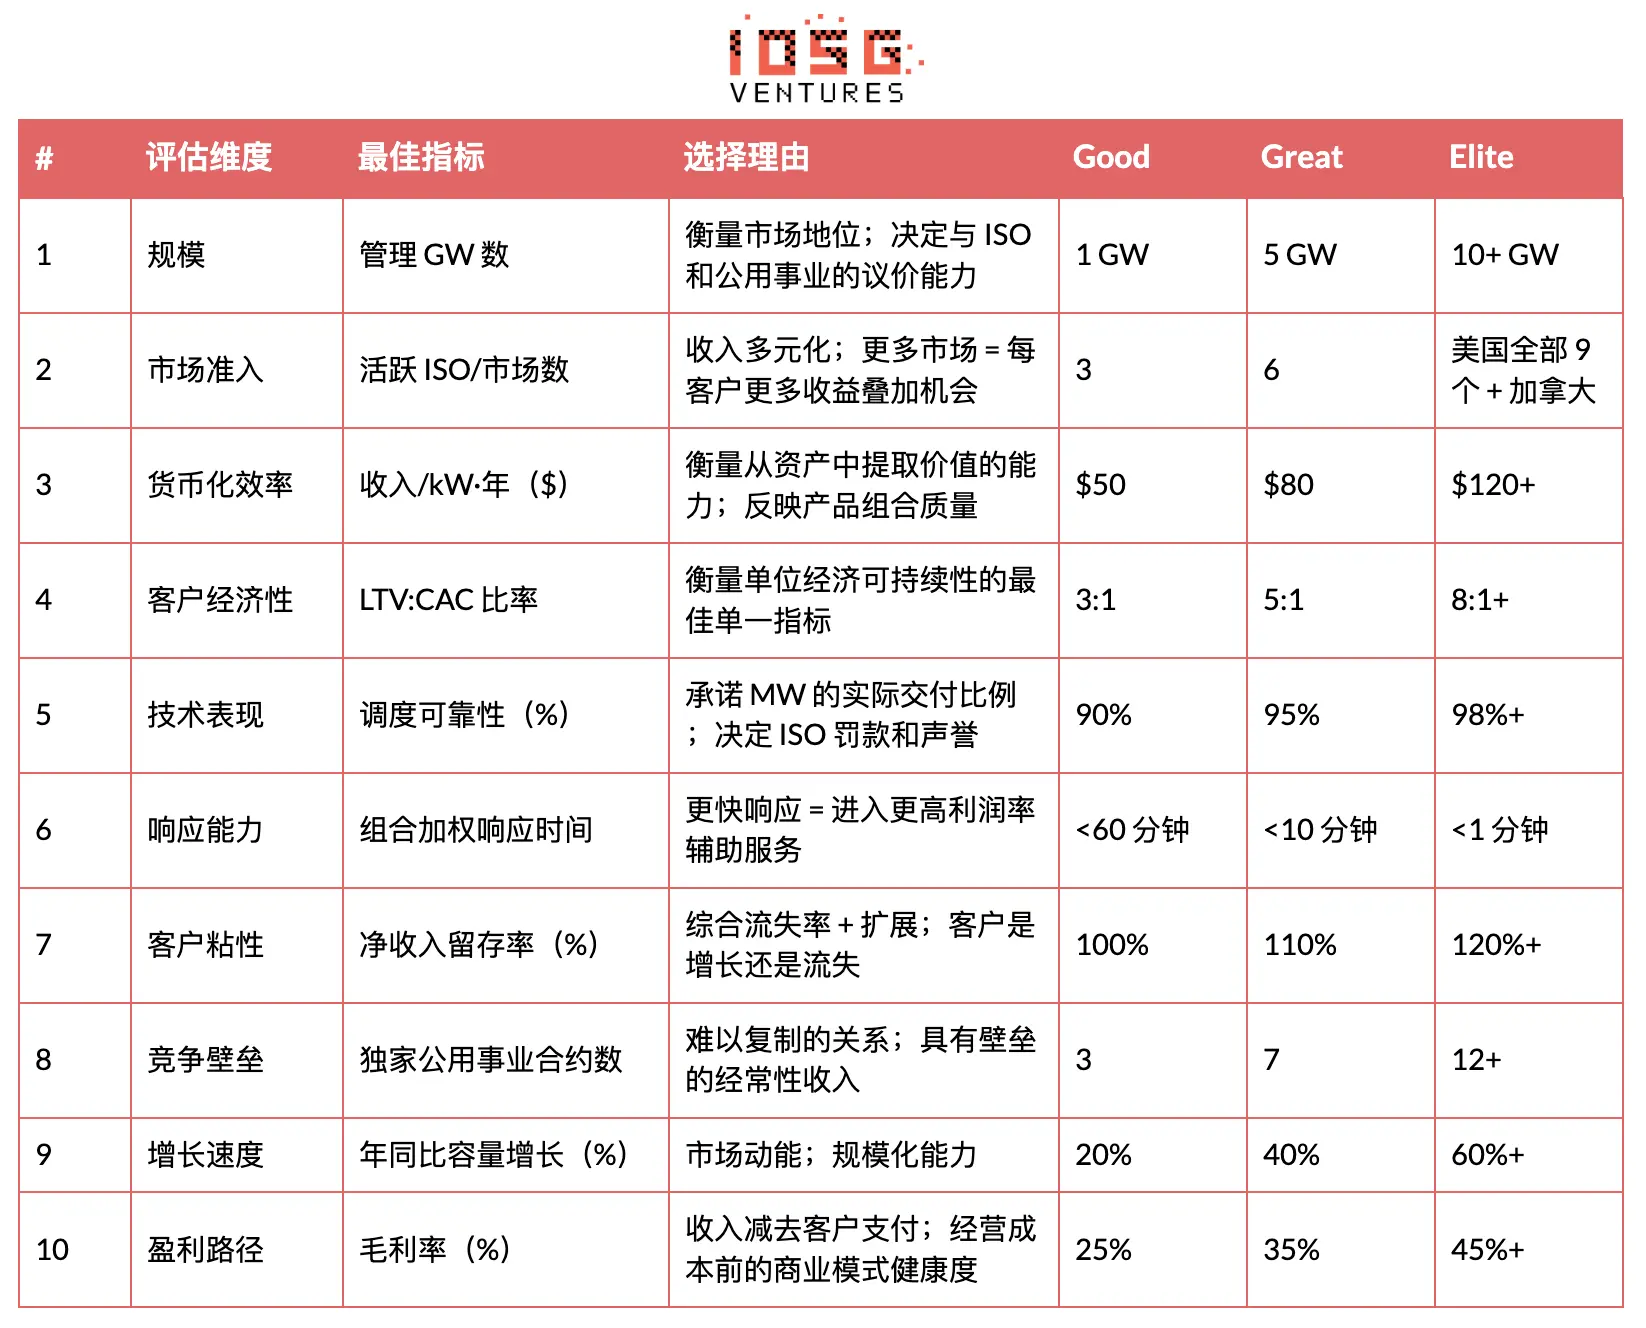
7. Investment Criteria for VPP/Aggregator Players
EU vs US Markets
With supportive regulation and highly interconnected infrastructure, the EU leads in scaling system-wide flexibility faster than the US. Eurelectric notes that liberalized EU markets effectively incentivize producer and consumer participation, continuously increasing flexibility supply; large-scale smart meter rollout and time-of-use tariffs lay the foundation for demand shifting.
- Market design: liberalized market mechanisms drive proactive participation on both sides, with smart meters enabling load shifting
- Interconnected grids: robust cross-border interconnections reduce outages and durations, providing stable power for industry
The US has vast untapped customer-side flexibility potential, with studies indicating large-scale load reductions (~100 GW) achievable with minimal impact.
- Grid-edge focus: rapid DER proliferation makes “edge” flexibility management increasingly critical for US utilities
“The inherent fragility of the grid demands careful management of every connected asset, ensuring reliable supply matches forecasted demand. The rapid growth of intermittent sources and electrification (peak demand) pose serious challenges.” — a16z
8. Conclusion
So far, flexibility has been dominated by “macro-flexibilities”—large industrial assets (>200 kW) connected at transmission or high-voltage distribution levels. These assets are attractive because they are easily identifiable, contractable, and dispatchable. But this model is hitting structural bottlenecks. Macro-flexibility alone is no longer sufficient, leading to under-supply and chain issues like interconnection delays, increasing system vulnerability and becoming a key bottleneck for AI-driven load growth.
The next frontier is inevitably: micro-flexibilities—small assets connected at medium- and low-voltage levels, in the 1-10 kW range, including EV chargers, heat pumps, HVAC, batteries, and household appliances. These assets, when aggregated, represent capacities several orders of magnitude larger than macro sources, but are far harder to access.
Current methods to tap these flexibilities leave significant value on the table, creating opportunities for flexibility owners to capture this unexploited potential and participate in the ecosystem. A direct-to-critical-scale owner, independent aggregator not tied to specific vendors or equipment brands, can generate powerful network effects. Once users are horizontally aggregated, energy companies and OEMs will be economically motivated to participate proactively, rather than trying to control customer relationships from the outset.
At the core of all this, I believe DePIN (Decentralized Physical Infrastructure Networks) holds the greatest potential to disrupt this space and create long-term value through crypto-native infrastructure and incentives. By expanding capacity and unlocking new pathways to access flexibility, this niche will revolutionize current energy markets, enabling AI to continuously reshape the world without constraints.
