The Nasdaq 100 Index (NDX) has remained below its all-time high for 100 straight trading days, marking the longest ongoing pullback since 2023, with a year-to-date decline of about 6.6%. Based on historical data analysis from the Kobeissi Letter, since 1985, this type of pattern has appeared only 6 times. In all cases, the index recorded positive returns one year later, with an average gain of 17%.
Historical Pattern Analysis: A Statistical Signal That Has Appeared Only 6 Times Since 1985
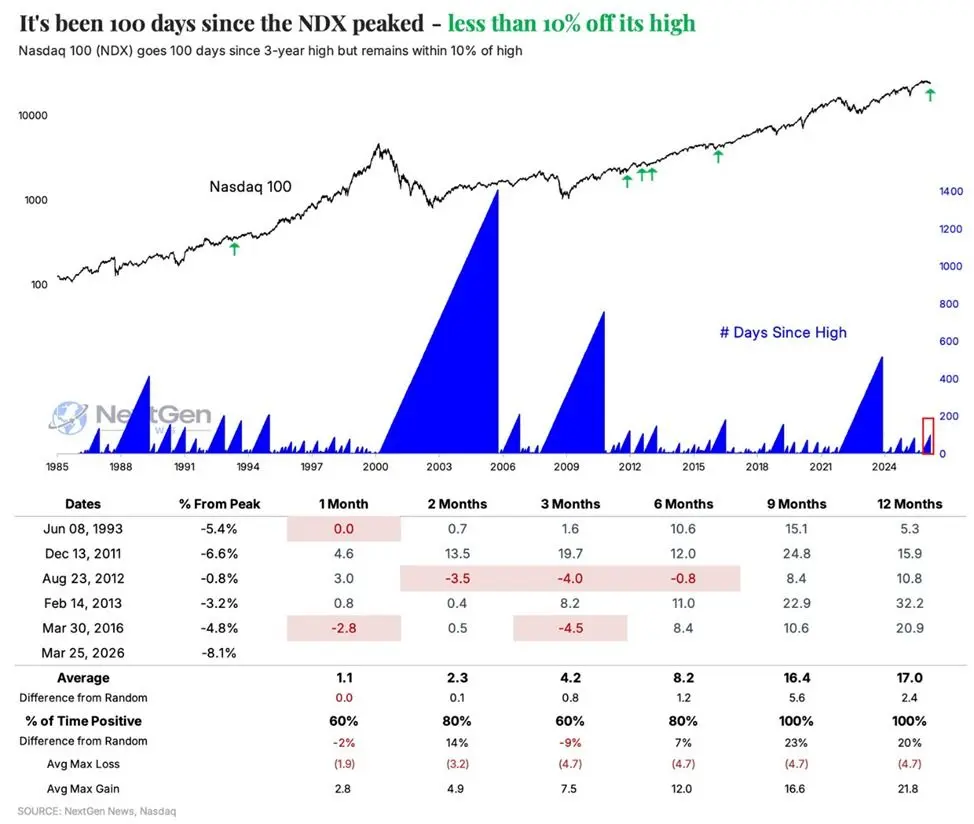 (Source: NextGen)
The Kobeissi Letter notes that the current pattern of the Nasdaq 100 Index—more than 100 trading days in a row below its all-time high, while still remaining within a 10% pullback range from the high—has occurred only 6 times since 1985, making it a relatively rare market structure from a statistical perspective.
These 6 historical cases show consistent patterns across three time horizons:
One month later: In 80% of cases, returns were flat or positive, with an average gain of about 1.1%
Two months later: In 80% of cases, returns were positive, with an average gain of about 2.3%
One year later: All 6 cases finished higher, with an average gain of 17%
Among these, the “100% win rate” one year later is the most statistically significant data point in the above analysis. However, it’s worth noting that the sample size is only 6 instances, so the statistical conclusions should be interpreted cautiously. Historical regularities do not constitute a guarantee of future performance.
End-of-Quarter Rebalancing by Retirement Funds: A Structural Buying Signal of $13.8 Billion
The $13.8 billion buying amount expected by Goldman Sachs exceeds 97% of all monthly purchase volumes over the past three years, and 93% of all monthly purchase volumes since January 2000. By contrast, since 2000, retirement funds have averaged a net monthly sale of $1.8 billion in stocks. The abnormality of the expected buying size this time is especially pronounced.
These end-of-quarter purchases are passive asset rebalancing operations. Analysts point out that, due to the recent decline in the stock market, the stock allocation has fallen below the target allocation ratio. Therefore, funds need to restore the predetermined asset allocation structure by selling bonds and increasing stock holdings. This mechanism has predictability in timing, allowing it to form a concrete and quantifiable demand for stocks in the short term.
Fidelity’s global macro strategist Jurrien Timmer adds from a fundamental perspective that the “Magnificent Seven” stocks—whose market capitalization makes up a substantial share of the Nasdaq 100 Index—have had their valuations pulled back to a more reasonable range during this round of correction, and they continue to benefit from strong earnings growth momentum, providing fundamental support for the index’s mid-term performance.
Current Market Positioning: A Structural Interpretation of the Corrective Nature and Conditions for Recovery
The Nasdaq 100 Index is still within the 10% correction range from its historical high and has not entered the technically defined bear market zone (typically determined as a decline of more than 20%). Although the duration of the correction over 100 trading days is the longest in three years, the index’s relatively high-level structure is still being maintained.
Multiple factors are unfolding in parallel: the statistical regularities of historical patterns, forced rebalancing purchases by retirement funds, and fundamental support from technology leaders. The Kobeissi Letter concludes that “historical experience indicates that tech stocks are about to enter a recovery,” but whether historical patterns and the flow of institutional capital can form sustained upward momentum under the current macro environment still needs validation by the market.
FAQ
How rare is the “100-day correction” pattern in the Nasdaq 100 Index?
According to Kobeissi Letter data, since 1985, similar patterns (a decline of more than 100 days while still staying within a 10% range of the highs) have occurred only 6 times. On average, they happen once every six to eight years, making them a low-frequency market pattern statistically. However, because the sample size is limited, interpretation should remain cautious.
Why does end-of-quarter buying by retirement funds have market significance?
The expected size of $13.8 billion exceeds 93% of the monthly buying records since 2000. Since these operations are passive buys driven by target-weight rebalancing, they have timing predictability and can form, in the short term, stock-market demand at a scale that is both measurable and quantifiable. This is one of the structural support factors from a technical perspective.
Is a valuation pullback in the “Magnificent Seven” enough to support a Nasdaq 100 recovery?
Fidelity’s global macro strategist Jurrien Timmer believes this round of correction has brought valuations back to a reasonable range, and the earnings growth of the Magnificent Seven remains resilient. Different analysts use different valuation frameworks, so investors are advised to evaluate across multiple dimensions—such as earnings growth rates, price-to-earnings ratios, and the macro interest-rate environment—before reaching a conclusion.
Disclaimer: The information on this page may come from third parties and does not represent the views or opinions of Gate. The content displayed on this page is for reference only and does not constitute any financial, investment, or legal advice. Gate does not guarantee the accuracy or completeness of the information and shall not be liable for any losses arising from the use of this information. Virtual asset investments carry high risks and are subject to significant price volatility. You may lose all of your invested principal. Please fully understand the relevant risks and make prudent decisions based on your own financial situation and risk tolerance. For details, please refer to
Disclaimer.
