Currently, the price of Pi Coin (PI) is trading at $0.178, down 3.26% for the day. This coin is under pressure at the Fibonacci level 0.236 at $0.189, while the price chart shows signs of repeating the structure that appeared in November and December 2025.
On-chain indicators are also reflecting a similar cycle but with a certain lag. However, with the precedent from December 2025, the outlook is not very promising for Pi Coin.
CMF: Signs of Repeating the December Crash
The Chaikin Money Flow (CMF) indicator peaked near 0.30 in mid-March 2026 when the price of Pi Coin rose to $0.299. However, since then, the CMF has sharply declined to -0.11 in a straight line, with no signs of recovery or bottom formation. The blue downtrend line on the chart indicates that selling pressure is still dominating the market.
Considering the precedent from December 2025, the CMF then peaked near 0.25 at the end of November before gradually declining in a similar pattern. Eventually, this indicator bottomed out at -0.20, while the price of Pi Coin dropped sharply by 38.19% over 56 days, from the accumulation zone of $0.220 to $0.139.
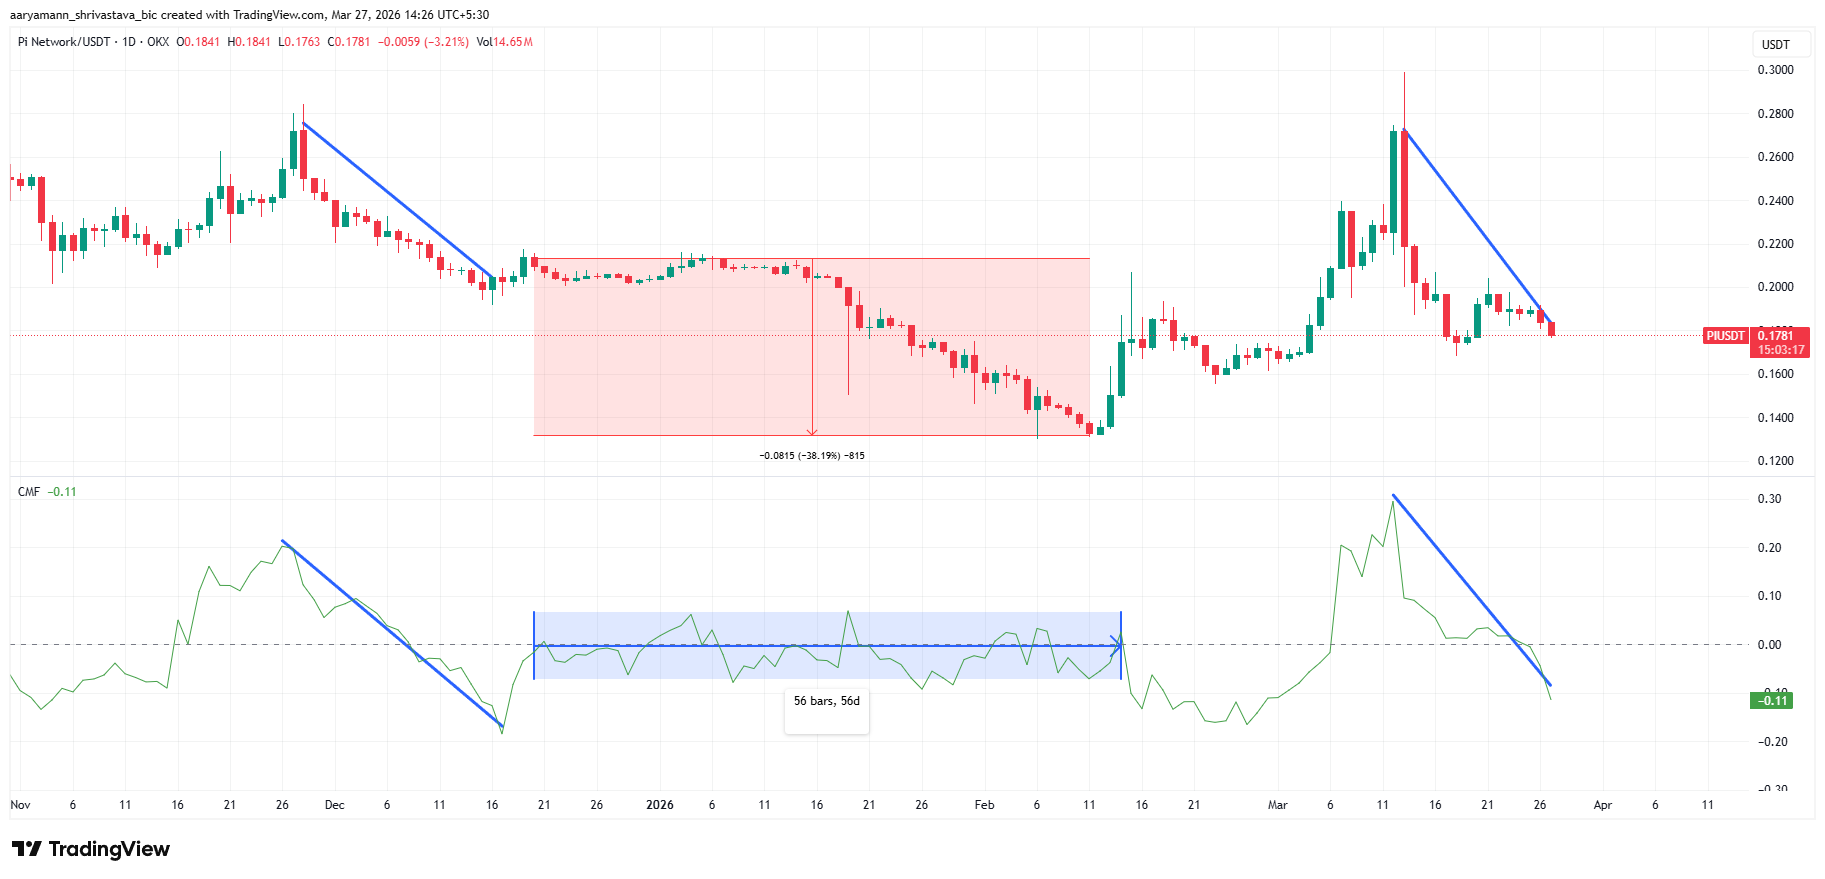 CMF indicator of Pi Coin | Source: TradingViewCurrently, with a CMF of -0.11, this indicator has not yet reached the previous bottom of -0.20, indicating that the possibility of further decline still exists. This next decline phase could coincide with prolonged selling pressure, causing the price of Pi Coin to continue being weighed down.
Pi Coin Has Not Entered the Reversal Zone
The Money Flow Index (MFI) chart includes the period from November 2025 to March 27, 2026, with the highlighted pink area emphasizing the event of December 2025. During that period, the MFI fell below the 20 threshold, but the price of Pi Coin continued to decline with no signs of reversal. Only when the CMF hit a bottom of -0.20 did the price begin to recover.
Currently, the MFI of Pi Coin is at 35.23, still above the oversold threshold of 20. Although this indicator is trending downward, it has not yet reached the previous support level. This indicates that selling pressure remains strong and reversal signals have not appeared.
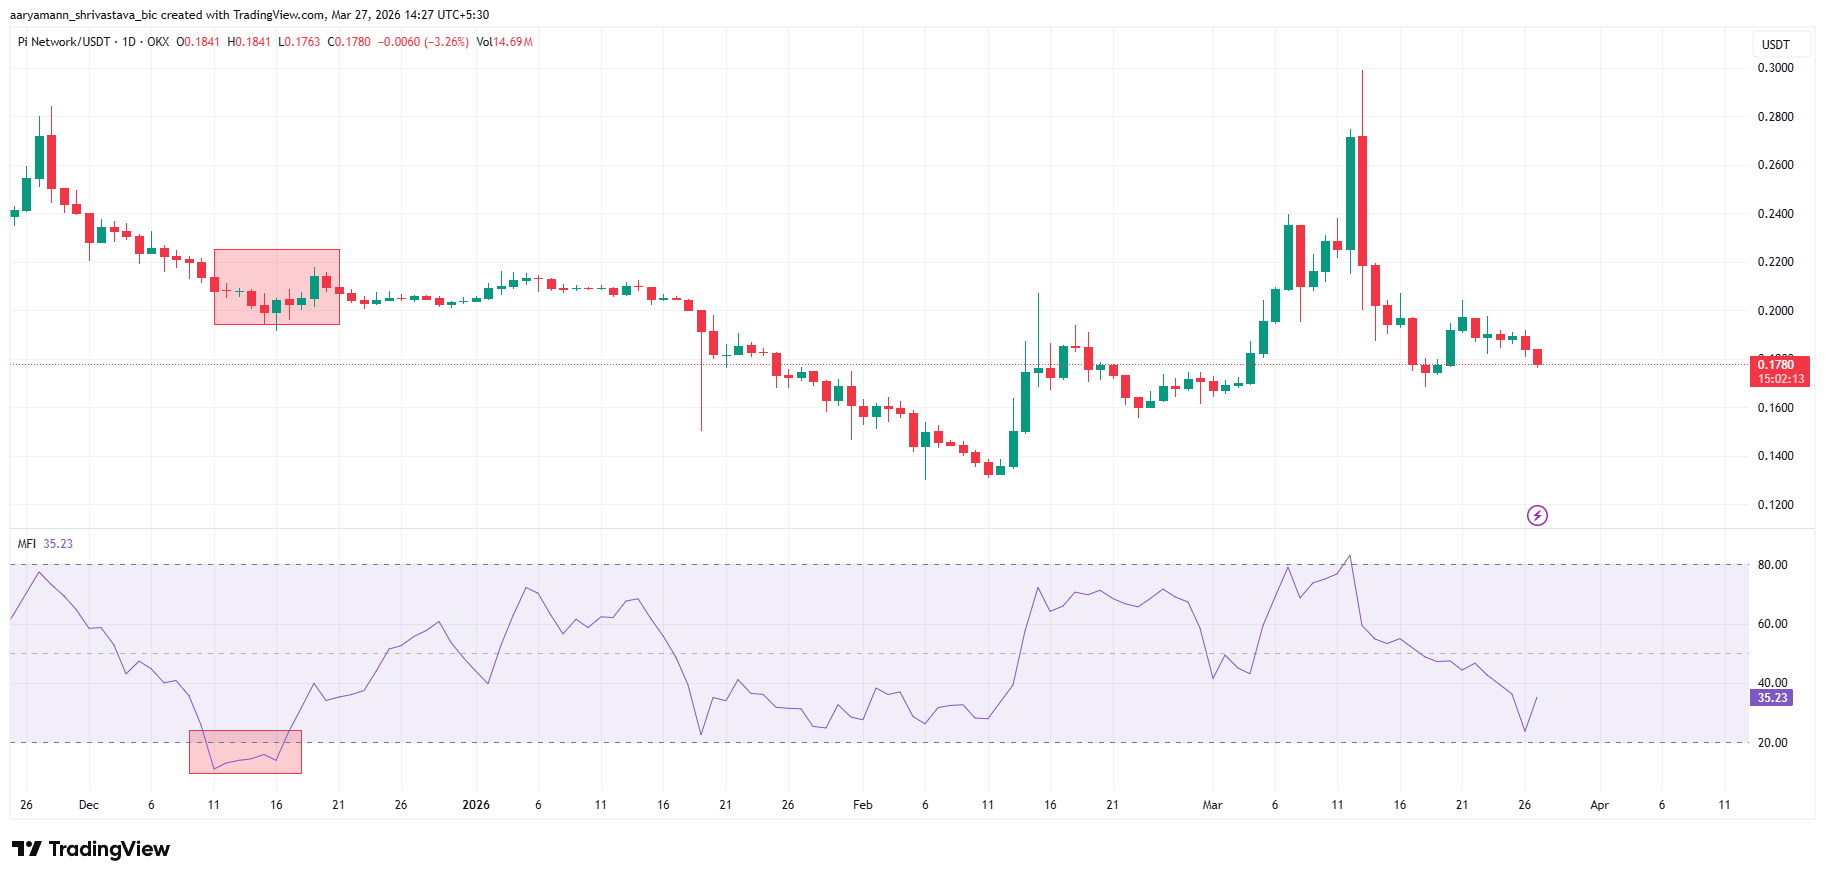 MFI indicator of Pi Coin | Source: TradingViewIn the past, when the MFI fell into the oversold zone, the price of Pi Coin continued to decline for nearly two months, while the CMF remained close to 0 before recovering. If a similar scenario repeats, starting from the current CMF level of -0.11, a significant recovery of Pi Coin may not occur before the end of May.
Pi Coin Price Forecast: Continuing to Face Downward Pressure
According to Fibonacci analysis, the price of Pi Coin is currently at $0.178, positioned between the Fibonacci support level 0.236 at $0.189 and the 0 level at $0.155. The 50-day EMA is currently at $0.188, while the 200-day EMA is at $0.270. Both of these lines are trending downward, serving as important resistance levels.
The double top pattern on the chart predicts a decline of 33.11%, bringing the price of Pi Coin to a target of $0.130, which would also be the lowest level in history. If the downward trend continues, the price may test support levels at $0.159 and $0.141 before heading to $0.130. However, with the CMF still negative, the likelihood of forming sustainable support levels at these thresholds is quite low.
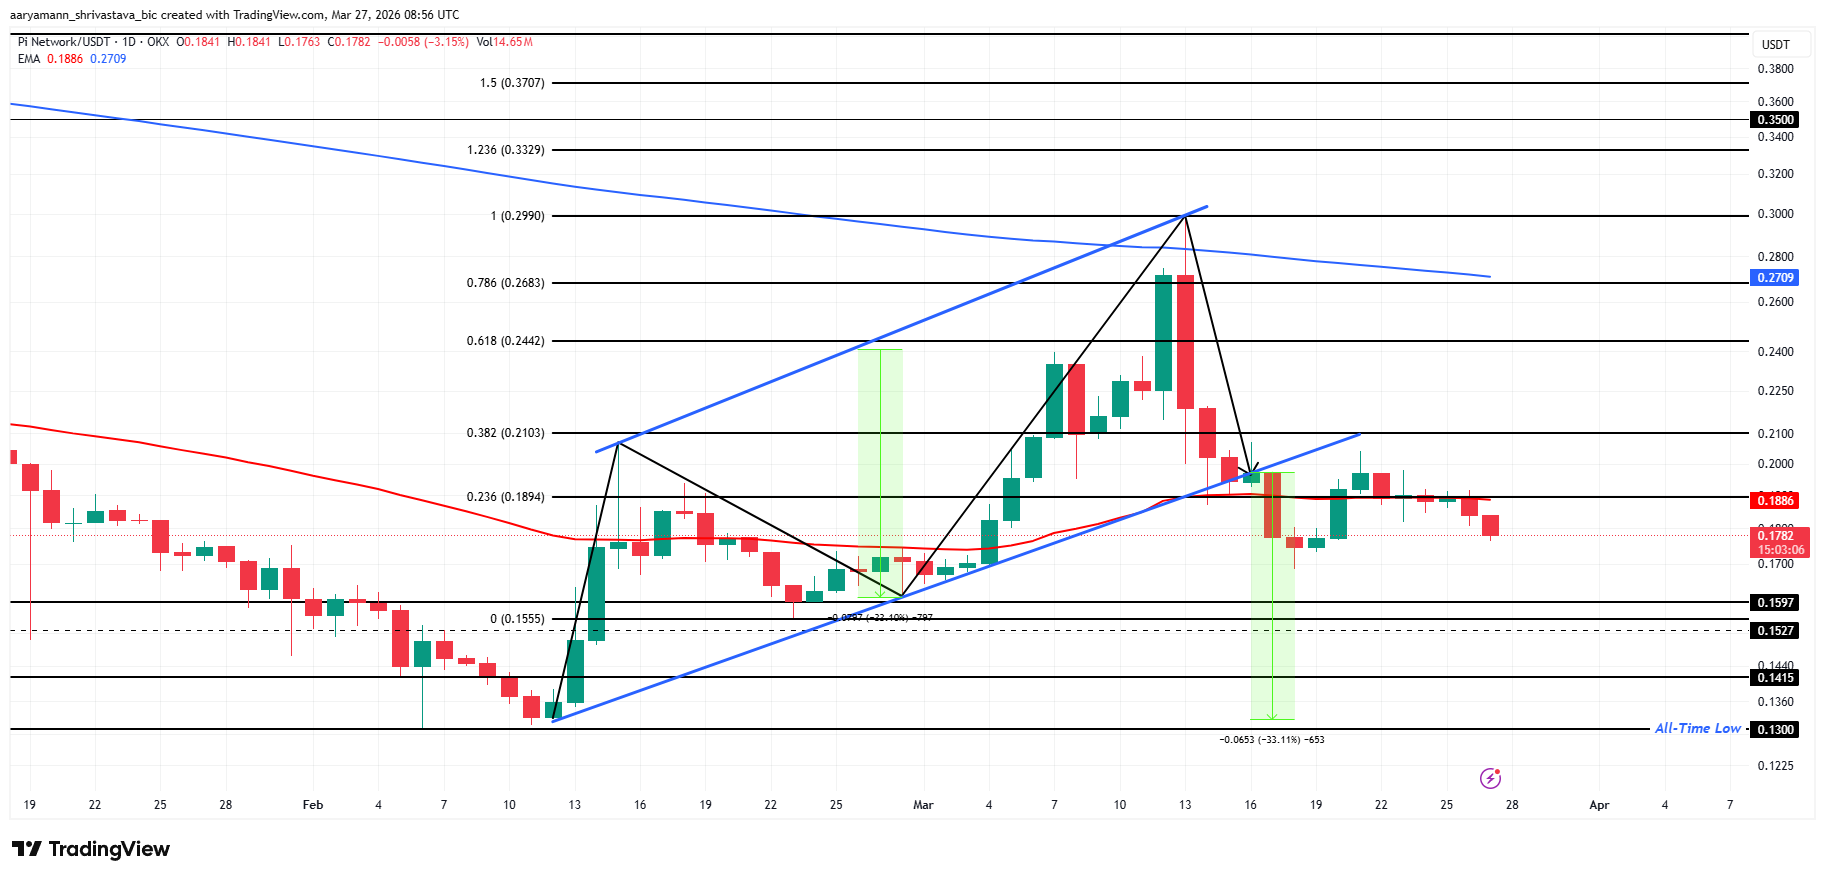 Pi Coin price analysis | Source: TradingViewTo reverse the downward trend, Pi Coin needs a daily close above $0.210. If this occurs, the next price targets will be $0.244 and $0.268. Once the price surpasses $0.268, the double top pattern will be completely broken, returning the market trend to a neutral state and opening up recovery opportunities.
However, given the current situation, Pi Coin still faces the risk of continued price decline in the short term.
Disclaimer: The information on this page may come from third parties and does not represent the views or opinions of Gate. The content displayed on this page is for reference only and does not constitute any financial, investment, or legal advice. Gate does not guarantee the accuracy or completeness of the information and shall not be liable for any losses arising from the use of this information. Virtual asset investments carry high risks and are subject to significant price volatility. You may lose all of your invested principal. Please fully understand the relevant risks and make prudent decisions based on your own financial situation and risk tolerance. For details, please refer to
Disclaimer.
