Bitcoin’s seasonality is one of those persistent “market stories,” mostly because the average figures are easy to quote and spread. But the issue is this: averages usually hide the most important thing—market conditions.
A strong “Uptober” in a healthy uptrend is not the same as a positive October after the market has been underwater in Q1. A December with a positive average doesn’t offer an edge if the median is still negative. And a breakout in Q1 doesn’t necessarily mean the rally will continue if most of the upside has already been “pulled forward.”
The core of the problem is here: the real value of seasonality is not in the calendar, but in the interaction between timing, market conditions, and the path of prices.
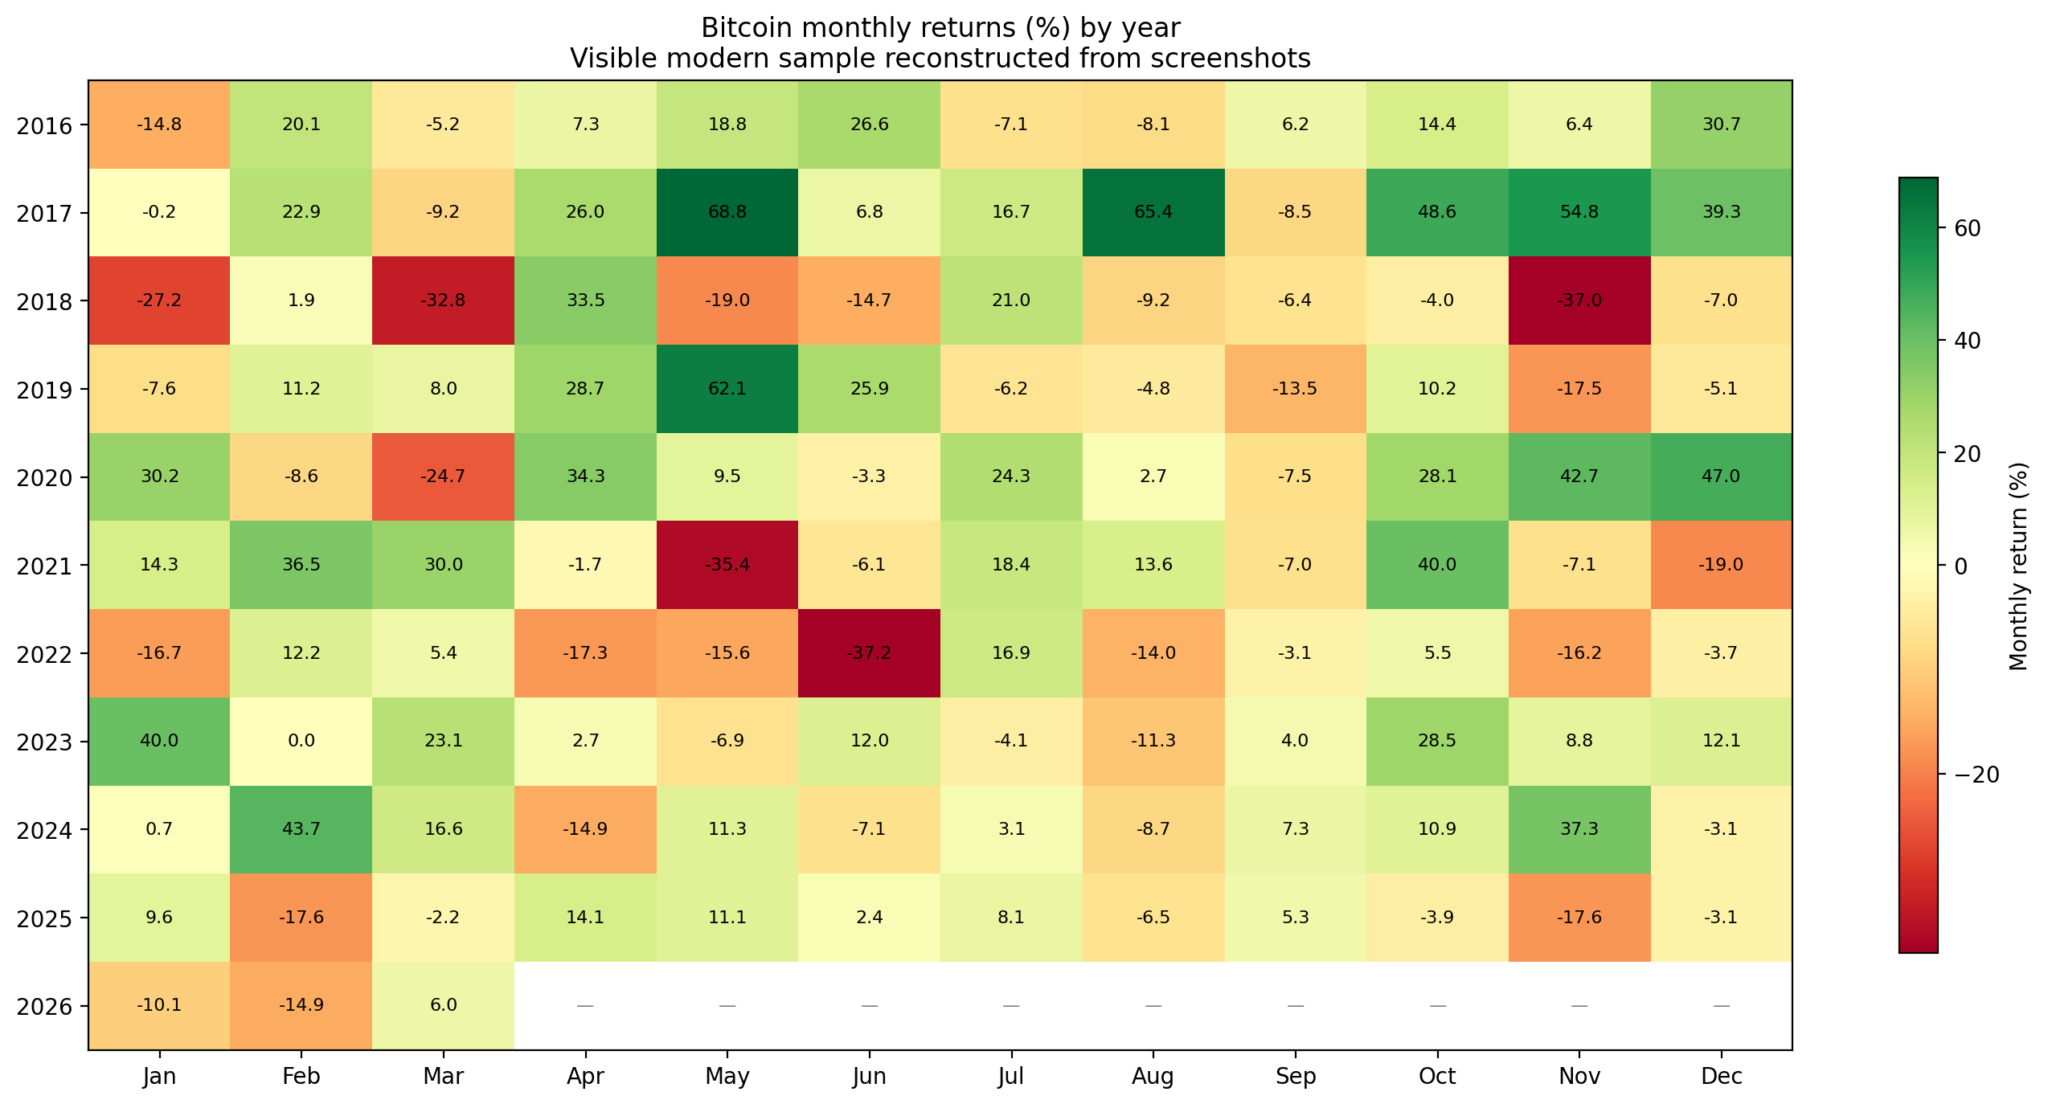 The heatmap shows Bitcoin’s monthly returns by year from 2016 to 2026, with green indicating gains and red indicating losses.
Averages can be misleading
If you look only at average monthly returns, Bitcoin seems to have many repeating “bullish windows.” In recent data, October stands out with an average gain of 17.8%, a median of 12.7%, and a win rate of 80%. July is also fairly strong, with an average of 9.1% and a win rate of 70%. February and April are also generally positive.
But once you dig deeper, the picture changes fast.
August is the clearest example. An average of +1.9% sounds fine, but the median is -7.3% and the win rate is only 30%. This suggests that most of the time, August isn’t good—it’s only “rescued” by a few rare, strong upside moves.
December and November are similar: a positive average, but a wide distribution of outcomes, and downside risk remains significant. May is another “trap”—high volatility makes the average number almost meaningless for assessing real risk.
In other words, there are months where the trend (mean, median, win rate) agrees. But there are also months where volatility dominates, and the average figure is more of a “story” than a forecast.
Months that are truly trustworthy
The two most notable months are October and July. Not because they always go up, but because the metrics (mean, median, win rate) are fairly consistent—close to a real “trend window.”
By contrast, many familiar seasonality narratives are quite fragile:
- August: distorted by outliers
- November–December: depends on the backdrop
- May: high volatility, hard to predict
A month with a positive average doesn’t automatically mean a trading edge. If the median is negative and the win rate is low, that isn’t “seasonality”—it’s randomness wearing a disguise.
Market conditions decide everything
When you classify years by condition:
- Bull: >50%/year
- Bear: <-20%/year
- Neutral: in between
The results show that many months “flip signs” depending on the context. A positive month in a bull market can become negative in a bear market.
This shows that seasonality isn’t independent—it depends on market conditions.
A few notable points:
- July: the most stable across conditions
- April: relatively positive
- September: consistently weak
The real edge is in the path, not the calendar
The strongest signal isn’t about which month is good—it’s about the year’s condition:
- If Bitcoin is positive YTD after February → 7/7 years finish positive
- If it’s negative YTD after February → 0/3 years finish positive
After March:
- Positive YTD → 5/5 years finish positive
- Negative YTD → only 2/5 years finish positive
This indicates that by the end of Q1, the “fate” of the year has already been shaped to some extent.
Notably, monthly momentum isn’t very reliable:
- After an up month → the next month is up 57.1%
- After a down month → the next month is still up 55.3%
There’s no clear edge.
A strong Q1 doesn’t necessarily mean a good Q2
The data shows:
- Q1 >20% → that year always finishes positive
- But the average Q2 return actually drops by ~15.1%
Meaning:
- A strong Q1 → good for the whole year
- But it also increases the likelihood of a pullback in Q2
This is the difference between “direction” and “timing.”
June is the deciding point
If the first half of the year doesn’t rise → there has never been a year that finished positive
If the first half of the year is positive → 7/8 years finish positive
For years with weak Q1:
- If Q2 rebounds by >20% → outlook improves sharply
- If not → the year usually fails
=> Q2 is the “repair window.”
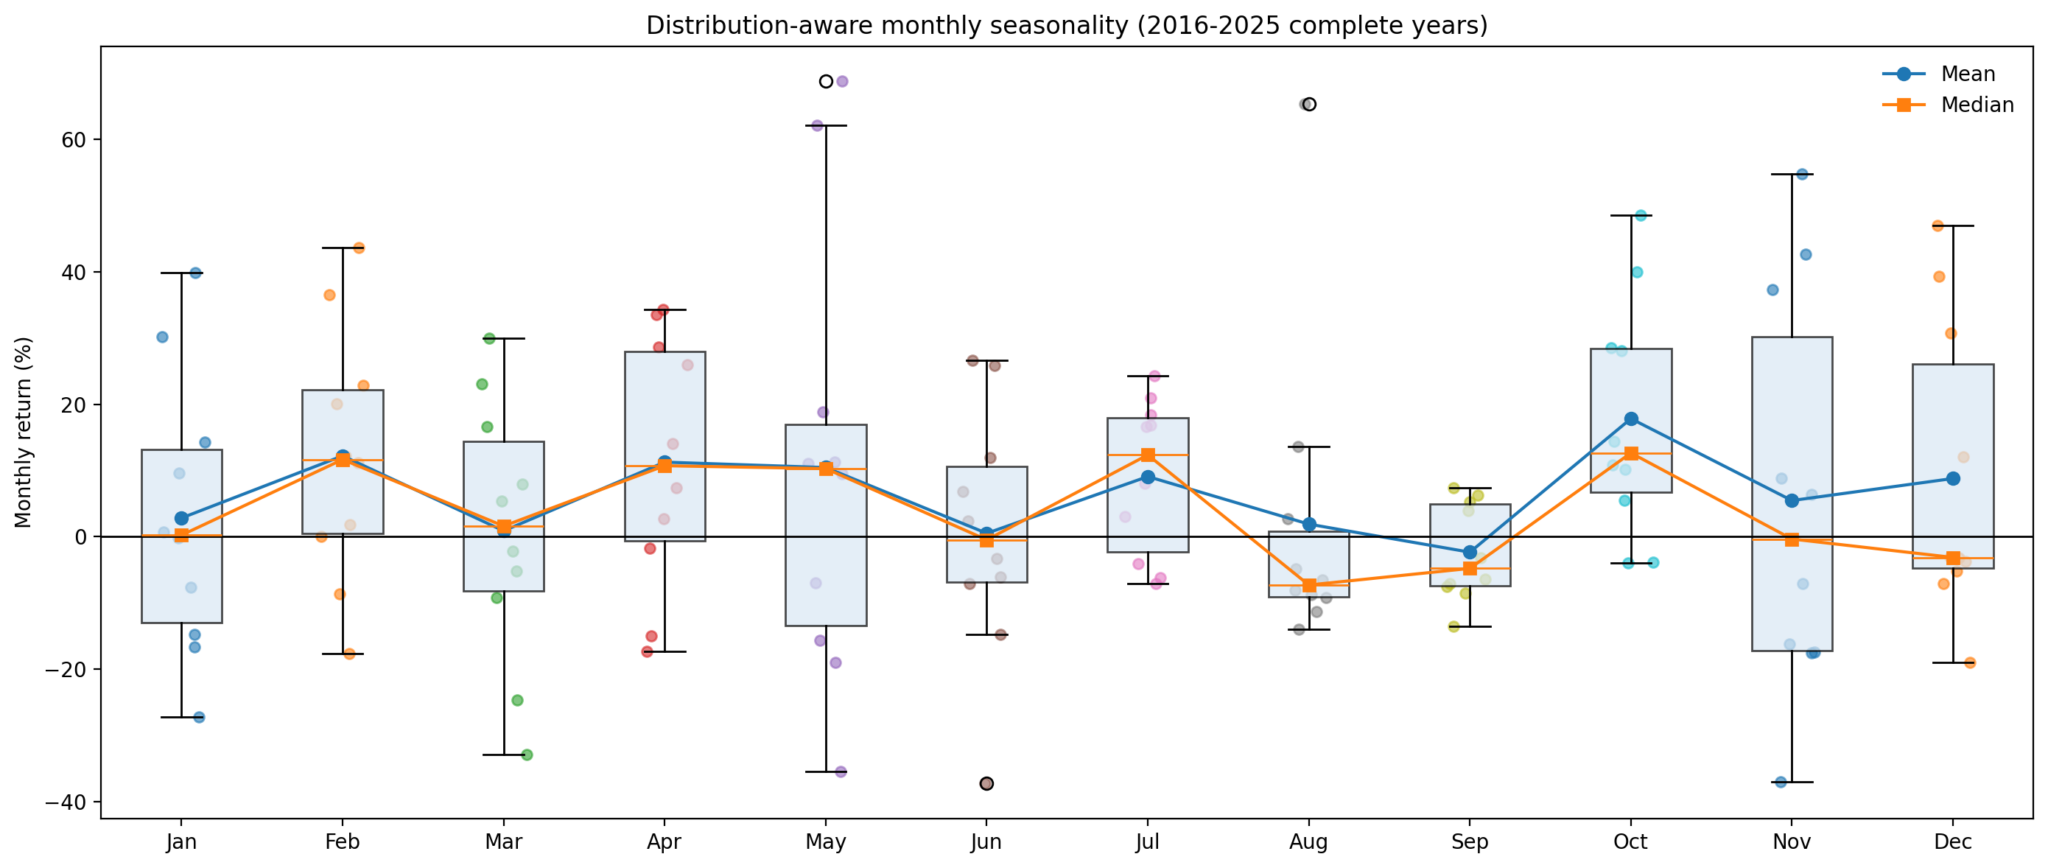 The box-and-whisker plot shows Bitcoin’s monthly returns from 2016 to 2025, illustrating the distribution of returns each month with mean and median lines.
2026: a year that needs to be “rescued”
2026 breaks the familiar pattern:
- January: -10%
- February: -14.8%
- March: a mild rebound
Q1 is still down by about 19%—a rare structure.
This places 2026 in a “repair or failure” state, similar to the years:
This isn’t a “Q4 usually rises” story, but rather:
Does Q2 have enough strength to repair the trend?
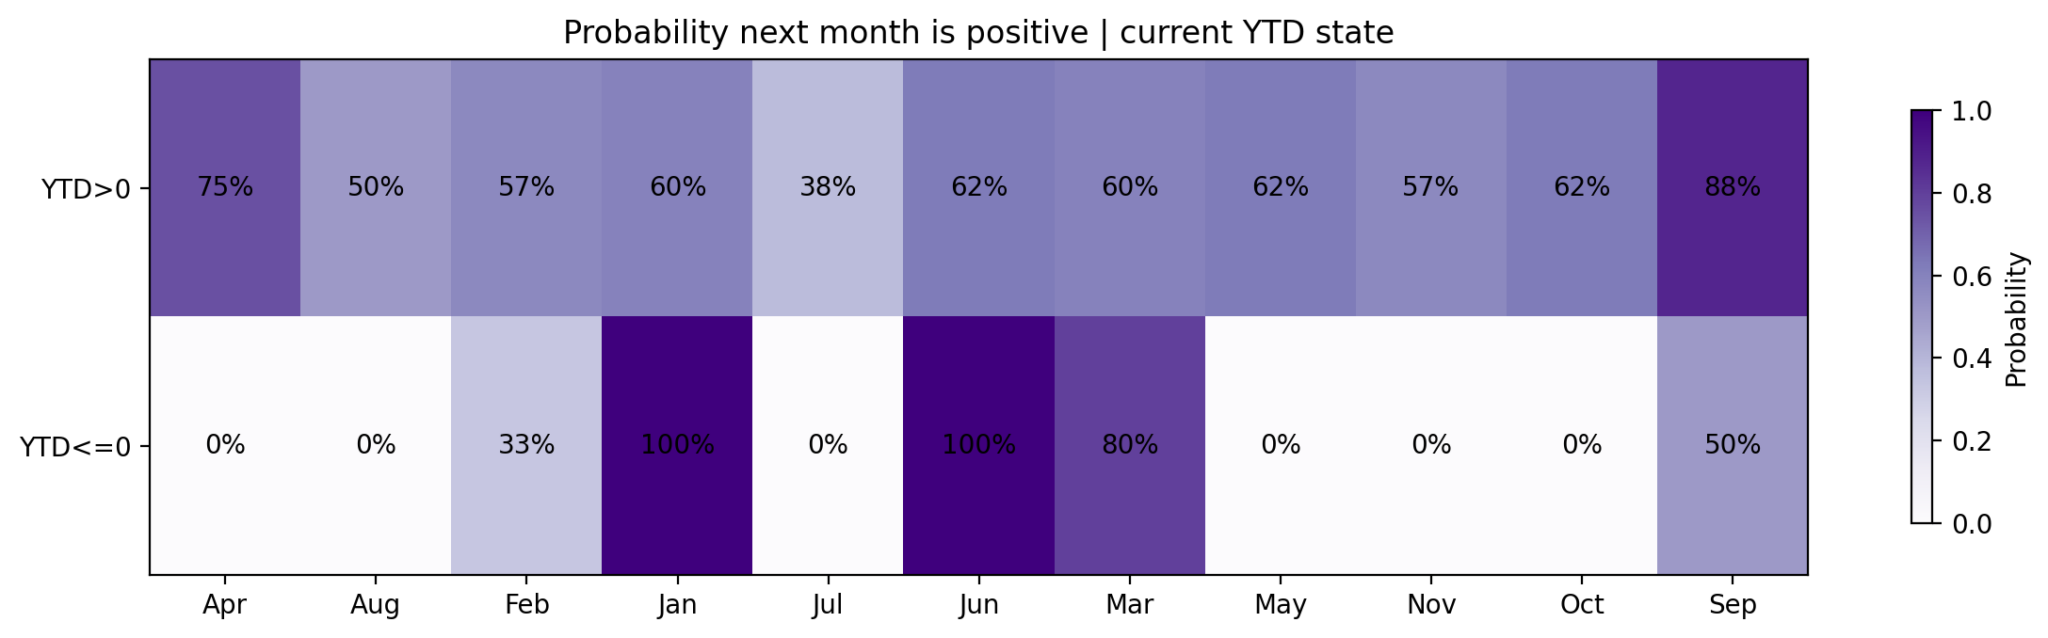 The heatmap shows the probability of Bitcoin rising in the coming month for each month, and whether performance from the start of the year is positive or negative.
Scenarios for 2026
Positive scenario:
- Strong Q2 recovery
- A corrective summer
- The second half of the year continues higher
Negative scenario:
- Weak Q2
- The selloff returns in Q3
- The “good months” stop working
To get back to breakeven for the first half of the year, Bitcoin needs to rise by >20% in Q2.
Conclusion
Bitcoin’s seasonality isn’t “wrong”—but for the most part, it’s conditional.
- Not every “good” month is truly an edge
- Seasonality can’t be separated from market conditions
- And you can’t ignore the year’s path
The real edge isn’t remembering which months go up—it’s recognizing when the market is healthy enough for those months to actually work.
For 2026, everything comes down to one point:
Q2 is the decisive test.
If Bitcoin repairs enough in Q2, the second half has a basis to be optimistic. If not, then no matter what history says, the real trend will still dominate everything.
Disclaimer: The information on this page may come from third parties and does not represent the views or opinions of Gate. The content displayed on this page is for reference only and does not constitute any financial, investment, or legal advice. Gate does not guarantee the accuracy or completeness of the information and shall not be liable for any losses arising from the use of this information. Virtual asset investments carry high risks and are subject to significant price volatility. You may lose all of your invested principal. Please fully understand the relevant risks and make prudent decisions based on your own financial situation and risk tolerance. For details, please refer to
Disclaimer.
