
For many years, XRP has struggled to keep up with Bitcoin when measured against the BTC pair. However, a new analysis suggests the long period of underperformance may be approaching a turning point.
Top analyst Egrag Crypto showed a hidden liquidity cycle can be observed on the chart of the XRP/BTC pair, indicating when the XRP price will be able to gain strength in relation to the price of Bitcoin
In fact, the XRP/BTC pair has declined by 4.23% in the year 2025 so far, trading at 0.00002014 BTC. This is in line with an overall trend that has seen the XRP price find it hard to gain traction against the BTC.
Although there have been periods of high price action in terms of the dollar value of XRP, the asset has not been able to find traction against the BTC in the same period. As such, the XRP/BTC pair has been rather weak in recent times.
In fact, an overall look at the macro trends indicates that the recent performance of the pair is not necessarily random.
- The 8-Year Liquidity Cycle
- What the XRPBTC Chart Shows Now
- Why 0.000017 BTC Matters FOR XRP
The 8-Year Liquidity Cycle
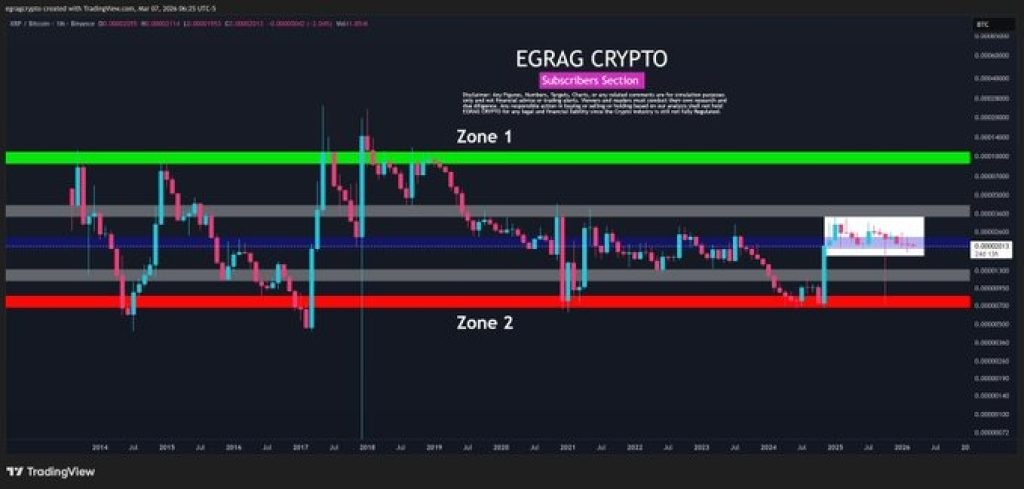
Egrag Crypto shared that the XRP/BTC pair appears to move within an eight-year macro liquidity cycle that divides the market into several key zones.
The chart highlights a green zone at the top of the range where the XRP price historically becomes highly extended against Bitcoin. At the opposite end sits a red zone that has repeatedly acted as a major undervaluation area for the pair.
Between these two extremes lies a broad gray range where the market tends to spend most of its time consolidating. Historically, XRP/BTC moves through these phases over several years before eventually transitioning into a new expansion phase.
What the XRPBTC Chart Shows Now
We took a look at the long-term chart structure, the XRP/BTC pair has already reached the lower end of the cycle and bounced back into the gray zone. Since that point, the price has been ranging while building a consolidation zone.
The price structure of the pair indicates that the pair is currently building liquidity in this zone.
The chart also shows that previous cycles followed a similar pattern where extended periods of sideways movement eventually led to a strong directional move.
At the moment, the XRP price remains within this gray range, which historically acts as a transition area between accumulation and expansion.
_****ChatGPT Predicts Bittensor (TAO) Price if a Supply Crunch Hits While 68% of Tokens Are Staked**
Source: X/theCryptoBasic
Why 0.000017 BTC Matters FOR XRP
The analysis points out the importance of the 0.000017 BTC level, which may be a major point of resistance in the coming days. A breakthrough past this level will be a sign that XRP is finally gaining strength against Bitcoin.
Generally, similar moves in the XRP/BTC chart have marked the start of a period of time where capital is flowing from Bitcoin into XRP.
When this occurs, the XRP tends to perform better against the BTC pair while also showing greater price appreciation in dollar value.
For the time being, the market is consolidating in this area, but the price is being monitored as a possible trigger for a bigger move to come.
If the XRP price is able to break and hold above the 0.000017 BTC price threshold, it could be the start of a period where the asset is finally able to outperform the bitcoin price
Disclaimer: The information on this page may come from third parties and does not represent the views or opinions of Gate. The content displayed on this page is for reference only and does not constitute any financial, investment, or legal advice. Gate does not guarantee the accuracy or completeness of the information and shall not be liable for any losses arising from the use of this information. Virtual asset investments carry high risks and are subject to significant price volatility. You may lose all of your invested principal. Please fully understand the relevant risks and make prudent decisions based on your own financial situation and risk tolerance. For details, please refer to
Disclaimer.
Related Articles
Morgan Stanley Purchases 177.76 BTC Worth $13.75 Million
Gate News message, Morgan Stanley bought 177.76 BTC worth $13.75M three hours ago. The firm now holds 1,347.54 BTC worth $103.94M in total.
GateNews1h ago
BTC fell below 77000 USDT
Gate News bot message, Gate quotes show that BTC fell below 77000 USDT, trading at 76961.6 USDT.
CryptoRadar2h ago
NYSE Welcomes Morgan Stanley’s MSBT Launch as First Spot Bitcoin ETF Issued by a Major US Bank
Bank-backed bitcoin ETFs are accelerating institutional adoption and strengthening market credibility. The NYSE marked a new milestone as Morgan Stanley Investment Management rang the closing bell and celebrated the launch of MSBT, which the NYSE described as the first spot bitcoin ETF by a major
Coinpedia6h ago
BTC falls 0.49% in 15 minutes: fragile long leverage and active sell-off pressure resonate to weigh on the short term
From 18:00 to 18:15 (UTC) on 2026-04-17, the BTC price fluctuated and trended downward within the 77097.4 to 77573.2 USDT range. Over these 15 minutes, the return rate recorded -0.49%, and the amplitude reached 0.61%. During this period, market trading was active; short-term volatility was amplified, and trading attention increased significantly. The main driver behind this abnormal move is that the overall leverage structure is bearish and long positions are fragile. At present, the BTC perpetual contract funding rate has remained negative for 11 consecutive days, indicating that the bears have the upper hand in the market. In addition, futures open interest (OI) is about 628.3 billion USDT, which is at a historical high. During the anomaly window, trading volume increased noticeably. On-chain data shows large amounts of BTC flowing from long-term holder addresses to exchanges, suggesting that active sell orders may have triggered longs to passively reduce positions, amplifying downward price pressure. Moreover, institutional positioning enthusiasm in the mainstream contract market has cooled off; liquidity boundaries have tightened, causing large-trade activity to have an amplified effect on market volatility. In the options market, implied volatility rose to 39.81%, increasing demand for downside protection and reflecting a defensive posture among market participants. Macro-environment volatility and some capital flowing into safe-haven assets, together with the recent regulatory uncertainty-related historical events, reinforced the move, pushing overall market risk appetite lower. Current BTC leverage risks still remain. If, in the future, there are concentrated sell-offs, volatility may be further amplified. It is recommended to continue monitoring sustained high OI levels, the persistence of negative funding rates, and on-chain transfers of large amounts of funds, and to stay alert for whale behavior and any disruptions to market sentiment caused by macro-policy developments. For subsequent price action, please watch key support levels, institutional and whale on-chain moves, and relevant global market news, and guard against short-term risks.
GateNews7h ago
Bitcoin Liquidations Hit $815M as BTC Surges Above $78K Amid Iran Strait Opening
Over $815 million in leveraged cryptocurrency positions were liquidated recently, mainly due to short positions against Bitcoin. Markets improved as Iran reopened the Strait of Hormuz and Trump hinted at a deal with Iran, boosting Bitcoin prices significantly.
GateNews7h ago
