In brief
- Bitcoin is up 4.78% today trading at $69,128.
- Last week’s apparent triangle breakout closed as a massive bullish wick — a classic false breakout signal.
- On Myriad, prediction market traders are split among bulls and bears, with no clear consensus on which way the squeeze resolves.
Traditional markets are acting spooked as geopolitical tensions rise. The VIX—Wall Street’s “fear gauge” measuring expected volatility in the S&P 500—surged above 35, its highest level in nearly a year, as oil prices briefly spiked toward $120 per barrel following U.S. and Israeli strikes on Iran. Stocks fell. Gold fell. Pretty much everything that was supposed to be a safe haven wasn’t.
Bitcoin, true to form, decided to go a different direction. Almost every coin in the top 10 by market capitalization opened in the green today—Tron being the lone holdout. Bitcoin is currently trading above $69,000, up nearly 4.3% today, which would sound great for holders if the longer term charts didn’t have some awkward things to say about it.
On Myriad, a prediction market run by Decrypt’s parent company Dastan, traders are essentially split between Bitcoin pumping to $84K or dumping to $55K, with odds slightly bearish. Traders are currently pricing in odds at 57% on the downside; not exactly a ringing endorsement of this bounce.
The broader macro question of which bubble bursts first, crypto or equities, is very much alive, especially with the VIX spiking and oil markets in chaos. Bitcoin’s own volatility index, the BVIV, already peaked above 96 in early February when BTC touched $60,000, and the Crypto Fear and Greed Index has been in the fear zone for most of 2026 so far.
What happens in traditional markets this week will matter, especially considering Bitcoin is trading in a compression zone. If equities continue selling off and the VIX keeps climbing, risk assets face real pressure regardless of any intraday bounce. Traders will want to watch equity futures—they’ll act as a ceiling or floor for how far this move actually goes.
Bitcoin (BTC) price: The breakout that wasn’t
Bitcoin opened today’s session at $65,974 and is currently trading at $69,128—a 4.78% jump with an intraday high of $69,497. On the surface, that reads like bullish news, but looking at the broader picture makes this assumption more complicated.
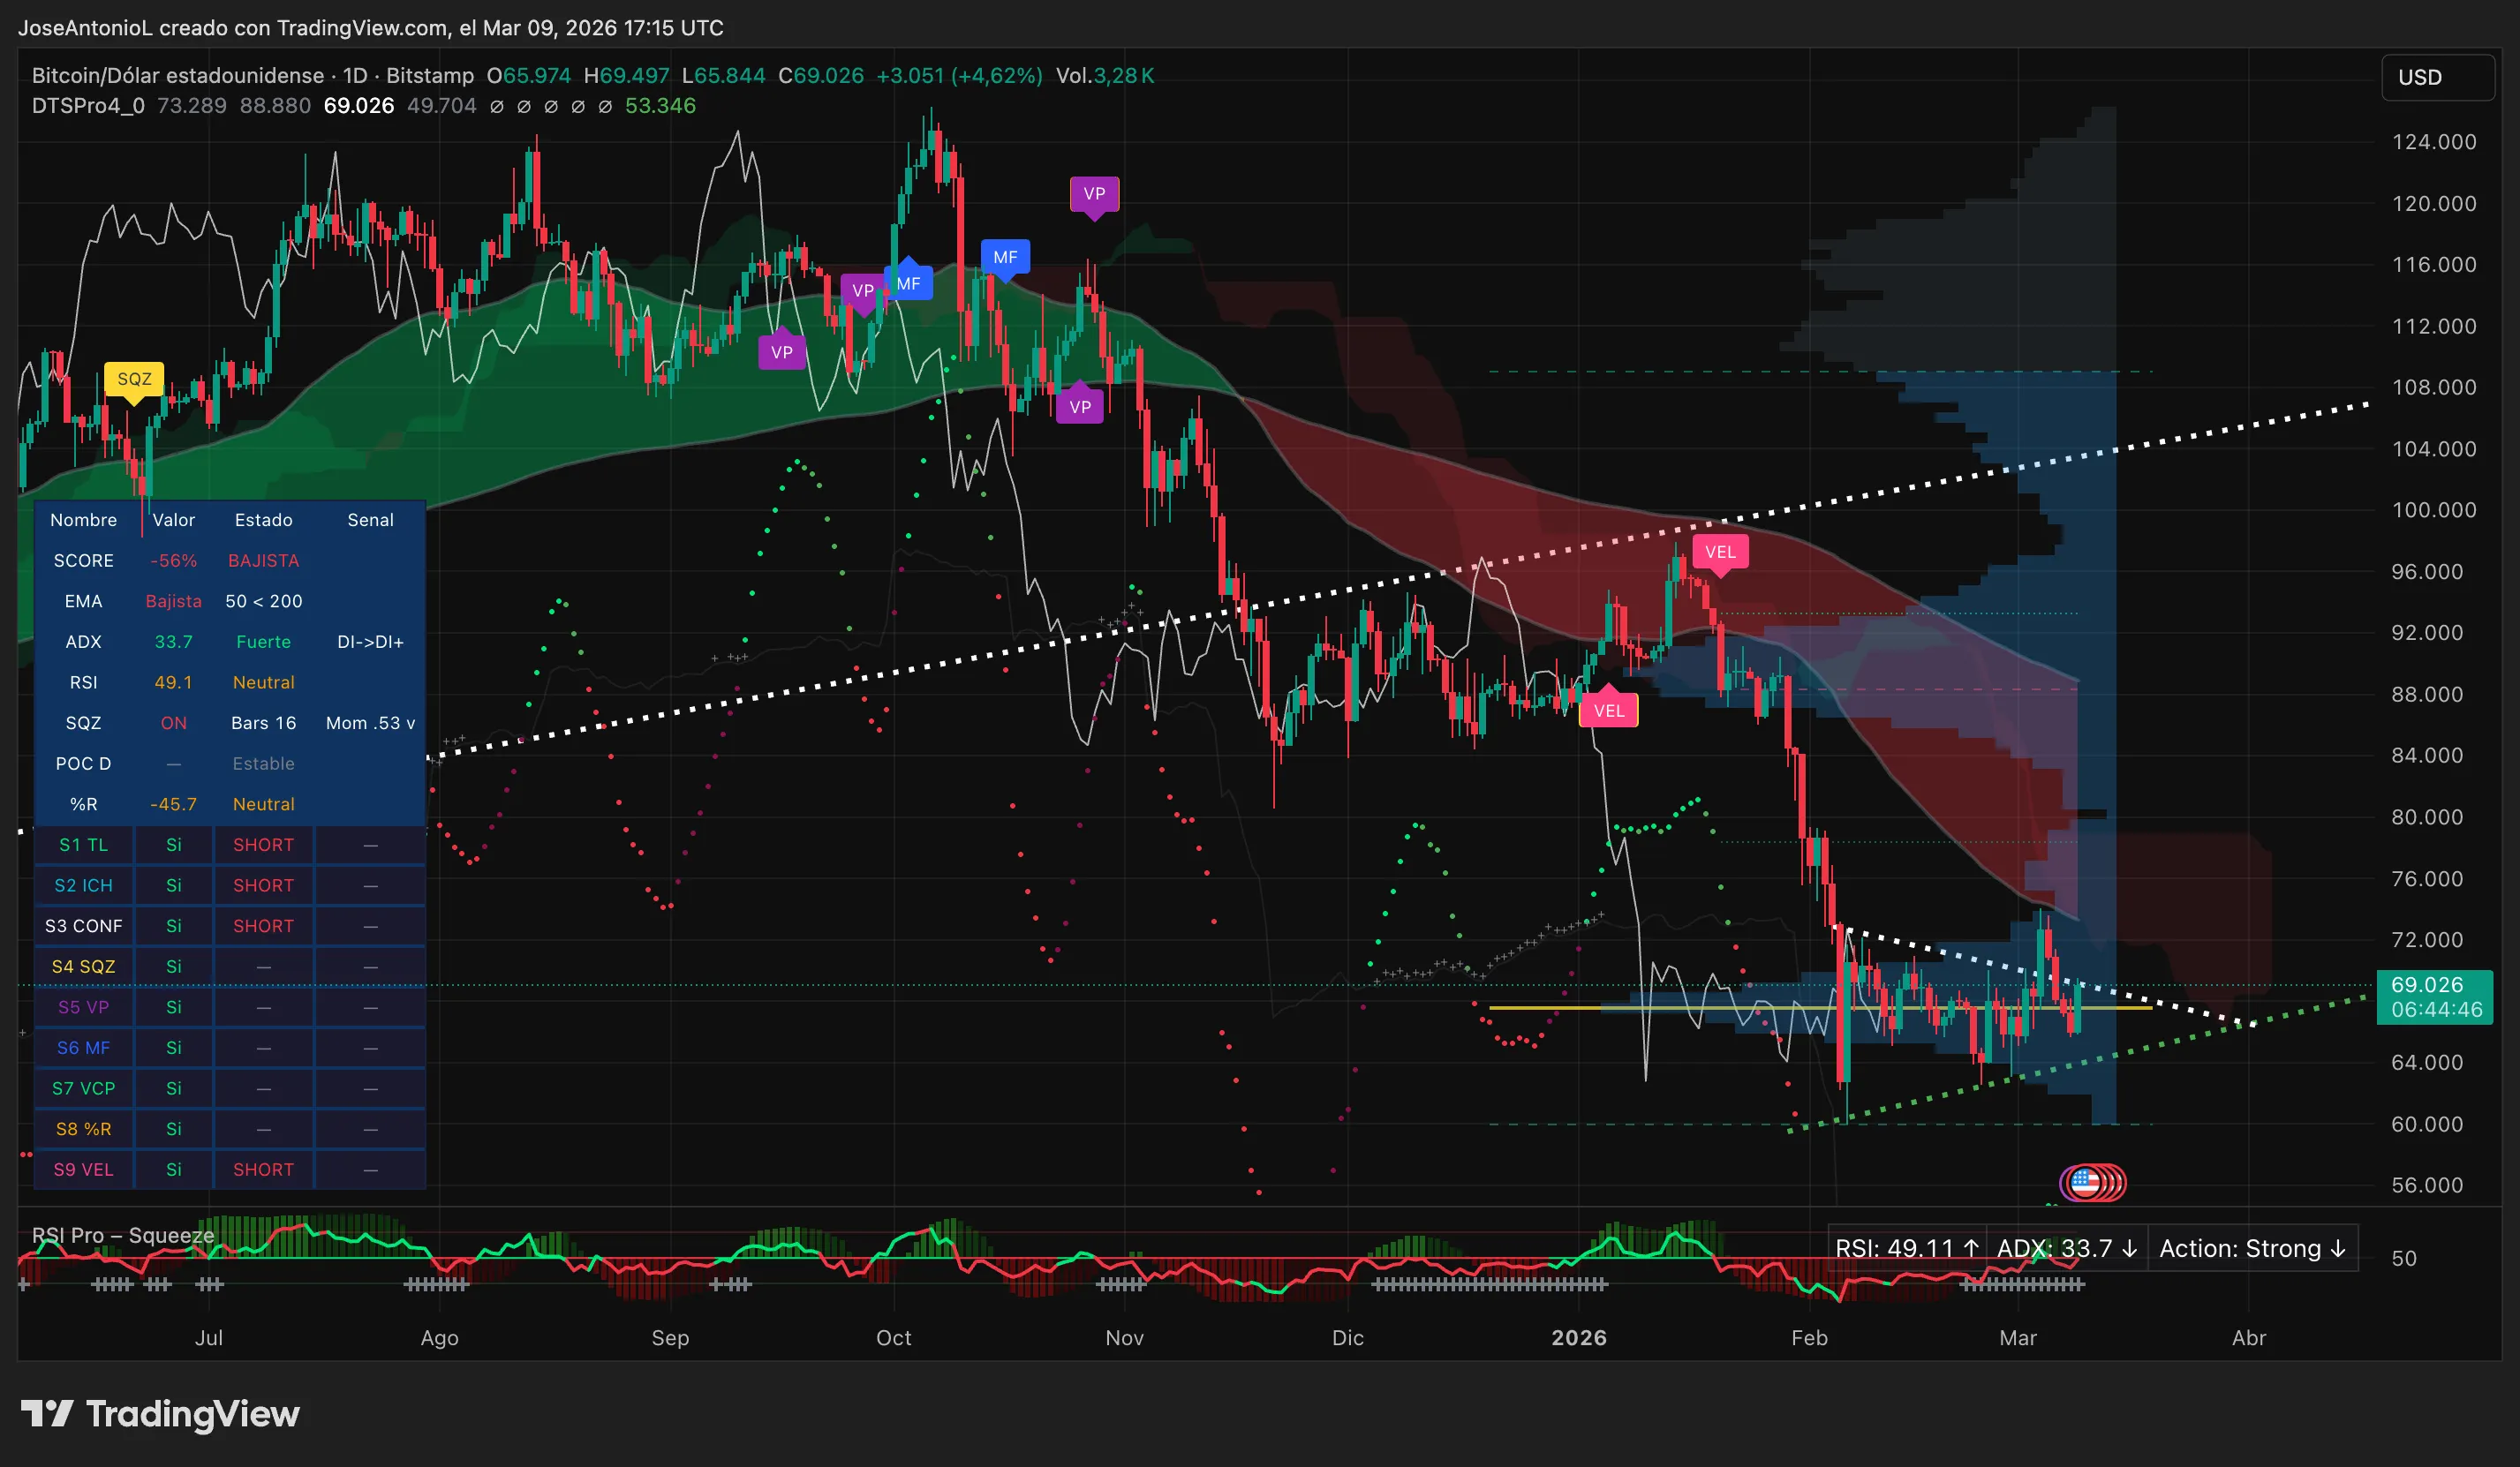
Bitcoin (BTC) price data. Image: Tradingview
Last week, Bitcoin printed what looked like a clean breakout above the descending triangle that’s been compressing its price since February. But the week closed with the price of Bitcoin back inside the triangle. What appeared to be a breakout was mostly a wick in the weekly charts—technically closer to an inverted doji (a candlestick with no body and big wicks), a signal that sellers absorbed all the buying pressure and rejected the move hard. The triangle swallowed the breakout whole. Today traders are trying again.
The Average Directional Index, or ADX, sits at 33.7. ADX measures trend strength on a scale from 0 to 100, with readings above 25 confirming a genuine trend is in play—and 33.7 puts Bitcoin squarely in “strong trend” territory. But the ADX during this bear run has been stronger and is receding. That’s not a confirmation that bulls have taken over, but it can be interpreted as a sign that the tug-of-war is tightening even though things don’t look good for long-term bulls at the moment.
Until Bitcoin actually escapes the triangle and holds above it, the ADX shift is a yellow light, not a green one.
The Relative Strength Index, or RSI, reads 49.3. RSI is a momentum oscillator running from 0 to 100—below 30 signals oversold conditions, above 70 signals overbought, and 50 is the neutral midpoint. At 49.3, Bitcoin is flat on the fence. It hasn’t exhausted buyers, but hasn’t attracted enough conviction to push into bullish momentum territory either. Traders typically want to see RSI clear and hold above 50 before calling a meaningful momentum shift. Right now it’s just parked there, noncommittal.
The Exponential Moving Averages, or EMAs, tell the clearest story. The 50-day EMA—which tracks average prices over the last 50 sessions to reflect medium-term momentum—is sitting below the 200-day EMA. That’s a major bearish setup considering the gap is getting wider. EMAs show trend direction by weighting recent prices more heavily, and when the short-term average is below the long-term one, it means recent price action is weaker than the broader trend.
For bears to genuinely lose their grip, Bitcoin needs more than a session spike to $69K. What bulls actually need is a series of daily closes above the descending trendline—currently running near $73,000–$75,000, close to where the 50-day EMA sits at $73,293. Bullish traders would want to see rising ADX confirming that the move has real trend strength behind it, not just a VIX-driven risk-on blip. Anything short of that, and this remains a probe of resistance inside a compression zone.
Today’s 4.78% pop gives intraday traders something to work with, but swing traders and holders are still inside a bearish structure until Bitcoin posts convincing closes above $73,000–$75,000 on volume. Lose the $65,000–$66,000 volume shelf below—the price level where most of the recent trading has concentrated—and the path toward $60,000 opens up fast.
Disclaimer
The views and opinions expressed by the author are for informational purposes only and do not constitute financial, investment, or other advice.
Disclaimer: The information on this page may come from third parties and does not represent the views or opinions of Gate. The content displayed on this page is for reference only and does not constitute any financial, investment, or legal advice. Gate does not guarantee the accuracy or completeness of the information and shall not be liable for any losses arising from the use of this information. Virtual asset investments carry high risks and are subject to significant price volatility. You may lose all of your invested principal. Please fully understand the relevant risks and make prudent decisions based on your own financial situation and risk tolerance. For details, please refer to
Disclaimer.
Related Articles
NYSE Welcomes Morgan Stanley’s MSBT Launch as First Spot Bitcoin ETF Issued by a Major US Bank
Bank-backed bitcoin ETFs are accelerating institutional adoption and strengthening market credibility. The NYSE marked a new milestone as Morgan Stanley Investment Management rang the closing bell and celebrated the launch of MSBT, which the NYSE described as the first spot bitcoin ETF by a major
Coinpedia3h ago
BTC falls 0.49% in 15 minutes: fragile long leverage and active sell-off pressure resonate to weigh on the short term
From 18:00 to 18:15 (UTC) on 2026-04-17, the BTC price fluctuated and trended downward within the 77097.4 to 77573.2 USDT range. Over these 15 minutes, the return rate recorded -0.49%, and the amplitude reached 0.61%. During this period, market trading was active; short-term volatility was amplified, and trading attention increased significantly. The main driver behind this abnormal move is that the overall leverage structure is bearish and long positions are fragile. At present, the BTC perpetual contract funding rate has remained negative for 11 consecutive days, indicating that the bears have the upper hand in the market. In addition, futures open interest (OI) is about 628.3 billion USDT, which is at a historical high. During the anomaly window, trading volume increased noticeably. On-chain data shows large amounts of BTC flowing from long-term holder addresses to exchanges, suggesting that active sell orders may have triggered longs to passively reduce positions, amplifying downward price pressure. Moreover, institutional positioning enthusiasm in the mainstream contract market has cooled off; liquidity boundaries have tightened, causing large-trade activity to have an amplified effect on market volatility. In the options market, implied volatility rose to 39.81%, increasing demand for downside protection and reflecting a defensive posture among market participants. Macro-environment volatility and some capital flowing into safe-haven assets, together with the recent regulatory uncertainty-related historical events, reinforced the move, pushing overall market risk appetite lower. Current BTC leverage risks still remain. If, in the future, there are concentrated sell-offs, volatility may be further amplified. It is recommended to continue monitoring sustained high OI levels, the persistence of negative funding rates, and on-chain transfers of large amounts of funds, and to stay alert for whale behavior and any disruptions to market sentiment caused by macro-policy developments. For subsequent price action, please watch key support levels, institutional and whale on-chain moves, and relevant global market news, and guard against short-term risks.
GateNews4h ago
Bitcoin Liquidations Hit $815M as BTC Surges Above $78K Amid Iran Strait Opening
Over $815 million in leveraged cryptocurrency positions were liquidated recently, mainly due to short positions against Bitcoin. Markets improved as Iran reopened the Strait of Hormuz and Trump hinted at a deal with Iran, boosting Bitcoin prices significantly.
GateNews4h ago
Cardano Founder Hoskinson Warns BIP-361 Could Freeze 1.7M Bitcoin
Charles Hoskinson warned that Bitcoin's BIP-361 upgrade, meant to address quantum threats, is wrongly classified as a soft fork. It could freeze 1.7 million BTC, including 1 million from Satoshi Nakamoto, as early coin owners can't prove ownership.
GateNews5h ago
BTC drops 0.45% in 15 minutes: Whale concentrated transfers into exchanges stack up sell pressure while leverage withdrawals amplify the pullback
From 17:00 to 17:15 (UTC) on 2026-04-17, BTC saw a brief drop. The return rate recorded was -0.45%, with the price ranging from 77354.3 to 77916.9 USDT and a swing of 0.72%. During the event, market attention warmed up, volatility intensified, and spot market liquidity changed significantly.
The main driver of this price anomaly was that whale wallets concentrated transfers to exchanges. In a single 15-minute period, the exchange inflow surged to 11,000 BTC, reaching a new high since December 2025. The average amount deposited per transaction was as high as 2.25 BTC, indicating that large holders chose key price levels to concentrate and release their positions, clearly lifting sell pressure. At the same time, BTC futures open interest fell to a 14-month low of $841 million, as leverage funds exited sharply. The spot market’s pull on price fluctuations became the main factor, further magnifying the impact of whale trading.
In addition, although ETF funds had a net inflow with a hedging effect—bringing the April cumulative inflow to $5.651 billion—within this anomaly window they were not able to fully absorb large sell orders. The spot market mainly relied on institutional buying to digest the selling pressure, and overall risk appetite contracted. On-chain data shows that 41% of the BTC supply is in a loss-making range, and some holders who bought at lower prices face take-profit and stop-loss pressure. With multiple factors converging, short-term tension formed among exchange inflows, leverage withdrawal, profit realization, and institutions’ ability to absorb, increasing the magnitude of spot volatility.
Short-term risks are worth watching closely. Users should closely monitor core indicators such as the subsequent exchange inflow volume, the pace of ETF net inflows, and futures open interest. If whale sell orders still have not eased and ETF inflows cannot accelerate in step, the BTC price may remain under sustained pressure. Users should focus on on-chain transfers and changes in major holders’ positions, watch the spot market’s key support ranges and trading structure, obtain more market information in a timely manner, and stay alert to risks brought by sharp volatility.
GateNews5h ago
