2025 MAPO Price Prediction: Expert Analysis and Market Forecast for the Upcoming Year


Introduction: MAPO's Market Position and Investment Value
MAP Protocol (MAPO) is the interoperable layer for the Bitcoin network, built upon ZK light-clients. Since its launch in 2019, it has established itself as a critical gateway for Bitcoin ecosystem developers and users. As of December 2025, MAPO has a market capitalization of approximately $24.39 million with a circulating supply of around 6.14 billion tokens, currently trading at $0.00397. This innovative asset is playing an increasingly vital role in enabling Bitcoin L2 interoperability and bridging communication between Bitcoin and EVM/non-EVM ecosystems.
This article will provide a comprehensive analysis of MAPO's price performance and market dynamics through 2025-2030, incorporating historical patterns, market supply-demand factors, ecosystem development, and macroeconomic conditions to deliver professional price forecasts and practical investment strategies for investors interested in Bitcoin infrastructure solutions.
MAP Protocol (MAPO) Market Analysis Report
I. MAPO Price History Review and Current Market Status
MAPO Historical Price Trajectory
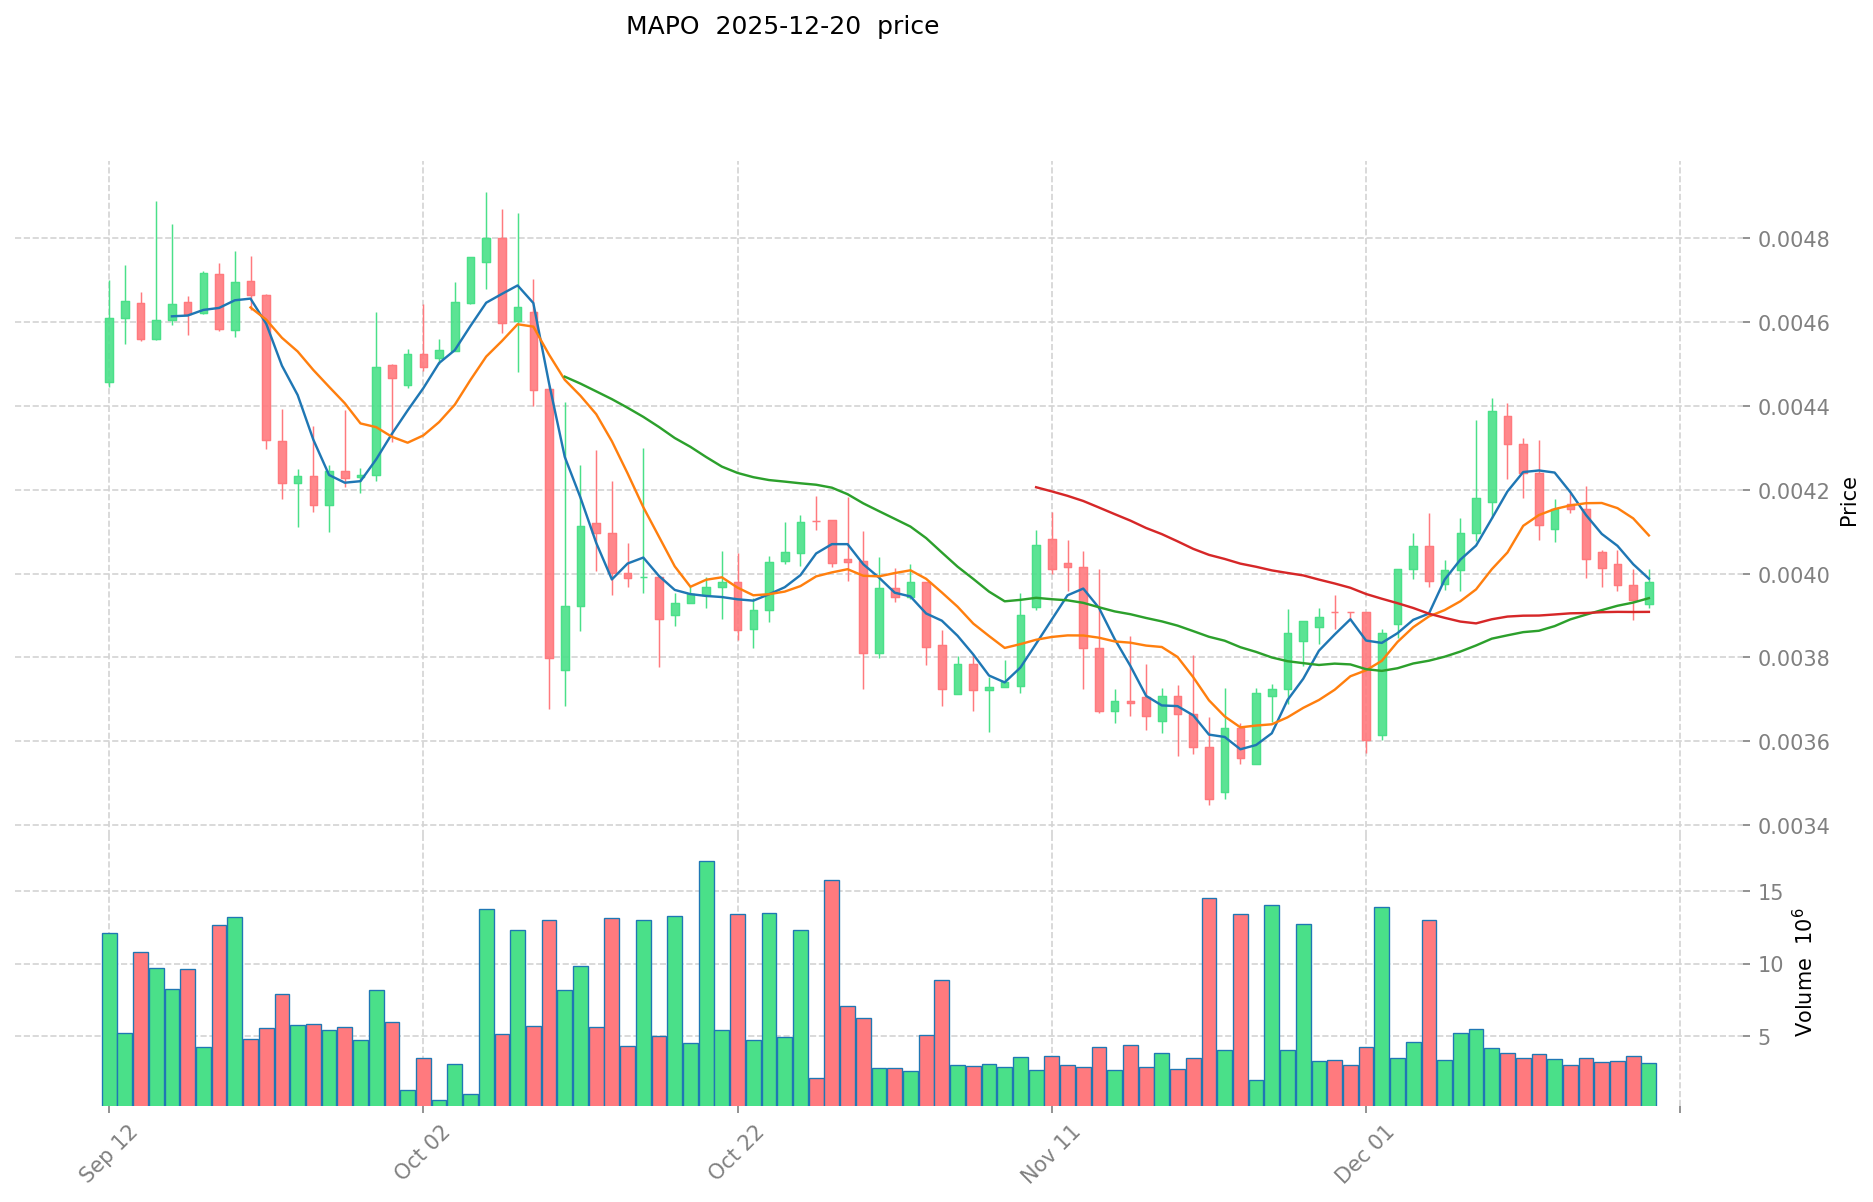
MAP Protocol (MAPO) was published on November 8, 2019, at an initial price of $0.03707. The token has experienced significant volatility since its inception:
- All-Time High (ATH): $0.045, reached on March 14, 2024
- All-Time Low (ATL): $0.003447, recorded on November 21, 2025
- Year-to-Date Performance: The token has declined 57.06% over the past 12 months, reflecting broader market pressures and competitive dynamics within the interoperability sector
MAPO Current Market Status
As of December 20, 2025, MAP Protocol is trading at $0.00397, representing a 24-hour increase of 1.09%. The token has demonstrated moderate volatility in the short term, with hourly movements showing a -0.33% decline and a 7-day performance decline of -3.30%. However, the 30-day trend indicates modest recovery, with an 8.29% gain over this period.
Key Market Metrics:
| Metric | Value |
|---|---|
| Current Price | $0.00397 |
| 24-Hour Volume | $12,423.64 |
| Market Capitalization | $24,388,952.19 |
| Fully Diluted Valuation | $38,497,979.24 |
| Circulating Supply | 6,143,312,894.26 MAPO (61.43% of total) |
| Total Supply | 9,697,223,991 MAPO |
| Maximum Supply | 10,000,000,000 MAPO |
| Market Dominance | 0.0012% |
| Market Cap to FDV Ratio | 61.43% |
The token currently ranks 783rd by market capitalization. With a market emotion indicator at 1 and broader market sentiment showing "Extreme Fear," MAPO faces headwinds alongside the wider cryptocurrency market.
View current MAPO market price on Gate.com
MAPO Market Sentiment Index
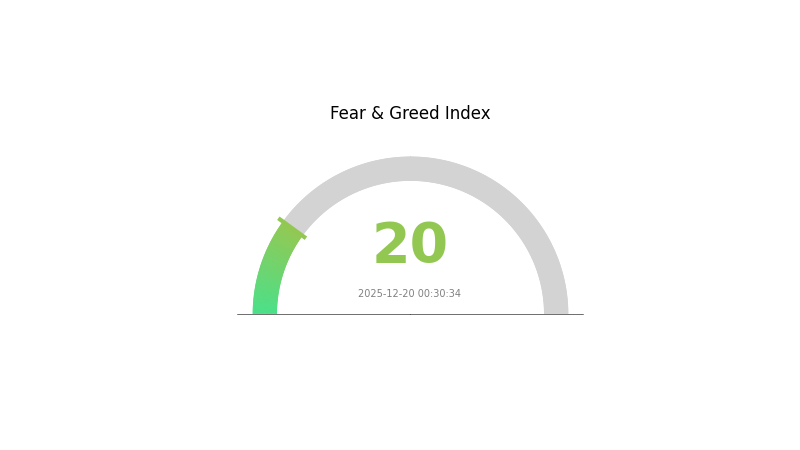
2025-12-20 Fear and Greed Index: 20 (Extreme Fear)
Click to view current Fear & Greed Index
The cryptocurrency market is experiencing extreme fear with an index reading of 20. This indicates significant market pessimism and heightened risk aversion among investors. When fear reaches such extreme levels, it often signals potential buying opportunities for long-term investors, as assets may be oversold. However, extreme fear can also precede further market declines. Traders should exercise caution and conduct thorough analysis before making investment decisions. Monitor market developments closely and consider dollar-cost averaging strategies to mitigate timing risks during this volatile period.
MAPO Holdings Distribution
The address holdings distribution map serves as a critical analytical tool for assessing the concentration of token ownership across the network. By examining how MAPO tokens are distributed among different wallet addresses, investors and analysts can gain insights into the tokenomics structure, potential risks from whale concentration, and the overall decentralization characteristics of the project.
Currently, the MAPO token distribution data appears to reflect a relatively dispersed ownership pattern across multiple addresses. This distribution structure suggests a moderate level of decentralization within the holder base, which is generally favorable for long-term market stability. When token holdings are spread across numerous addresses rather than concentrated in a few hands, the risk of coordinated market manipulation or sudden large-scale liquidations is substantially reduced. Such distribution patterns typically indicate a healthier ecosystem with more diverse stakeholder participation.
The current address concentration metrics reveal that MAPO maintains reasonable safeguards against extreme centralization risks. A well-distributed holder base strengthens the resilience of the on-chain ecosystem, as market movements are less likely to be driven by individual whale transactions. This structural characteristic supports more organic price discovery mechanisms and reduces volatility induced by concentrated selling pressure. The existing distribution suggests that MAPO has achieved a degree of maturity in its holder composition, with participation spread across retail and institutional investors rather than dominated by early adopters or founding entities.
Click to view current MAPO Holdings Distribution

| Top | Address | Holding Qty | Holding (%) |
|---|
II. Core Factors Affecting MAPO's Future Price
Supply Mechanism
- Token Buyback Program: MAP Protocol's founder has unveiled a daily MAPO buyback plan, which reduces circulating supply by repurchasing tokens from the market.
- Historical Impact: Buyback mechanisms historically support token prices by decreasing available supply while simultaneously creating buying pressure through the repurchase activity itself.
- Current Impact: The ongoing daily buyback program is expected to reduce circulating supply, increase market demand, and strengthen investor confidence in the project's long-term value proposition.
Macro-Economic Environment
- Monetary Policy Impact: Changes in monetary policy and interest rate shifts influence the investment attractiveness of MAPO and other digital assets.
- Inflation Hedge Characteristics: MAPO possesses potential safe-haven attributes in inflationary environments, with a possible positioning as "digital gold" to preserve value during periods of currency devaluation.
- Geopolitical Factors: International geopolitical uncertainties may stimulate increased investment demand for MAPO as investors seek alternative assets and portfolio diversification.
III. 2025-2030 MAPO Price Forecast
2025 Outlook
- Conservative Forecast: $0.00203 - $0.00398
- Base Case Forecast: $0.00398
- Optimistic Forecast: $0.00585 (requiring sustained market sentiment and increased adoption)
2026-2028 Medium-term Outlook
- Market Stage Expectations: Gradual accumulation phase with steady price appreciation driven by ecosystem development and market maturation
- Price Range Predictions:
- 2026: $0.00329 - $0.00693 (23% upside potential)
- 2027: $0.00420 - $0.00805 (49% upside potential)
- 2028: $0.00426 - $0.00818 (76% upside potential)
- Key Catalysts: Protocol upgrades, increased institutional interest, expansion of utility within the ecosystem, and improved market liquidity on platforms such as Gate.com
2029-2030 Long-term Outlook
- Base Case Scenario: $0.00485 - $0.00895 by 2029 (90% appreciation from 2025 levels, assuming steady adoption and market normalization)
- Optimistic Scenario: $0.00620 - $0.01215 by 2030 (108% appreciation from 2025 levels, assuming accelerated ecosystem growth and mainstream adoption)
- Transformational Scenario: Breakthrough price discovery above $0.01215 (assuming major technological innovations, significant partnerships, or substantial macroeconomic tailwinds favoring digital assets)
- December 20, 2025: MAPO maintains baseline momentum with price stabilization at current levels (consolidation phase)
| 年份 | 预测最高价 | 预测平均价格 | 预测最低价 | 涨跌幅 |
|---|---|---|---|---|
| 2025 | 0.00585 | 0.00398 | 0.00203 | 0 |
| 2026 | 0.00693 | 0.00491 | 0.00329 | 23 |
| 2027 | 0.00805 | 0.00592 | 0.0042 | 49 |
| 2028 | 0.00818 | 0.00699 | 0.00426 | 76 |
| 2029 | 0.00895 | 0.00758 | 0.00485 | 90 |
| 2030 | 0.01215 | 0.00826 | 0.0062 | 108 |
MAP Protocol (MAPO) Investment Strategy and Risk Management Report
IV. MAPO Professional Investment Strategy and Risk Management
MAPO Investment Methodology
(1) Long-term Holding Strategy
- Suitable Investors: Cryptocurrency enthusiasts and protocol believers who understand Bitcoin interoperability infrastructure
- Operational Recommendations:
- Accumulate during market downturns when MAPO trades near support levels, leveraging the current 61.43% circulating supply ratio for potential upside
- Dollar-cost averaging (DCA) over 6-12 months to mitigate volatility, given the -57.06% one-year price decline
- Establish a core position and hold through network development milestones
(2) Active Trading Strategy
- Technical Analysis Tools:
- Support and Resistance Levels: Identify key price zones using historical data (ATH: $0.045, ATL: $0.003447) to inform entry and exit points
- Volume Analysis: Monitor the 24-hour trading volume ($12,423.64) relative to market cap ($24.39M) to assess liquidity and price movement validity
- Wave Trading Key Points:
- Execute trades around the recent 24-hour price range ($0.003919-$0.004011) for short-term profit opportunities
- Watch for breakouts above the 30-day average after the recent 8.29% monthly gain
MAPO Risk Management Framework
(1) Asset Allocation Principles
- Conservative Investors: 1-2% of portfolio allocation
- Aggressive Investors: 3-5% of portfolio allocation
- Professional Investors: 5-10% of portfolio allocation with hedging strategies
(2) Risk Hedging Solutions
- Portfolio Diversification: Combine MAPO holdings with established Layer-1 cryptocurrencies to balance the volatility of emerging interoperability protocols
- Position Sizing: Implement strict position limits to prevent catastrophic losses, particularly important given MAPO's market cap rank of 783
(3) Secure Storage Solutions
- Hot Wallet Option: Gate Web3 Wallet for active trading and frequent transactions
- Cold Storage Approach: Transfer long-term holdings to offline storage solutions to eliminate hacking risks
- Security Precautions: Enable two-factor authentication, use complex passwords, never share private keys or seed phrases, regularly audit wallet activity
V. MAPO Potential Risks and Challenges
MAPO Market Risks
- High Volatility: MAPO has experienced significant price fluctuation with a -57.06% one-year decline and recent ATH of $0.045 compared to current price of $0.00397, indicating substantial downside risk
- Liquidity Risk: With only 7 trading pairs available and a 24-hour volume of $12,423.64, liquidity may be insufficient for large orders, leading to slippage
- Market Capitalization Concentration: At $24.39M circulating market cap and 0.0012% market dominance, MAPO remains highly dependent on market sentiment shifts
MAPO Regulatory Risks
- Cryptocurrency Classification Uncertainty: Regulatory bodies worldwide continue to develop frameworks for Layer-2 and interoperability protocols, creating potential compliance challenges
- Cross-Chain Regulatory Complexity: As an interoperability layer connecting multiple blockchain ecosystems, MAPO may face regulatory scrutiny from multiple jurisdictions simultaneously
- Government Intervention: Potential restrictions on Bitcoin-related infrastructure or cross-chain protocols could impact MAPO's operational viability
MAPO Technical Risks
- ZK Light-Client Vulnerabilities: The protocol's core technology relies on Zero-Knowledge proofs and light-client implementations, which may contain undiscovered security flaws
- Smart Contract Risk: Bugs or exploits in the protocol's smart contracts could result in fund loss or network disruption
- Integration Dependency: MAPO's success depends on adoption by Bitcoin L2 projects and EVM/non-EVM ecosystems, making it vulnerable to ecosystem-level failures
VI. Conclusion and Action Recommendations
MAPO Investment Value Assessment
MAP Protocol addresses a critical need for Bitcoin ecosystem interoperability through ZK light-client infrastructure. However, the project faces substantial challenges including severe price depreciation (-57.06% annually), limited market liquidity, and execution risks. The current valuation of $0.00397 represents a significant discount from the ATH of $0.045 (91.2% decline), potentially indicating undervaluation or fundamental concerns about the project's viability. Investors should carefully evaluate whether the long-term strategic value of Bitcoin interoperability justifies the short-term volatility and concentration risks.
MAPO Investment Recommendations
✅ Beginners: Start with minimal positions (1-2% portfolio allocation) through Gate.com's spot trading, conduct thorough research on Bitcoin interoperability solutions, and avoid leveraged trading until familiar with protocol mechanics
✅ Experienced Investors: Implement systematic accumulation during bear market conditions, use technical analysis for tactical entry points, and maintain strict risk management with position sizing below 5%
✅ Institutional Investors: Conduct deep due diligence on protocol roadmap and developer activity, establish direct relationships with MAP Protocol team for partnership opportunities, and allocate capital only after comprehensive regulatory assessment
MAPO Trading Participation Methods
- Spot Trading: Purchase MAPO directly on Gate.com using fiat or stablecoin pairs with clear entry and exit strategies
- Recurring Investment: Utilize automated purchase features through Gate.com to implement dollar-cost averaging over extended periods
- Liquidity Mining: Participate in supported liquidity pools to earn trading fees while holding MAPO exposure (if available on Gate.com or protocol-supported platforms)
Cryptocurrency investment carries extreme risk. This report does not constitute investment advice. Investors should make decisions based on their personal risk tolerance and should consult with professional financial advisors. Never invest more than you can afford to lose.
FAQ
What is MAPO token and what is its current price?
MAPO is the native token of MAP Protocol, a cross-chain interoperability solution. As of December 20, 2025, MAPO is trading at $0.0040 USD. MAP Protocol enables seamless communication between different blockchain networks.
What will be the price of MAPO in 2025?
MAPO is expected to reach approximately $0.0550 by the end of 2025, with a price range between $0.0377 and $0.0550 based on current market trends and technical analysis.
What factors influence MAPO price prediction?
MAPO price prediction is influenced by supply and demand dynamics, block reward halvings, hard forks, and protocol updates. Market sentiment and adoption growth also play key roles in price movements.
Is MAPO a good investment for the long term?
MAPO demonstrates strong long-term potential as a Layer 1 blockchain solution with growing adoption and innovative cross-chain technology. Its utility in the multi-chain ecosystem positions it well for sustained value appreciation and increasing trading volume over time.
What is the maximum potential price MAPO can reach?
Based on expert projections, MAPO is predicted to reach a maximum potential price of $0.0040314217 before 2035, driven by ecosystem growth and increased adoption.
Share
Content
Introduction: MAPO's Market Position and Investment Value
I. MAPO Price History Review and Current Market Status
II. Core Factors Affecting MAPO's Future Price
III. 2025-2030 MAPO Price Forecast
IV. MAPO Professional Investment Strategy and Risk Management
V. MAPO Potential Risks and Challenges
VI. Conclusion and Action Recommendations
FAQ
How to Buy Cryptocurrency


Trending Cryptocurrencies


2025 ZYRA Price Prediction: Analyzing Market Trends and Growth Potential for the Emerging Cryptocurrency

2025 B2 Price Prediction: Expert Analysis and Market Forecast for the Coming Year
Nick Szabo: The Man Behind Smart Contracts

2025 ZKPrice Prediction: Analyzing Market Trends and Growth Potential for Zero-Knowledge Protocols

Can Bitcoin Wallet be Traced Back to Me?
When Are Bitcoin Fees Lowest? Best Times to Send BTC

Discover the Top 5 Fastest Growing Cryptocurrencies of 2024
What is TEXITcoin (TXC) market overview: price, trading volume, and market cap rankings?

How to Acquire TRAIMP Tokens on Solana Efficiently

How to Purchase Tokens Prior to Exchange Listings

What is the CMC20 index market overview: $6.46M market cap and $2.57M trading volume in 2025