2025 ONT Price Prediction: Expert Analysis and Market Forecast for Ontology Token in the Coming Year

Introduction: ONT's Market Position and Investment Value
Ontology (ONT) is a new-generation public infrastructure blockchain project and distributed trust cooperation platform that has provided complete distributed ledger and intelligent contract system support since its inception in 2018. As of 2025, ONT has achieved a market capitalization of $55,850,000 with approximately 919,064,523 tokens in circulation, maintaining a price around $0.05585. This asset, recognized for its scalable lightweight universal smart contracts and cross-chain interaction protocols, is playing an increasingly critical role in distributed applications and blockchain infrastructure development.
This article will comprehensively analyze ONT's price trends from 2025 to 2030, combining historical patterns, market supply and demand dynamics, ecosystem development, and macroeconomic factors to provide investors with professional price forecasts and practical investment strategies.
I. ONT Price History Review and Market Status
ONT Historical Price Evolution
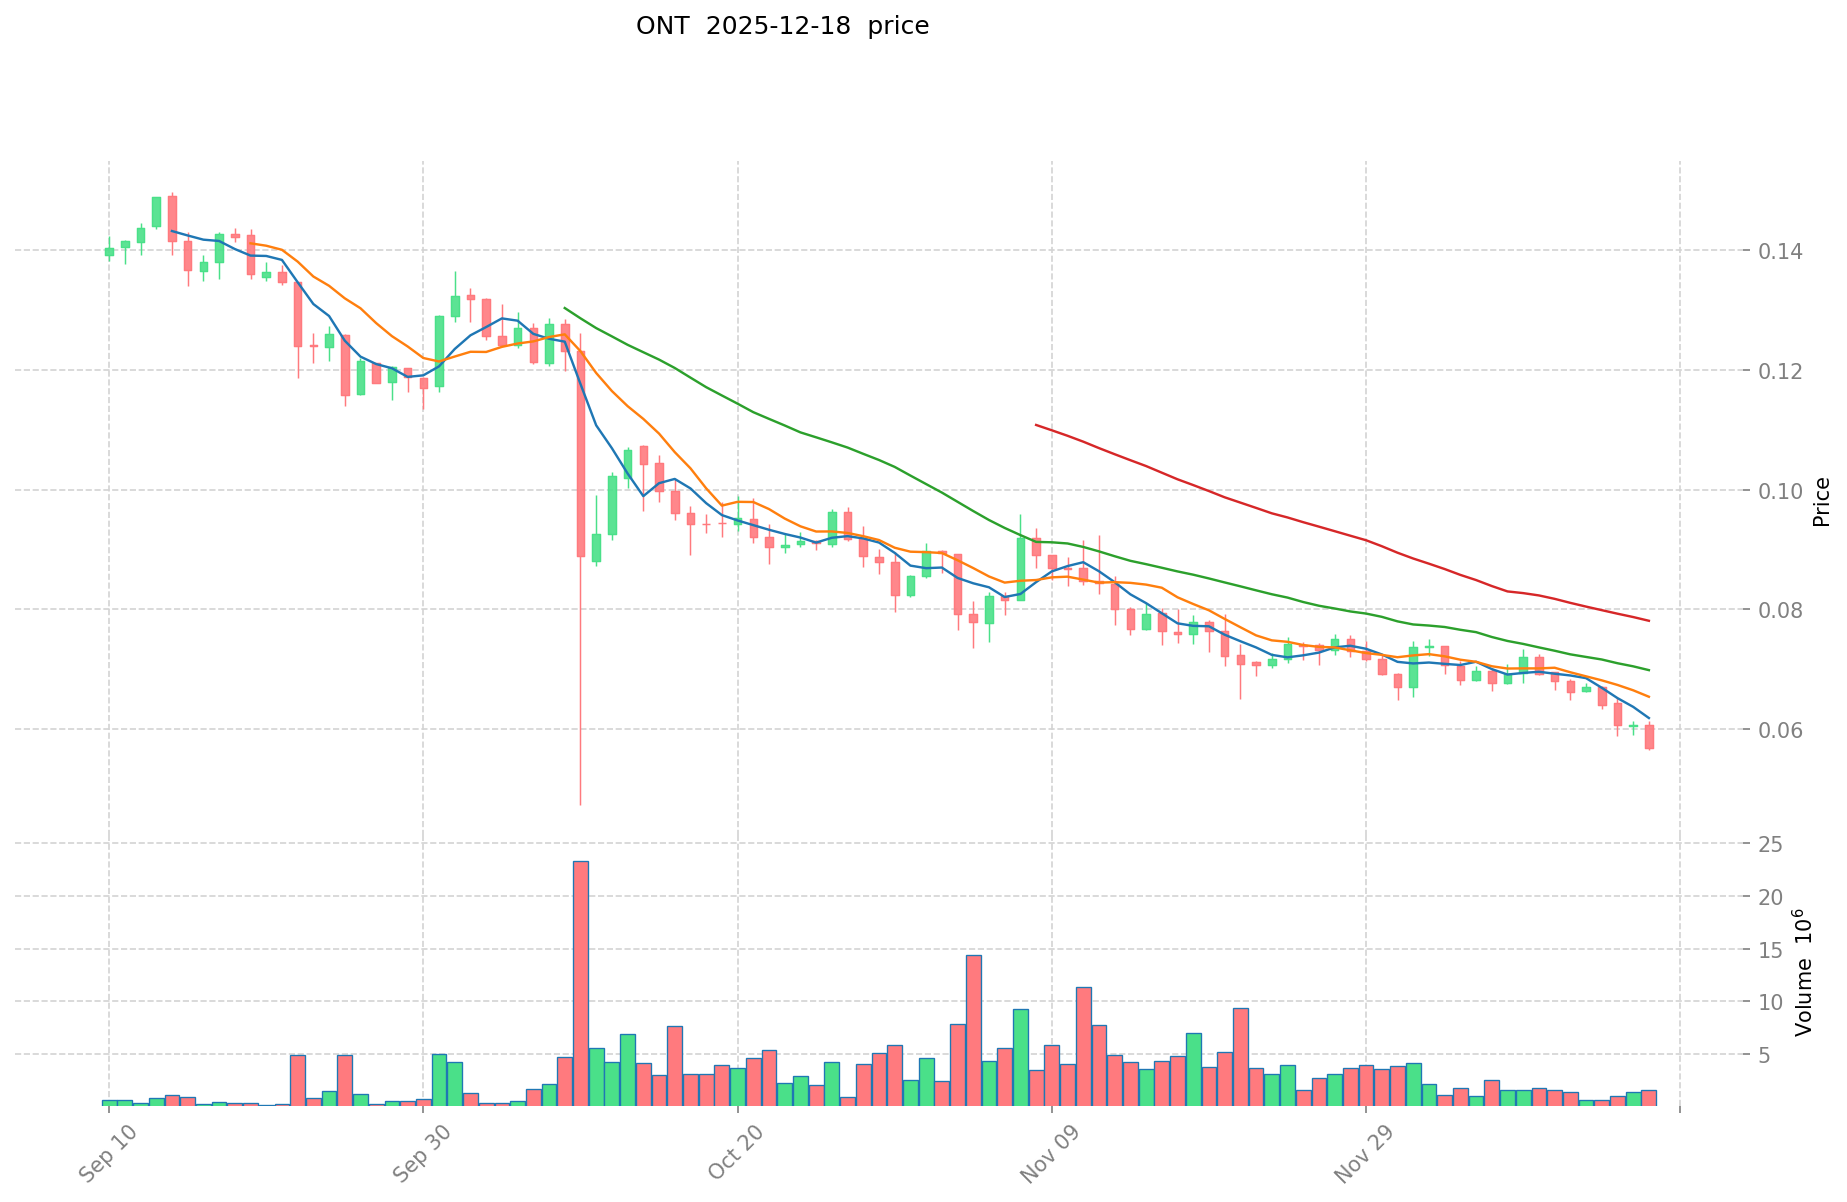
Ontology (ONT) was launched on March 25, 2018, with an initial price of $0.2. The token reached its all-time high (ATH) of $10.92 on May 3, 2018, representing an exceptional early-stage rally. However, the project has experienced significant long-term depreciation over the subsequent years. By December 18, 2025, ONT touched its all-time low (ATL) of $0.055284, marking an approximately 99.5% decline from its historical peak.
ONT Current Market Status
As of December 18, 2025, Ontology (ONT) is trading at $0.05585, exhibiting the following market characteristics:
Price Performance:
- 1-hour change: +0.70%
- 24-hour change: -6.48%
- 7-day change: -16.42%
- 30-day change: -26.44%
- 1-year change: -78.71%
Market Capitalization and Supply Metrics:
- Market cap: $51,329,753.61
- Fully diluted valuation (FDV): $55,850,000
- Circulating supply: 919,064,523 ONT
- Total supply: 1,000,000,000 ONT
- Circulating ratio: 91.91%
Trading Activity:
- 24-hour trading volume: $102,068.49
- Price range (24h): $0.05517 - $0.06073
- Market dominance: 0.0017%
- Listed on 27 exchanges globally
Market Sentiment: The market emotion indicator shows extreme fear conditions, reflecting broader cryptocurrency market volatility and investor caution toward the asset.
Click to view current ONT market price
ONT Market Sentiment Indicator
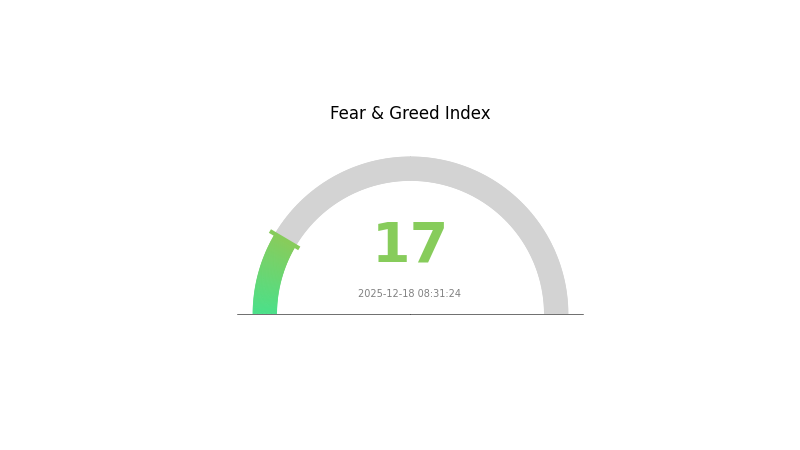
2025-12-18 Fear and Greed Index: 17 (Extreme Fear)
Click to view current Fear & Greed Index
The Fear and Greed Index has dropped to 17, indicating extreme fear in the market. This represents a significant shift in investor sentiment, driven by recent market volatility and declining asset prices. During periods of extreme fear, historically savvy investors often identify accumulation opportunities as prices reach lower levels. However, extreme caution is still warranted, as market conditions remain unstable. Traders should monitor key support levels closely and avoid over-leveraging positions. Consider dollar-cost averaging strategies to mitigate timing risks in this high-uncertainty environment.
ONT Holdings Distribution
The address holdings distribution represents the concentration of ONT tokens across different wallet addresses on the blockchain, serving as a key indicator of token decentralization and potential market manipulation risks. By analyzing the top holders and their respective stakes, market participants can assess the degree of ownership concentration and evaluate the structural stability of the network.
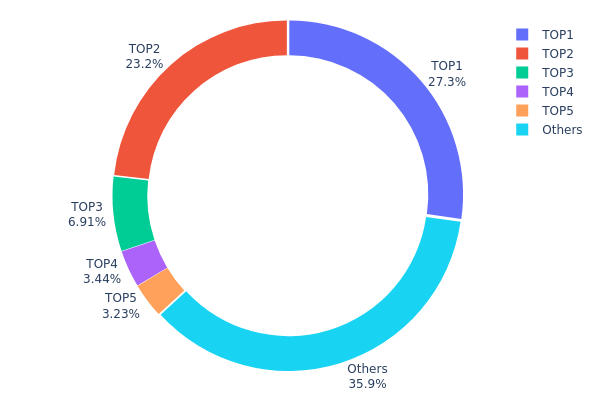
ONT demonstrates moderate concentration characteristics in its current holdings structure. The top two addresses collectively control 49.35% of the total token supply, with the largest holder commanding 26.64% and the second-largest maintaining 22.71%. This dual-concentration pattern suggests a relatively centralized distribution at the upper tier. However, the remaining top five addresses show a more distributed pattern, with holdings declining from 6.75% to 3.16%, indicating some degree of diversification beyond the top two positions. Notably, addresses ranked outside the top five collectively represent 37.38% of total holdings, which demonstrates that a substantial portion of ONT tokens remains distributed among numerous smaller stakeholders.
The current distribution pattern presents a mixed market structure. While the concentration among the top two addresses raises considerations regarding potential coordinated price movements and market influence, the significant proportion held by dispersed addresses outside the top five provides some counterbalance to centralized control. This structure reflects a transition state where ONT maintains sufficient decentralization to limit extreme volatility from single-actor manipulation, yet concentrated enough among institutional or strategic holders to facilitate significant price influence. The 37.38% distribution among dispersed holders suggests reasonable on-chain liquidity resilience, though the aggregate 49.35% stake of the top two addresses warrants continued monitoring for market structure stability.
Click to view current ONT Holdings Distribution
| Top | Address | Holding Qty | Holding (%) |
|---|---|---|---|
| 1 | ATyCXo...ahnifX | 266403.20K | 26.64% |
| 2 | AFmseV...EH9ugK | 227117.61K | 22.71% |
| 3 | AWd99o...KRxmc9 | 67506.79K | 6.75% |
| 4 | Af3Etn...LgqsTZ | 33589.96K | 3.36% |
| 5 | AGp3rJ...jcsuhB | 31578.00K | 3.16% |
| - | Others | 350729.27K | 37.38% |
II. Core Factors Influencing ONT's Future Price
Supply Mechanism
- Fixed Total Supply: ONT has a fixed total supply of 1 billion tokens, providing inherent scarcity characteristics that support long-term price stability and potential appreciation.
- Current Impact: This limited supply mechanism ensures that as demand grows through ecosystem expansion and technology adoption, supply constraints naturally support price dynamics.
Technology Development and Ecosystem Building
- Technology Upgrades and Enhancement: Successful technology upgrades and ecosystem system development over the next 6-18 months are expected to drive ONT price appreciation through improved network functionality and user adoption.
- Ecosystem Applications: The expansion of the ecosystem and integration with decentralized applications create the foundation for increased network utility and token demand.
Macroeconomic Environment
- Overall Market Sentiment: ONT's price movements are highly correlated with broader cryptocurrency market trends, particularly Bitcoin (BTC) performance. The digital asset market exhibits significant interconnectedness where macroeconomic conditions affecting Bitcoin typically cascade to altcoins like ONT.
- Market Liquidity and Depth: Investor attention should focus on market liquidity conditions and trading depth, as these factors significantly impact price volatility and movement capability.
III. 2025-2030 ONT Price Forecast
2025 Outlook
- Conservative Forecast: $0.03963 - $0.05861
- Base Case Forecast: $0.05582
- Bull Case Forecast: $0.05861 (pending positive network adoption metrics)
2026-2028 Mid-Term Outlook
- Market Phase Expectation: Gradual recovery and accumulation phase with incremental ecosystem development
- Price Range Forecast:
- 2026: $0.03662 - $0.07324 (2% upside)
- 2027: $0.05283 - $0.0861 (16% upside)
- 2028: $0.05675 - $0.11122 (35% upside)
- Key Catalysts: Enhanced smart contract functionality, enterprise partnerships, improved DeFi integration, and increased dApp ecosystem maturity
2029-2030 Long-Term Outlook
- Base Case Scenario: $0.07849 - $0.10559 (67% upside by 2029), extending to $0.07961 - $0.12738 (78% upside by 2030) assuming sustained network growth and institutional adoption
- Bull Case Scenario: $0.11122+ (2028 peak levels) maintained or exceeded through 2029-2030, contingent on breakthrough scalability solutions and major enterprise integrations
- Transformation Scenario: $0.12738+ (potential accumulation through 2030), predicated on ONT establishing itself as a leading enterprise-grade blockchain platform with significant cross-chain interoperability success
Note: Price forecasts should be monitored through Gate.com and other authorized trading platforms. All projections carry inherent uncertainty and should not constitute investment advice.
| 年份 | 预测最高价 | 预测平均价格 | 预测最低价 | 涨跌幅 |
|---|---|---|---|---|
| 2025 | 0.05861 | 0.05582 | 0.03963 | 0 |
| 2026 | 0.07324 | 0.05722 | 0.03662 | 2 |
| 2027 | 0.0861 | 0.06523 | 0.05283 | 16 |
| 2028 | 0.11122 | 0.07566 | 0.05675 | 35 |
| 2029 | 0.10559 | 0.09344 | 0.07849 | 67 |
| 2030 | 0.12738 | 0.09952 | 0.07961 | 78 |
Ontology (ONT) Professional Investment Strategy and Risk Management Report
IV. ONT Professional Investment Strategy and Risk Management
ONT Investment Methodology
(1) Long-term Holding Strategy
- Suitable For: Long-term believers in distributed ledger infrastructure and blockchain interoperability solutions
- Operational Recommendations:
- Accumulate ONT during market downturns to build a core position, focusing on the project's technical innovation in cross-chain protocols and distributed identity frameworks
- Participate in staking opportunities to generate additional yield while maintaining exposure to the platform's governance
- Rebalance portfolio allocation annually to maintain target weight as market conditions evolve
(2) Active Trading Strategy
- Technical Analysis Tools:
- Moving Averages (MA 20/50/200): Use crossovers to identify trend reversals and support/resistance levels for entry and exit timing
- Relative Strength Index (RSI): Monitor overbought/oversold conditions, with RSI above 70 indicating potential pullback zones and below 30 indicating accumulation opportunities
- Wave Operation Key Points:
- Identify support levels near $0.055-0.056 range where ONT has historically consolidated
- Execute partial profit-taking at resistance zones around $0.062-0.065 to lock in gains during upward movements
ONT Risk Management Framework
(1) Asset Allocation Principles
- Conservative Investors: 1-3% of crypto portfolio allocation
- Active Investors: 3-7% of crypto portfolio allocation
- Professional Investors: 7-15% of crypto portfolio allocation
(2) Risk Hedging Solutions
- Position Sizing: Limit single trade exposure to 2-5% of total portfolio to mitigate downside risk from market volatility
- Dollar-Cost Averaging (DCA): Execute purchases at regular intervals rather than lump-sum investments to reduce timing risk
(3) Secure Storage Solutions
- Hot Wallet Option: Gate Web3 Wallet for active trading with frequent transactions and immediate liquidity access
- Cold Storage Approach: Transfer long-term holdings to self-custody solutions for enhanced security against exchange risks
- Security Precautions: Enable two-factor authentication, maintain offline backups of private keys, verify all transaction addresses before confirmation, and never share recovery phrases with third parties
V. ONT Potential Risks and Challenges
ONT Market Risks
- Extreme Price Volatility: ONT has experienced significant drawdowns, including a 78.71% decline over the past year, reflecting the speculative nature of blockchain infrastructure tokens and sensitivity to market sentiment
- Low Trading Liquidity: With a 24-hour volume of approximately $102,068, ONT exhibits limited liquidity relative to its market capitalization, potentially resulting in slippage during large trades
- Market Saturation: The competitive landscape of public blockchain platforms and Layer 1 solutions presents challenges for user adoption and network effects
ONT Regulatory Risks
- Evolving Regulatory Environment: Cryptocurrency regulations continue to develop globally, with potential restrictions on token trading, staking, or smart contract functionality
- Compliance Uncertainty: Regulatory classification of ONT as a security or commodity remains subject to jurisdiction-specific interpretations
- Cross-border Restrictions: Different regions may impose varying restrictions on crypto asset trading and possession
ONT Technical Risks
- Network Security: As with all blockchain systems, potential vulnerabilities in the consensus mechanism or smart contract framework could expose the network to attacks
- Developer Adoption: The success of the Ontology ecosystem depends on continued developer engagement and third-party application development
- Scalability Challenges: Meeting growing transaction demand while maintaining security and decentralization remains an ongoing technical requirement
VI. Conclusions and Action Recommendations
ONT Investment Value Assessment
Ontology presents a technically sophisticated infrastructure platform with emphasis on distributed identity, cross-chain interoperability, and customizable public chain deployment. However, the project faces significant headwinds including severe year-over-year price depreciation (-78.71%), low trading liquidity, and intense competition within the Layer 1 blockchain ecosystem. The current market capitalization of approximately $55.85 million reflects substantial investor skepticism regarding near-term growth prospects. Long-term value depends critically on successful ecosystem adoption and differentiation of its technical features.
ONT Investment Recommendations
✅ Beginners: Start with minimal allocation (0.5-1% of crypto holdings) through Gate.com's user-friendly interface, focusing on understanding the project fundamentals before increasing exposure
✅ Experienced Investors: Consider tactical accumulation at support levels below $0.056 combined with technical analysis, maintaining strict position sizing discipline and defined profit-taking targets
✅ Institutional Investors: Conduct thorough due diligence on developer activity, ecosystem partnerships, and regulatory compliance before considering material allocation; implement structured dollar-cost averaging over extended periods
ONT Trading Participation Methods
- Spot Trading on Gate.com: Purchase and hold ONT directly for medium to long-term positions with immediate settlement
- Gate.com Trading Platform: Execute active trading strategies with real-time price discovery and professional charting tools
- Staking Programs: Participate in network validation to generate yield while maintaining network security alignment
Cryptocurrency investments carry extreme risk. This report does not constitute investment advice. Investors should make decisions based on individual risk tolerance and consult professional financial advisors. Never invest capital you cannot afford to lose.
FAQ
Is ont a good investment?
ONT shows potential with growing ecosystem developments and strategic partnerships. However, conduct thorough research and assess your risk tolerance before investing. Market volatility remains significant, so consider your investment horizon carefully.
Can toncoin reach $50?
Yes, Toncoin is projected to reach $50 by 2025 based on current market trends and strong development prospects. The network's growth and adoption momentum support this price target.
What is the ont coin?
Ontology coin (ONT) is a utility token on the Ontology blockchain, used for governance and staking, facilitating decentralized data and identity management solutions.
What will Ton be worth in 2025?
Based on current forecasts, Toncoin (TON) is predicted to reach approximately $1.49 by 2026, with long-term projections suggesting potential growth to $1.80 by 2029. However, crypto markets remain volatile and unpredictable.
Share
Content
Introduction: ONT's Market Position and Investment Value
I. ONT Price History Review and Market Status
II. Core Factors Influencing ONT's Future Price
2025 Outlook
2026-2028 Mid-Term Outlook
2029-2030 Long-Term Outlook
IV. ONT Professional Investment Strategy and Risk Management
V. ONT Potential Risks and Challenges
VI. Conclusions and Action Recommendations
FAQ
How to Buy Cryptocurrency


Trending Cryptocurrencies


2025 LUNC Price Prediction: Analyzing Terra Luna Classic's Potential Recovery and Market Outlook in the Post-Crash Era

2025 HBAR Price Prediction: Will Hedera Hashgraph Reach New Heights in the Crypto Market?
2025 CFX Price Prediction: Analysis of Market Trends and Potential Growth Factors for Conflux Network

2025 SMARTPrice Prediction: Advanced AI-Driven Market Analytics for Investment Portfolio Optimization

2025 DOT Price Prediction: Will Polkadot Reach $100 Amid Growing Adoption?

2025 NANO Price Prediction: Market Analysis and Growth Potential for the Digital Currency

2025 LAVA Price Prediction: Expert Analysis and Market Forecast for the Upcoming Year
Understanding Ethereum Blobs: A Comprehensive Guide
2025 ERG Price Prediction: Expert Analysis and Market Forecast for Ergo Cryptocurrency

2025 OSMO Price Prediction: Will Osmosis Hit $5 by Year-End?

2025 ACH Price Prediction: Expert Analysis and Market Outlook for Alchemy Pay Token