2025 RION Price Prediction: Expert Analysis and Market Forecast for the Coming Year


Introduction: RION's Market Position and Investment Value
Hyperion (RION) serves as the leading decentralized trading platform on Aptos, ranking consistently within the top twelve DEXs globally by trading volume. With backing from prominent institutional investors including OKX Ventures, Aptos Labs, Mirana Ventures, and Maelstrom, RION has established itself as a cornerstone infrastructure asset in the Aptos ecosystem. As of December 24, 2025, RION's market capitalization stands at approximately $23.96 million, with a circulating supply of 17 million tokens out of a total supply of 100 million, trading at approximately $0.2396 per token. By seamlessly integrating swap aggregation, CLMM algorithmic mechanisms, and strategy vaults into a unified on-chain experience, Hyperion is building the foundational liquidity and trading layer for the Aptos network.
This article provides a comprehensive analysis of RION's price trajectory and market dynamics through 2030, examining historical price patterns, market supply and demand factors, ecosystem development, and macroeconomic conditions to deliver professional price forecasts and actionable investment strategies for institutional and individual investors seeking exposure to this emerging infrastructure asset.
Hyperion (RION) Market Analysis Report
I. RION Price History Review and Market Status
RION Current Market Performance
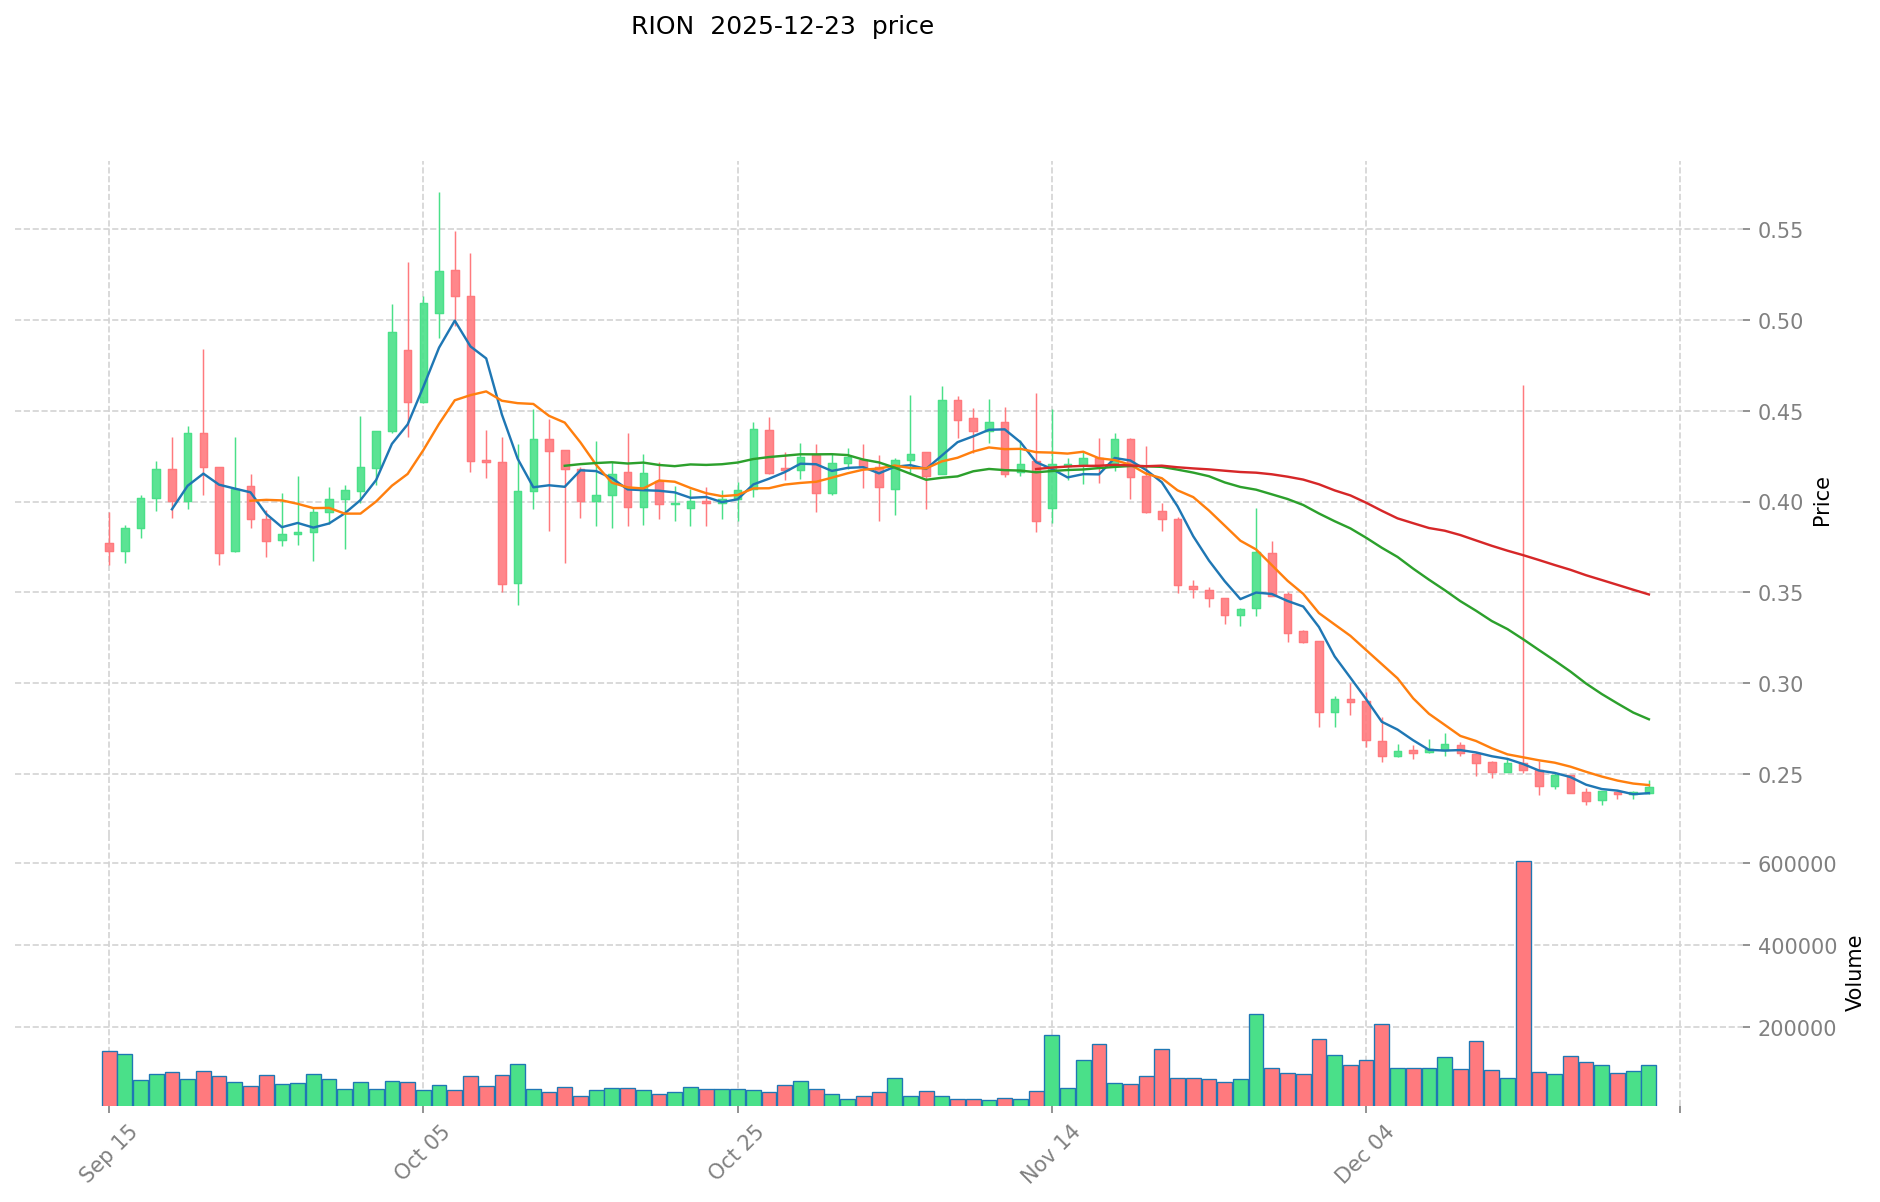
As of December 24, 2025, RION is trading at $0.2396, representing a 24-hour decline of -1.15%. The token has experienced significant volatility over the short term, with a 1-hour change of -0.10% and a 7-day decline of -3.57%. Over the past 30 days, RION has depreciated by -31.31%, indicating substantial downward pressure in the medium term. However, on an annual basis, RION has demonstrated remarkable growth of 751.39%, reflecting strong long-term appreciation from its launch period.
RION reached its all-time high of $1.1064 on July 17, 2025, before declining to its recent low of $0.2325 on December 18, 2025. Within the past 24 hours, the token has traded between a high of $0.2439 and a low of $0.238, showing relatively tight price action.
The current market capitalization stands at $4,073,200.00, with a fully diluted valuation of $23,960,000.00. RION maintains a circulating supply of 17,000,000 tokens out of a total and maximum supply of 100,000,000 tokens, representing a 17% circulation ratio. The token's market dominance is minimal at 0.00075%, reflecting its position as a smaller-cap asset within the broader cryptocurrency landscape.
Trading volume over the last 24 hours totals $22,478.39, with RION being listed across 7 exchanges. The token currently has 15,953 holders, indicating a growing but still developing user base.
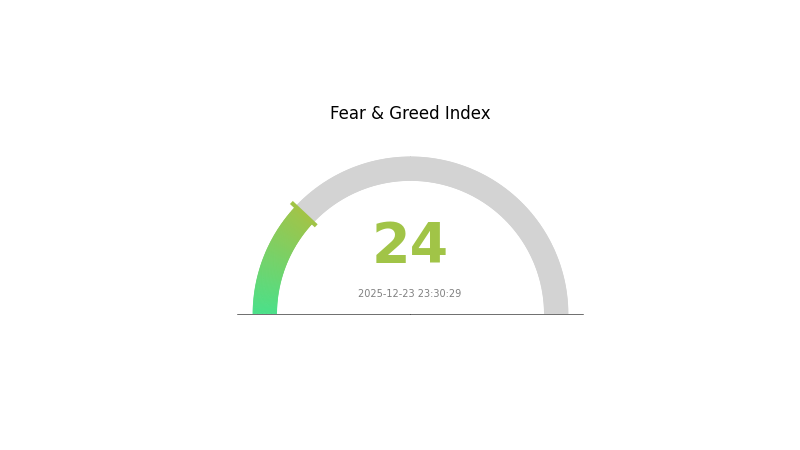
Market sentiment data from December 23, 2025 indicates "Extreme Fear" (VIX: 24), suggesting heightened risk aversion in the broader market environment that may be influencing RION's recent price performance.
Click to view current RION market price
RION Market Sentiment Indicator
2025-12-23 Fear and Greed Index: 24 (Extreme Fear)
Click to view current Fear & Greed Index
The cryptocurrency market is currently in a state of extreme fear, with the index reading at 24. This indicates widespread panic and pessimism among investors, suggesting that market sentiment has reached a critical low point. During such periods, risk-averse investors typically reduce exposure, while contrarian traders may view this as a potential buying opportunity. Extreme fear often precedes market reversals, making it important to monitor market developments closely. Investors should exercise caution and conduct thorough research before making trading decisions during such volatile market conditions.
RION Holdings Distribution
Address holdings distribution represents the concentration of token ownership across blockchain addresses, serving as a critical indicator of network decentralization and market structure stability. This metric reveals how RION tokens are distributed among major stakeholders, providing insights into potential concentration risks and market dynamics.
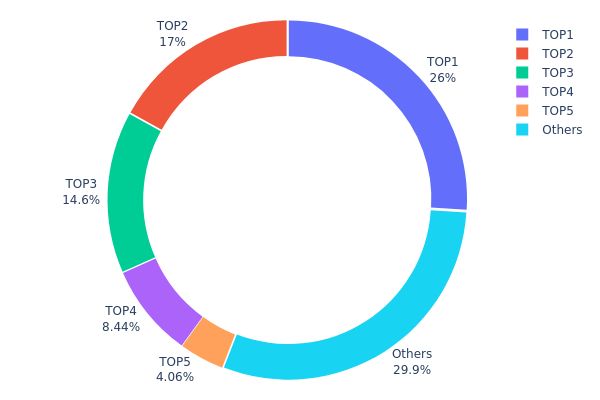
The current RION holdings data demonstrates significant concentration among top-tier addresses. The leading address controls 25.98% of total supply, while the top three addresses collectively hold 57.57% of all tokens in circulation. This concentration pattern indicates moderate to elevated centralization risk, as a relatively small number of entities control more than half of the circulating supply. The fourth and fifth largest addresses contribute an additional 12.49%, further emphasizing the dominance of the largest holders. Meanwhile, remaining addresses collectively account for 29.94% of holdings, suggesting that nearly 30% of tokens are distributed across a more dispersed holder base.
This distribution pattern carries meaningful implications for RION's market structure and price dynamics. The substantial holdings concentration among the top five addresses creates potential vulnerabilities to price volatility, as large-scale liquidation or accumulation by these major holders could significantly impact market conditions. However, the presence of a notable "Others" category representing nearly one-third of total supply indicates some degree of decentralized participation. To maintain ecosystem health and market stability, monitoring whether these concentration levels remain stable or trend toward greater decentralization will be essential for assessing RION's long-term viability and governance resilience.
Visit RION Holdings Distribution on Gate.com for real-time updates
| Top | Address | Holding Qty | Holding (%) |
|---|---|---|---|
| 1 | 0x14ac...5f5c3d | 3000.00K | 25.98% |
| 2 | 0x6d09...9100dd | 1962.12K | 16.99% |
| 3 | 0xdc85...48addb | 1685.77K | 14.60% |
| 4 | 0xca29...e83e79 | 974.28K | 8.43% |
| 5 | 0x53f7...f3fa23 | 468.85K | 4.06% |
| - | Others | 3452.79K | 29.94% |
Core Factors Influencing RION's Future Price Movement
Technology Development and Ecosystem Construction
-
Concentrated Liquidity Market Making Model (CLMM): Hyperion's key feature enables liquidity providers to concentrate capital within specific price ranges, allowing for more efficient capital utilization compared to traditional Automated Market Maker (AMM) models.
-
2025 Platform Expansion: Hyperion has planned new feature launches for 2025, indicating ongoing development and ecosystem enhancement aimed at improving user experience and market functionality.
Note: The provided sources contain limited specific information about RION token's supply mechanisms, institutional holdings, enterprise adoption, government policies, and macroeconomic factors. To receive a comprehensive analysis covering all core price-influencing factors, more detailed market data and project documentation would be required.
III. RION Price Forecast for 2025-2030
2025 Outlook
- Conservative Forecast: $0.1536 - $0.1800
- Neutral Forecast: $0.1800 - $0.2400
- Optimistic Forecast: $0.2400 - $0.2520 (requires sustained market momentum and increased adoption)
2026-2027 Medium-term Outlook
- Market Stage Expectation: Consolidation phase with gradual recovery, transitioning toward a growth cycle driven by ecosystem expansion and market maturation.
- Price Range Forecast:
- 2026: $0.1599 - $0.3665
- 2027: $0.2052 - $0.4533
- Key Catalysts: Increased institutional interest, platform upgrades, partnerships expansion, and improved market liquidity across major exchanges including Gate.com.
2028-2030 Long-term Outlook
- Base Case: $0.2431 - $0.4405 (assumes steady adoption and moderate market growth)
- Optimistic Case: $0.3691 - $0.5701 (assumes accelerated development and significant ecosystem growth)
- Transformative Case: $0.4901 - $0.6960 (assumes breakthrough innovations, mass adoption, and favorable macroeconomic conditions)
- December 24, 2030: RION projected at $0.696 (representing 104% cumulative appreciation from 2025 baseline levels)
| 年份 | 预测最高价 | 预测平均价格 | 预测最低价 | 涨跌幅 |
|---|---|---|---|---|
| 2025 | 0.252 | 0.24 | 0.1536 | 0 |
| 2026 | 0.36654 | 0.246 | 0.1599 | 2 |
| 2027 | 0.45328 | 0.30627 | 0.2052 | 27 |
| 2028 | 0.44054 | 0.37977 | 0.24306 | 58 |
| 2029 | 0.57012 | 0.41016 | 0.36914 | 71 |
| 2030 | 0.696 | 0.49014 | 0.28428 | 104 |
Hyperion (RION) Professional Investment Strategy and Risk Management Report
IV. RION Professional Investment Strategy and Risk Management
RION Investment Methodology
(1) Long-term Holding Strategy
- Suitable for: Investors with 1-3 year investment horizons who believe in Aptos ecosystem growth and Hyperion's DEX dominance positioning
- Operational Recommendations:
- Dollar-cost averaging (DCA) approach: Purchase RION regularly at predetermined intervals to reduce timing risk and smooth out volatility. Given the 30-day decline of -31.31%, periodic accumulation during downturns can optimize entry points.
- Strategic accumulation during market corrections: The current price of $0.2396 is near the all-time low of $0.2325 (reached December 18, 2025), presenting potential accumulation opportunities for long-term believers.
- Hold through ecosystem development phases: Monitor Hyperion's quarterly trading volume metrics and feature rollouts, maintaining positions through platform iterations and Aptos ecosystem expansion.
- Storage Solution: Utilize Gate.com's Web3 wallet for seamless interaction with Aptos and BSC networks where RION tokens are deployed, ensuring direct access to staking and liquidity provision opportunities.
(2) Active Trading Strategy
- Technical Analysis Tools:
- Moving Average Convergence Divergence (MACD): Apply MACD to identify momentum shifts in RION's short-term price action. With the 24-hour decline of -1.15% and intraday volatility, MACD can signal potential reversals when divergence patterns emerge.
- Relative Strength Index (RSI): Monitor RSI(14) levels to identify overbought (>70) and oversold (<30) conditions. Current price action suggests potential entry/exit opportunities based on RSI extremes.
- Bollinger Bands: Establish volatility bands around the 20-day moving average to identify price breakout opportunities and mean reversion trades.
- Wave Segment Operation Key Points:
- Trade around resistance levels: The historical high of $1.1064 (July 17, 2025) represents significant resistance. Target 50%-61.8% Fibonacci retracement levels from the all-time high for position exits.
- Manage positions around support zones: The recent low of $0.2325 and current price of $0.2396 indicate strong support. Set stop-losses 5-10% below current support levels to manage downside risk.
RION Risk Management Framework
(1) Asset Allocation Principles
- Conservative Investors: 1-3% portfolio allocation to RION. This reflects the token's market cap position (rank 1661) and volatility profile, limiting exposure while maintaining upside participation.
- Active Investors: 3-8% portfolio allocation. Allows meaningful exposure to Aptos ecosystem plays while maintaining diversification across multiple blockchain platforms and asset types.
- Professional Investors: 8-15% allocation (within specialized blockchain/DEX focused portfolios). This range accommodates tactical positions in high-conviction Aptos ecosystem plays while respecting overall portfolio concentration limits.
(2) Risk Hedging Solutions
- Diversification across DEX platforms: Allocate positions across multiple Aptos-based protocols and other blockchain DEXs to reduce single-platform concentration risk and capture varied trading opportunities.
- Stablecoin reserve positioning: Maintain 30-50% of allocated capital in stablecoins to enable opportunistic purchases during sharp drawdowns like the recent -31.31% monthly decline, improving long-term risk-adjusted returns.
(3) Security Storage Solutions
- Web3 Wallet Recommendation: Gate.com's Web3 wallet provides integrated access to both Aptos and BSC networks where RION is deployed, offering convenient asset management with direct DEX interface compatibility.
- Self-custody approach: Transfer RION from exchange wallets to personal wallets you control using private keys, eliminating counterparty risk associated with exchange custody.
- Security Precautions: Never share private keys or seed phrases; use hardware-backed security for large holdings; regularly verify contract addresses (Aptos: 0x435ad41e7b383cef98899c4e5a22c8dc88ab67b22f95e5663d6c6649298c3a9d; BSC: 0xc0c240c870606a5cb3150795e2d0dfff9f1f7456) before transactions to avoid phishing attacks.
V. RION Potential Risks and Challenges
RION Market Risks
- Liquidity concentration risk: The 24-hour trading volume of $22,478.39 remains relatively modest compared to major DEX tokens, potentially creating slippage during large trades and limiting institutional adoption. Market depth constraints could amplify price volatility during market stress.
- Competitive pressure within Aptos: While Hyperion ranks as a leading DEX by trading volume, competitive threats from other Aptos-native and cross-chain protocols could fragment liquidity and reduce RION's value capture as the ecosystem matures and alternative solutions emerge.
- Sentiment-driven volatility: The 1-year gain of +751.39% followed by a 30-day decline of -31.31% demonstrates extreme price swings. Retail-driven sentiment can create bubble-and-correction cycles, exposing investors to significant drawdown risk regardless of fundamental development progress.
RION Regulatory Risks
- DEX regulatory classification uncertainty: As decentralized finance continues to face regulatory scrutiny globally, RION's classification as a DEX governance token could face regulatory challenges if authorities determine DEX governance tokens constitute unregistered securities.
- Cross-chain compliance complexity: Operating on both Aptos and BSC networks increases regulatory exposure across multiple jurisdictions, potentially creating compliance costs or restrictions that impact token utility and economic model sustainability.
- Emerging digital asset regulations: Changes in crypto taxation, custody regulations, or token classification standards in major markets could alter investor demand for ecosystem tokens like RION and impact broader Aptos adoption rates.
RION Technology Risks
- Smart contract vulnerability exposure: While Aptos utilizes Move language for enhanced security, RION's integration of swap aggregation, CLMM mechanisms, and vault strategies creates expanded attack surface areas. Any critical vulnerabilities in these smart contracts could result in fund loss or protocol halting.
- Aptos network dependency: RION's primary value derives from Aptos ecosystem adoption. Network outages, consensus failures, or fundamental protocol issues would directly impair RION's utility and market valuation.
- Scaling and performance challenges: As Aptos network usage grows, transaction costs and confirmation times could increase, potentially reducing RION's competitive appeal versus other DEX solutions and limiting protocol revenue generation.
VI. Conclusion and Action Recommendations
RION Investment Value Assessment
Hyperion (RION) represents an ecosystem token positioned within a leading Aptos DEX, offering exposure to growing DEX adoption and Aptos network expansion. The project's strong institutional backing (OKX Ventures, Aptos Labs, Mirana Ventures, Maelstrom) and top-12 DEX ranking by trading volume validate business traction. However, current valuation near all-time lows (-31.31% in 30 days) reflects market skepticism regarding near-term growth catalysts and broader risk sentiment.
Long-term value depends critically on: (1) sustained Aptos ecosystem adoption and network activity; (2) Hyperion's ability to capture DEX market share against competitors; (3) sustainable tokenomics and fee distribution mechanisms; and (4) favorable regulatory environment for DEX governance tokens. The token exhibits high volatility and liquidity constraints typical of mid-cap ecosystem tokens, requiring careful position sizing and risk management.
RION Investment Recommendations
✅ Newcomers: Begin with small 1-3% portfolio allocations using dollar-cost averaging over 3-6 months. Use Gate.com's integrated trading interface to understand RION mechanics before scaling positions. Educate yourself on Aptos ecosystem fundamentals before committing larger capital.
✅ Experienced Investors: Consider tactical accumulation during significant drawdowns (support zones near $0.23-$0.24) with 3-5 year holding horizons. Combine RION positions with diversified Aptos ecosystem exposure. Implement technical analysis-based entries/exits using identified support/resistance levels and RSI/MACD signals.
✅ Institutional Investors: Evaluate RION as part of broader Aptos ecosystem strategic allocations. Conduct thorough due diligence on Hyperion's revenue model, tokenomics, and competitive positioning. Consider 5-10% allocations within specialized blockchain infrastructure portfolios, with appropriate hedge ratios.
RION Trading Participation Methods
- Exchange Trading: Access RION directly on Gate.com with real-time market data, advanced charting tools, and seamless wallet integration for both Aptos and BSC deployments.
- Liquidity Provision: Supply RION paired with complementary assets to Hyperion's CLMM pools, earning trading fees and liquidity incentives while participating in protocol economics.
- Strategic Vault Positioning: Engage Hyperion's vault strategies to optimize yield generation and automate position management within the Aptos DEX ecosystem.
Cryptocurrency investing carries extreme risk. This report is for informational purposes only and does not constitute investment advice. Investors must assess their own risk tolerance and conduct thorough due diligence before investing. Consult qualified financial advisors before making investment decisions. Never invest more capital than you can afford to lose completely.
FAQ
Is Ronin a good investment right now?
Ronin shows strong growth potential with increasing adoption in gaming and DeFi ecosystems. Its expanding use cases and developer activity make it attractive for long-term investors seeking blockchain exposure.
What factors influence Ronin (RION) price movements?
RION price is influenced by market sentiment, regulatory developments, technological upgrades, trading volume, and ecosystem adoption. Supply-demand dynamics and broader crypto market trends also significantly impact its price movements.
What is the price prediction for Ronin in the next 12 months?
Ronin is expected to decrease by 24.91% over the next month, reaching $0.1039 by January 21, 2026, based on current market trend analysis and technical indicators.
What are the risks and benefits of investing in Ronin?
Benefits include exposure to a growing blockchain gaming ecosystem with strong community support. Risks involve market volatility, regulatory uncertainty, and potential loss of capital. Conduct thorough research before investing.
Share
Content
Introduction: RION's Market Position and Investment Value
I. RION Price History Review and Market Status
Technology Development and Ecosystem Construction
2025 Outlook
2026-2027 Medium-term Outlook
2028-2030 Long-term Outlook
IV. RION Professional Investment Strategy and Risk Management
V. RION Potential Risks and Challenges
VI. Conclusion and Action Recommendations
FAQ
How to Buy Cryptocurrency


Trending Cryptocurrencies


2025 KAVA Price Prediction: Analyzing Market Trends, Technical Indicators, and Growth Potential in the DeFi Landscape

2025 LONPrice Prediction: Analyzing Market Trends and Potential Growth Factors for Tokenlon Network Token

2025 IDEX Price Prediction: Analyzing Market Trends and Future Growth Potential for the Decentralized Exchange Token

Is BitShares (BTS) a good investment?: Analyzing the Potential and Risks of this Decentralized Exchange Token
RADAR vs DYDX: Comparing Two Leading Decentralized Trading Platforms

Is Synthetix (SNX) a good investment?: Analyzing the potential and risks of this DeFi protocol

2025 PROPS Price Prediction: Expert Analysis and Market Forecast for the Digital Asset

2025 DEGOD Price Prediction: Expert Analysis and Market Forecast for the Coming Year

How Does LUNC Exchange Net Inflow and Holding Concentration Impact Terra Classic's Market Dynamics in 2025?
2025 INTER Price Prediction: Expert Analysis and Market Forecast for the Coming Year

2025 COOK Price Prediction: Expert Analysis and Market Forecast for the Upcoming Year