Is Reactive Network (REACT) a good investment?: A Comprehensive Analysis of Performance, Adoption, and Market Potential

Introduction: Reactive Network (REACT) Investment Position and Market Prospects
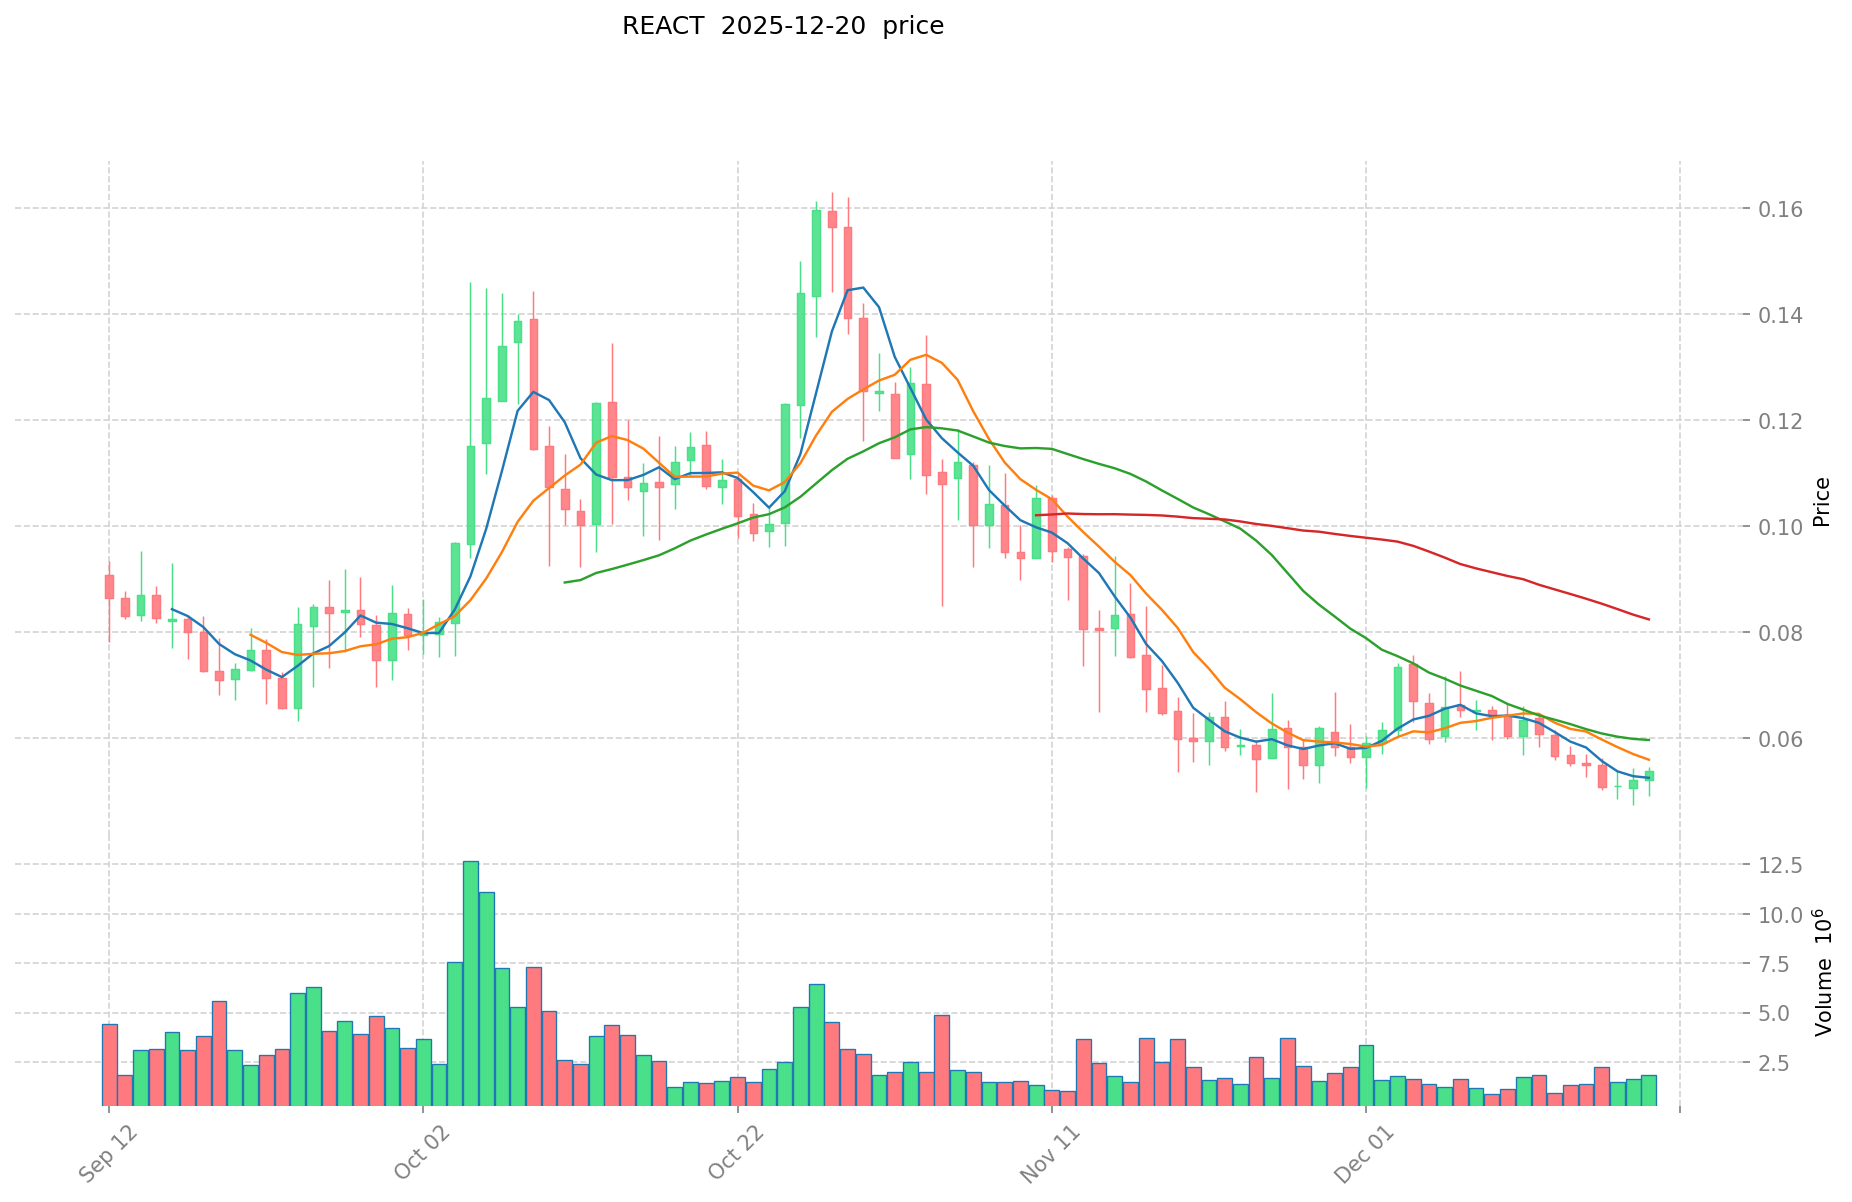
REACT is an important asset in the cryptocurrency field. As of December 21, 2025, REACT's market capitalization stands at $25,360,000, with a circulating supply of approximately 310,256,872 tokens and a current price around $0.05072. Reactive Network operates as a unique execution layer that enables developers to build and deploy revolutionary Reactive Smart Contracts capable of autonomously responding to on-chain events from any blockchain and executing user-defined logic to initiate transactions on other chains. With this innovative positioning in fully decentralized on-chain automation, REACT has gradually become a focal point when investors discuss "Is Reactive Network (REACT) a good investment?" This article provides a comprehensive analysis of REACT's investment value, historical price trends, future price predictions, and investment risks to serve as a reference for investors.
Reactive Network (REACT) Investment Analysis Report
I. Price History Review and Current Investment Status
REACT Historical Price Performance
All-Time High and Low Analysis:
- All-Time High (ATH): $0.2695 USD, achieved on March 5, 2025
- All-Time Low (ATL): $0.0172 USD, recorded on June 6, 2025
- Peak-to-Trough Decline: Approximately 93.6% depreciation from ATH to ATL
Notable Price Movements:
- From launch through March 2025: Token achieved its maximum valuation at $0.2695 USD
- March to June 2025: Significant bearish pressure resulted in token declining to $0.0172 USD
- Recovery Phase: Partial recovery observed with current price stabilizing around $0.05072 USD (as of December 21, 2025)
Current REACT Market Status (December 21, 2025)
Price Metrics:
- Current Price: $0.05072 USD
- 24-Hour Price Change: +0.64% ($0.000323 increase)
- 1-Hour Price Change: +2.09% ($0.001038 increase)
- 7-Day Price Change: -9.26%
- 30-Day Price Change: -9.44%
- 1-Year Price Change: -63.62%
Market Capitalization and Valuation:
- Market Capitalization: $15,736,228.55 USD
- Fully Diluted Valuation (FDV): $25,360,000 USD
- Market Cap to FDV Ratio: 62.05%
- Current Market Dominance: 0.00079%
Trading Activity:
- 24-Hour Trading Volume: $68,334.57 USD
- Current Price Range (24h): Low $0.04967 USD — High $0.05452 USD
- Total Holders: 6,603 addresses
- Available on 4 exchanges
Market Sentiment: Market emotion indicator: Neutral to Slightly Positive (value: 1)
For real-time REACT market pricing, visit Gate REACT Price
II. Project Overview and Technology Foundation
Project Description
Reactive Network operates as a unique execution layer enabling developers to build and deploy Reactive Smart Contracts. These smart contracts possess the distinctive capability to:
- Autonomously react to on-chain events across any blockchain network
- Execute user-defined logic based on detected on-chain triggers
- Initiate new transactions on alternative blockchains without centralized intermediaries
- Enable fully decentralized on-chain automation
This architecture supports applications across virtually all cryptocurrency development verticals, providing infrastructure for cross-chain automation and event-driven transaction execution.
Technical Specifications
- Token Standard: ERC-20 (Ethereum-based)
- Contract Address: 0x817162975186d4d53dbf5a7377dd45376e2d2fc5 (Ethereum network)
- Total Supply: 500,000,000 REACT tokens
- Max Supply: 500,000,000 REACT tokens
- Circulating Supply: 310,256,872 REACT tokens
- Circulation Ratio: 62.05%
III. Supply and Tokenomics Analysis
Token Distribution
| Metric | Value |
|---|---|
| Circulating Supply | 310,256,872 REACT |
| Total Supply | 500,000,000 REACT |
| Unlocked Supply Percentage | 62.05% |
| Remaining Locked Tokens | 189,743,128 REACT |
Observations:
- The circulation ratio of 62.05% indicates significant token vesting or allocation reserves
- Approximately 189.74 million tokens remain locked, which could create future supply pressure if released
- Current circulating supply adequately supports trading across listed exchanges
IV. Market Assessment and Exchange Listing
Exchange Coverage:
- REACT is tradable on 4 cryptocurrency exchanges
- Primary listing: Ethereum-based token infrastructure
Ranking:
- Current Market Cap Ranking: #954 among all cryptocurrencies
Accessibility:
- Official Website: https://reactive.network/
- Official Twitter: https://twitter.com/0xReactive
- Ethereum Explorer: https://etherscan.io/token/0x817162975186d4d53dbf5a7377dd45376e2d2fc5
Report Generation Date: December 21, 2025
Data Source: Gate Market Data
Note: This analysis is purely informational and does not constitute investment advice. Cryptocurrency markets are highly volatile; investors should conduct independent research and risk assessment before making trading decisions.
Reactive Network (REACT) Investment Analysis Report
Report Date: December 21, 2025
I. Executive Summary
Reactive Network (REACT) is a unique execution layer that enables developers to build and deploy Reactive Smart Contracts capable of autonomously responding to on-chain events from any blockchain and executing user-defined logic to initiate transactions on other chains. This fully decentralized on-chain automation architecture addresses cross-chain automation use cases across crypto development verticals.
As of December 21, 2025, REACT is trading at $0.05072 with a market capitalization of approximately $15.74 million (fully diluted valuation of $25.36 million), ranking #954 globally. The token demonstrates mixed investment signals with both bullish and bearish technical indicators present in current market conditions.
II. Core Factors Influencing Whether Reactive Network (REACT) is a Good Investment
Token Supply Mechanism and Scarcity
- Supply Structure: REACT operates on the ERC-20 standard with a fixed maximum supply of 500,000,000 tokens. Currently, 310,256,872 tokens are in circulation, representing 62.05% of total supply.
- Circulation Ratio Impact: The moderate circulation ratio of 62.05% suggests ongoing token release schedules that could influence price dynamics and investment positioning over time.
- Scarcity Implications: With a defined maximum supply cap, REACT incorporates supply-side constraints that may support long-term value preservation as the network develops.
Technical Architecture and Cross-Chain Innovation
- Core Technology: Reactive Network's execution layer enables autonomous on-chain event detection and cross-chain transaction execution without centralized intermediaries. This architecture addresses fundamental infrastructure gaps in decentralized on-chain automation.
- Ecosystem Application Potential: The technology supports use cases across multiple crypto verticals including DeFi protocols, automated trading, liquidation mechanisms, and cross-chain arbitrage strategies.
- Developer Adoption: The platform's focus on enabling developers to build reactive smart contracts establishes potential for organic ecosystem growth and network effect accumulation.
Market Position and Trading Liquidity
- Market Capitalization: At $15.74 million circulating market cap, REACT occupies a micro-cap position with corresponding volatility characteristics and liquidity constraints.
- 24-Hour Trading Volume: Daily volume of $68,334.57 indicates limited liquidity relative to market cap, suggesting potential slippage on larger position entries.
- Exchange Availability: REACT trades on 4 active exchanges with approximately 6,603 token holders, indicating limited but functional market infrastructure.
III. Price Performance and Technical Indicators
Historical Price Movement
- All-Time High: $0.2695 (March 5, 2025)
- All-Time Low: $0.0172 (June 6, 2025)
- Current Price: $0.05072 (December 21, 2025)
- Peak-to-Current Decline: Approximately 81.17% from historical maximum
Short-Term Price Trends
| Timeframe | Price Change |
|---|---|
| 1 Hour | +2.09% |
| 24 Hours | +0.64% |
| 7 Days | -9.26% |
| 30 Days | -9.44% |
| 1 Year | -63.62% |
Market Sentiment Analysis
Technical analysis presents conflicting signals:
- Bearish Indicators: Multiple technical quantitative indicators suggest bearish conditions for REACT through 2025.
- Bullish Support Levels: The 50-day and 200-day moving averages indicate strong support levels, suggesting potential stability for long-term holding positions.
- Market Emotion: Current market emotion index reads as 1, reflecting neutral to cautiously positive sentiment.
IV. Investment Outlook Assessment
Price Forecast Range (End of 2025)
Multiple forecasting sources project REACT price targets for end of 2025:
- Predicted Range: $0.0551 - $0.0675
- Average Forecast Range: $0.053589 - $0.0705099
Medium-Term Projection (2026)
- 2026 Price Estimate: Approximately $0.05 (based on conservative 5% annual change assumptions)
- Extended Outlook (2030): Projected price range around $0.0671300
Potential Return Scenarios
Alternative forecasting models suggest longer-term appreciation potential:
- 18-Month Scenario: Potential profit of approximately 173.84% on a hypothetical $10,000 investment through September 2026
V. Risk Factors and Considerations
Market Volatility
- REACT exhibits high volatility characteristics typical of micro-cap assets, with historical price swings exceeding 80% from peak valuations.
- Limited trading liquidity increases execution risk for position entry and exit.
Supply Dynamics
- Ongoing token release from the 37.95% of supply not yet in circulation could create selling pressure and price headwinds during market weakness.
Technology Execution Risk
- Cross-chain automation infrastructure requires robust technical implementation and continuous security audits to maintain trust and adoption.
- Competitive landscape includes other cross-chain and automation solutions that may limit market share growth.
Market Position
- Current micro-cap status with 954th global ranking indicates early-stage market adoption and higher failure risk compared to established protocols.
VI. Conclusion
Reactive Network (REACT) presents a specialized infrastructure solution for autonomous on-chain event detection and cross-chain transaction execution. The investment case rests upon technology adoption by developers and protocols seeking decentralized automation capabilities.
Current technical analysis reveals mixed signals: bearish quantitative indicators contrast with identified support levels and potential long-term appreciation scenarios. Price forecasts for end-2025 suggest modest consolidation in the $0.055-$0.070 range, while longer-term projections indicate potential returns if technology adoption accelerates.
The token carries significant risks associated with micro-cap positioning, limited liquidity, and execution dependency on developer adoption. Investors should recognize that cryptocurrency investments remain highly volatile and that this analysis does not constitute financial advice.
Data Sources: Gate, CoinCodex, Exolix, CoinCheckup, CoinLore, CoinDataFlow, DigitalCoinPrice, CoinGecko
Disclaimer: This report is for informational purposes only and does not constitute investment advice. Cryptocurrency investments carry substantial risk, including potential total loss of capital. Consult with qualified financial professionals before making investment decisions.
III. REACT Future Investment Forecast and Price Outlook (Is Reactive Network(REACT) worth investing in 2025-2030)
Short-term Investment Forecast (2025, short-term REACT investment outlook)
- Conservative forecast: US$0.0382 - US$0.0520
- Neutral forecast: US$0.0520 - US$0.0696
- Optimistic forecast: US$0.0696 - US$0.0750
Mid-term Investment Outlook (2026-2028, mid-term Reactive Network(REACT) investment forecast)
- Market phase expectation: Consolidation and gradual expansion phase with moderate recovery potential as the execution layer ecosystem matures and developer adoption increases.
- Investment return forecast:
- 2026: US$0.0473 - US$0.0667 (+19% projected increase)
- 2027: US$0.0414 - US$0.0662 (+25% projected increase)
- 2028: US$0.0448 - US$0.0746 (+27% projected increase)
- Key catalysts: Developer ecosystem growth, cross-chain smart contract adoption, strategic partnerships, and network utility expansion.
Long-term Investment Outlook (Is Reactive Network a good long-term investment?)
- Base scenario: US$0.0466 - US$0.0847 by 2030 (+67% potential return; assumes steady adoption of reactive smart contracts and moderate market expansion)
- Optimistic scenario: US$0.0850 - US$0.1076+ by 2030 (assumes accelerated enterprise adoption and breakthrough in automated cross-chain solutions)
- Risk scenario: US$0.0300 - US$0.0450 by 2030 (assumes delayed ecosystem development and increased market competition)
For detailed REACT long-term investment and price forecasts, visit: Price Forecast
2025-12-21 to 2030-12-31 Long-term Outlook
- Base scenario: US$0.0466 - US$0.0848 (corresponding to steady advancement and progressive mainstream application adoption)
- Optimistic scenario: US$0.0850 - US$0.1200 (corresponding to large-scale adoption and favorable market conditions)
- Transformative scenario: US$0.1500+ (should breakthrough innovations in reactive smart contract technology and mainstream integration occur)
- 2030-12-31 predicted high: US$0.1076 (based on optimistic development assumptions)
Disclaimer: This analysis is for informational purposes only and does not constitute investment advice. Cryptocurrency markets are highly volatile and speculative. Past performance does not guarantee future results. Investors should conduct their own research and consult with qualified financial advisors before making investment decisions. The forecasts presented are based on available data and industry analysis but carry inherent uncertainty and risk.
| 年份 | 预测最高价 | 预测平均价格 | 预测最低价 | 涨跌幅 |
|---|---|---|---|---|
| 2025 | 0.0696195 | 0.05157 | 0.0381618 | 1 |
| 2026 | 0.066654225 | 0.06059475 | 0.047263905 | 19 |
| 2027 | 0.066169467 | 0.0636244875 | 0.041355916875 | 25 |
| 2028 | 0.0746315238375 | 0.06489697725 | 0.0447789143025 | 27 |
| 2029 | 0.099762878277562 | 0.06976425054375 | 0.0613925404785 | 37 |
| 2030 | 0.107649726801533 | 0.084763564410656 | 0.04661996042586 | 67 |
Reactive Network (REACT) - Comprehensive Investment Analysis Report
I. Executive Summary
Reactive Network is a decentralized execution layer that enables developers to build and deploy Reactive Smart Contracts. These contracts autonomously respond to on-chain events from any blockchain and execute user-defined logic to initiate transactions on other chains, providing fully decentralized on-chain automation.
Key Metrics (As of December 21, 2025):
- Current Price: $0.05072
- Market Cap: $15,736,228.55
- Fully Diluted Valuation: $25,360,000
- Circulating Supply: 310,256,872 REACT
- Total Supply: 500,000,000 REACT
- 24-Hour Volume: $68,334.57
- Market Ranking: #954
II. Project Overview and Technical Foundation
Project Description
Reactive Network operates as a unique execution layer designed to address cross-chain automation challenges. The platform enables developers to:
- Build Reactive Smart Contracts that autonomously react to on-chain events from any blockchain
- Execute custom logic without intermediaries
- Initiate transactions across multiple chains in a decentralized manner
- Deploy solutions across virtually every vertical in crypto development
Token Specifications
| Parameter | Value |
|---|---|
| Token Name | Reactive Network |
| Ticker | REACT |
| Standard | ERC-20 |
| Total Supply | 500,000,000 |
| Circulating Supply | 310,256,872 (62.05%) |
| Blockchain | Ethereum |
| Contract Address | 0x817162975186d4d53dbf5a7377dd45376e2d2fc5 |
III. Market Performance and Analysis
Price Performance
| Timeframe | Change | Amount |
|---|---|---|
| 1 Hour | +2.09% | +$0.001038 |
| 24 Hours | +0.64% | +$0.000323 |
| 7 Days | -9.26% | -$0.005176 |
| 30 Days | -9.44% | -$0.005287 |
| 1 Year | -63.62% | -$0.088697 |
Price Range
- All-Time High: $0.2695 (March 5, 2025)
- All-Time Low: $0.0172 (June 6, 2025)
- 24-Hour Range: $0.04967 - $0.05452
Market Metrics
- Market Dominance: 0.00079%
- Market Cap to FDV Ratio: 62.05%
- Trading Exchanges: 4 major exchanges
- Token Holders: 6,603
IV. Investment Strategy and Risk Management
Investment Methodology
Long-Term Holding (HODL REACT):
- Suitable for investors with risk tolerance for emerging infrastructure projects
- Appropriate for those believing in cross-chain automation adoption
- Ideal timeframe: 2-5 years minimum
Active Trading:
- Relies on technical analysis and momentum trading
- Sensitive to development announcements and partnership news
- Requires monitoring of on-chain metrics and ecosystem growth
Risk Management
Asset Allocation (Recommended Percentages):
| Investor Profile | REACT Allocation |
|---|---|
| Conservative | 0-2% of portfolio |
| Aggressive | 2-5% of portfolio |
| Specialized | 5-10% of portfolio |
Risk Mitigation Strategies:
- Portfolio Diversification: Combine REACT with established cryptocurrencies and traditional assets
- Position Sizing: Allocate only capital you can afford to lose
- Hedging Tools: Consider stablecoin reserves and derivatives for downside protection
Secure Storage Recommendations:
- Hot wallets: MetaMask, Ledger Live (for active trading)
- Cold Storage: Hardware wallets (Ledger Nano S/X, Trezor) for long-term holdings
- Best Practice: Store majority of holdings offline; maintain only trading amounts in hot wallets
V. Investment Risks and Challenges
Market Risks
- High Volatility: Price has declined 63.62% over 12 months, demonstrating significant price swings
- Low Liquidity: $68,334 daily volume relative to market cap creates potential slippage concerns
- Price Concentration: Limited exchanges (4) may result in market manipulation vulnerabilities
Regulatory Risks
- Jurisdictional Uncertainty: DeFi protocols face evolving regulatory frameworks across different countries
- Policy Changes: Government restrictions on cross-chain transactions or smart contracts could impact adoption
- Compliance Issues: Platforms facilitating REACT trading may face regulatory pressures
Technical Risks
- Network Security: Potential vulnerabilities in cross-chain communication mechanisms
- Smart Contract Exploits: Reactive contracts may face unforeseen logic errors or vulnerabilities
- Protocol Upgrades: Failed or delayed upgrades could impact network functionality and token value
- Blockchain Dependencies: Reliance on Ethereum and other chains' stability and security
Project-Specific Risks
- Early-Stage Development: As an infrastructure layer, ecosystem adoption remains uncertain
- Competition: Alternative cross-chain automation solutions may emerge
- Adoption Barriers: Developer adoption dependency for network growth
VI. Conclusion: Is Reactive Network a Good Investment?
Investment Value Assessment
Long-Term Potential: Reactive Network addresses a genuine need in the crypto ecosystem—decentralized cross-chain automation. If the project successfully captures market share in this emerging category, long-term value appreciation is possible. However, current metrics show significant price decline (-63.62% YoY), indicating market skepticism or profit-taking.
Short-Term Volatility: The token has experienced dramatic price swings (ATH: $0.2695, ATL: $0.0172), making short-term prediction unreliable. Recovery from current levels depends on concrete adoption metrics and partnership announcements.
Investor Recommendations
✅ For Beginners:
- Consider dollar-cost averaging (DCA) with small allocations (0.5-1% of portfolio)
- Store holdings in secure, non-custodial wallets
- Focus on understanding the technology before investing
✅ For Experienced Investors:
- Employ swing trading strategies around technical support/resistance levels
- Monitor ecosystem metrics: developer activity, on-chain transactions, partnerships
- Maintain hedged positions with correlated assets
✅ For Institutional Investors:
- Strategic long-term allocation as infrastructure play (1-3% of venture crypto portfolio)
- Track protocol governance and team execution milestones
- Evaluate against competing cross-chain solutions
Important Disclaimer
⚠️ Risk Warning: Cryptocurrency investments carry substantial risk, including potential total loss of capital. Reactive Network remains an early-stage project with unproven market adoption. This report provides factual market data and analysis for educational purposes only and does NOT constitute investment advice. Conduct independent research, consult financial advisors, and only invest capital you can afford to lose.
Report Generated: December 21, 2025
Data Source: On-chain and market data as of December 21, 2025, 03:21:46 UTC
Reactive Network (REACT) - Frequently Asked Questions
I. FAQ
Q1: What is Reactive Network (REACT) and how does it work?
A: Reactive Network is a decentralized execution layer that enables developers to build and deploy Reactive Smart Contracts. These contracts autonomously respond to on-chain events from any blockchain and execute user-defined logic to initiate transactions on other chains without centralized intermediaries. Essentially, it provides infrastructure for fully decentralized cross-chain automation, allowing smart contracts to react to events across multiple blockchains and trigger corresponding transactions.
Q2: What is the current price and market position of REACT as of December 21, 2025?
A: As of December 21, 2025, REACT is trading at $0.05072 USD with a market capitalization of $15,736,228.55 USD and a fully diluted valuation of $25,360,000 USD. The token ranks #954 globally among all cryptocurrencies, with a circulating supply of 310,256,872 tokens (62.05% of total supply) and a 24-hour trading volume of $68,334.57 USD across 4 major exchanges.
Q3: What are the key price levels and historical performance of REACT?
A: REACT reached its all-time high of $0.2695 USD on March 5, 2025, and its all-time low of $0.0172 USD on June 6, 2025. The current price of $0.05072 represents an 81.17% decline from the peak and reflects a -63.62% change over the past 12 months. Short-term price movements show +2.09% in the past hour, +0.64% in 24 hours, and -9.26% over the past 7 days.
Q4: What are the price forecasts for REACT in 2025-2030?
A: Price forecasts vary by scenario: For end-2025, predictions range from $0.0382-$0.0750 USD depending on market conditions. By 2026, estimates project $0.0473-$0.0667 USD (±19% change). For 2030, base-case scenarios suggest $0.0466-$0.0848 USD, optimistic scenarios project $0.0850-$0.1200 USD, and transformative scenarios could reach $0.1500+ USD if breakthrough innovations occur. These forecasts carry inherent uncertainty and should not be treated as guaranteed predictions.
Q5: What are the main risks associated with investing in REACT?
A: Primary risks include market volatility (price swings exceeding 80% from peaks), low liquidity ($68,334 daily volume), regulatory uncertainty regarding DeFi protocols, technical execution risks in cross-chain infrastructure, early-stage adoption dependency, and competitive pressures from alternative cross-chain automation solutions. Additionally, REACT's micro-cap status (#954 ranking) with only 6,603 token holders increases vulnerability to price manipulation and project failure risk compared to established protocols.
Q6: What is the recommended investment allocation for REACT?
A: Allocation recommendations depend on investor profile: Conservative investors should allocate 0-2% of their portfolio, aggressive investors 2-5%, and specialized crypto investors 5-10%. For all investor types, position sizing should reflect only capital they can afford to lose. Dollar-cost averaging (DCA) with small initial allocations (0.5-1% of portfolio) is recommended for beginners, while experienced investors may employ swing trading strategies around support and resistance levels.
Q7: How should REACT tokens be securely stored?
A: For active trading, hot wallets such as MetaMask or Ledger Live are appropriate. For long-term holdings, cold storage solutions including hardware wallets (Ledger Nano S/X, Trezor) are recommended for optimal security. Best practice involves storing the majority of holdings offline while maintaining only trading amounts in hot wallets to minimize exposure to hacking risks and security vulnerabilities.
Q8: Is Reactive Network a good investment?
A: Reactive Network presents a specialized infrastructure solution addressing genuine cross-chain automation needs. Long-term investment potential exists if the project achieves significant developer adoption and market penetration. However, current metrics show substantial price decline (-63.62% YoY), indicating market skepticism or profit-taking. REACT remains an early-stage project with unproven market adoption and carries substantial risk including potential total loss of capital. This analysis is for educational purposes only and does NOT constitute investment advice. Conduct independent research, consult qualified financial advisors, and invest only capital you can afford to lose.
Disclaimer: This report is for informational purposes only and does not constitute investment advice. Cryptocurrency investments carry substantial risk. Past performance does not guarantee future results. Consult with qualified financial professionals before making investment decisions.
Share
How to Buy Cryptocurrency


Trending Cryptocurrencies


Is Polkadot (DOT) a good investment?: Analyzing the potential of this multi-chain network in the evolving crypto landscape

FST vs VET: A Comparative Analysis of Financial Service Technologies and Veterinary Educational Training Systems

Is Swarms (SWARMS) a good investment?: Analyzing the Potential and Risks of This Emerging Crypto Asset in 2023

Is FIO Protocol (FIO) a good investment?: Analyzing the potential and risks of this blockchain solution in 2023

Is Bedrock (BR) a good investment?: Analyzing the potential returns and risks of Amazon's AI service token
ALKIMI vs VET: Comparing the Revolutionary Blockchain Platforms for Digital Advertising
What is Monero (XMR) market overview: price at $440.06, market cap $7.65B, and 24H trading volume

How does Monero (XMR) correlate with macroeconomic factors compared to Bitcoin?

Eight Years with Ethereum: Insights into Top Cryptocurrencies for 2024

How to Use MACD, RSI, and Moving Averages for Crypto Technical Analysis in 2025

Comprehensive Guide to Buying MCAP in Brazil