SC vs TRX: Comparing Two Popular Cryptocurrencies in the Digital Asset Landscape

Introduction: Investment Comparison of SC vs TRX
In the cryptocurrency market, the comparison between Siacoin (SC) and TRON (TRX) has always been a topic that investors cannot avoid. The two not only have significant differences in market cap ranking, application scenarios, and price performance, but also represent different positioning in the crypto asset space.
Siacoin (SC): Since its launch in 2015, it has gained market recognition for its decentralized cloud storage platform.
TRON (TRX): Since its inception in 2017, it has been hailed as a blockchain infrastructure provider, becoming one of the cryptocurrencies with the highest global trading volume and market capitalization.
This article will comprehensively analyze the investment value comparison between SC and TRX, focusing on historical price trends, supply mechanisms, institutional adoption, technological ecosystems, and future predictions, and attempt to answer the question that investors are most concerned about:
"Which is the better buy right now?"
I. Price History Comparison and Current Market Status
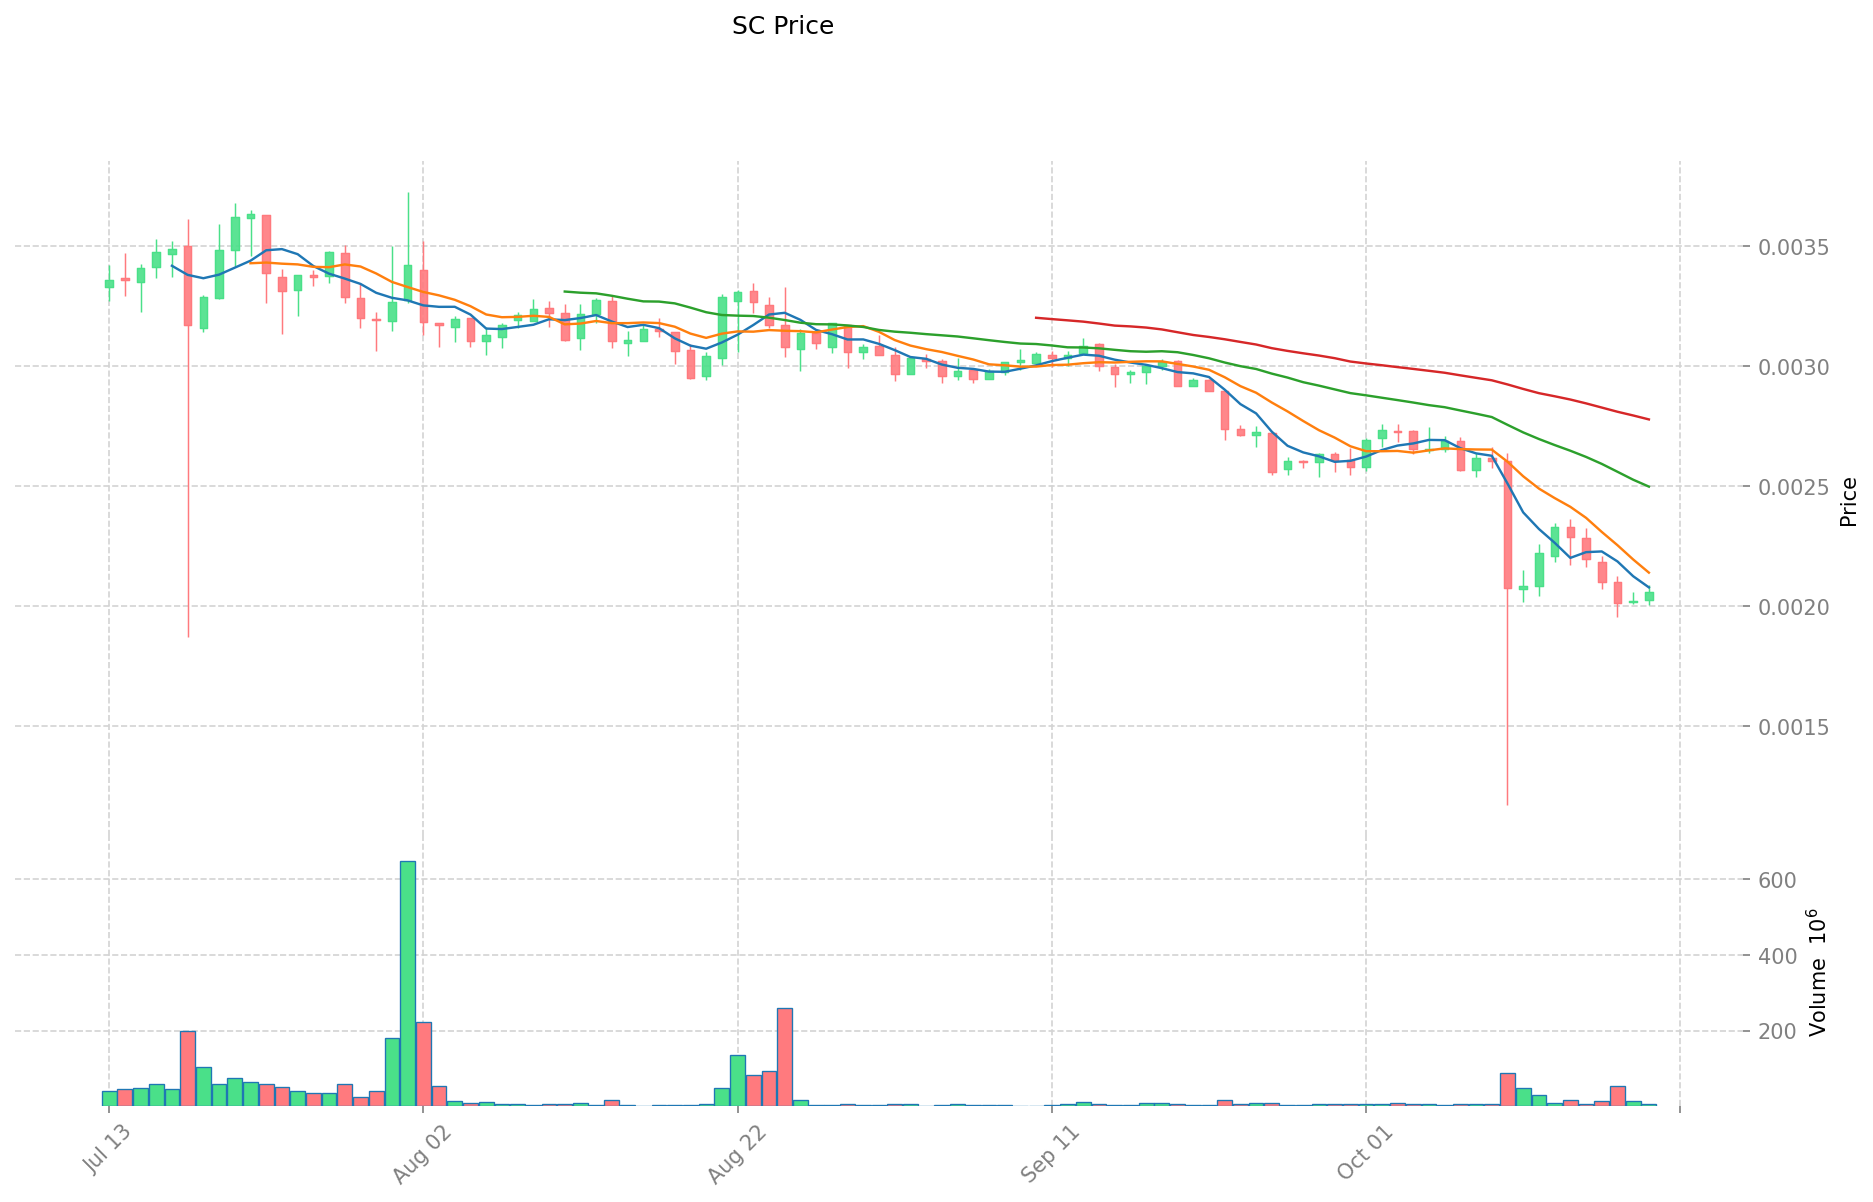
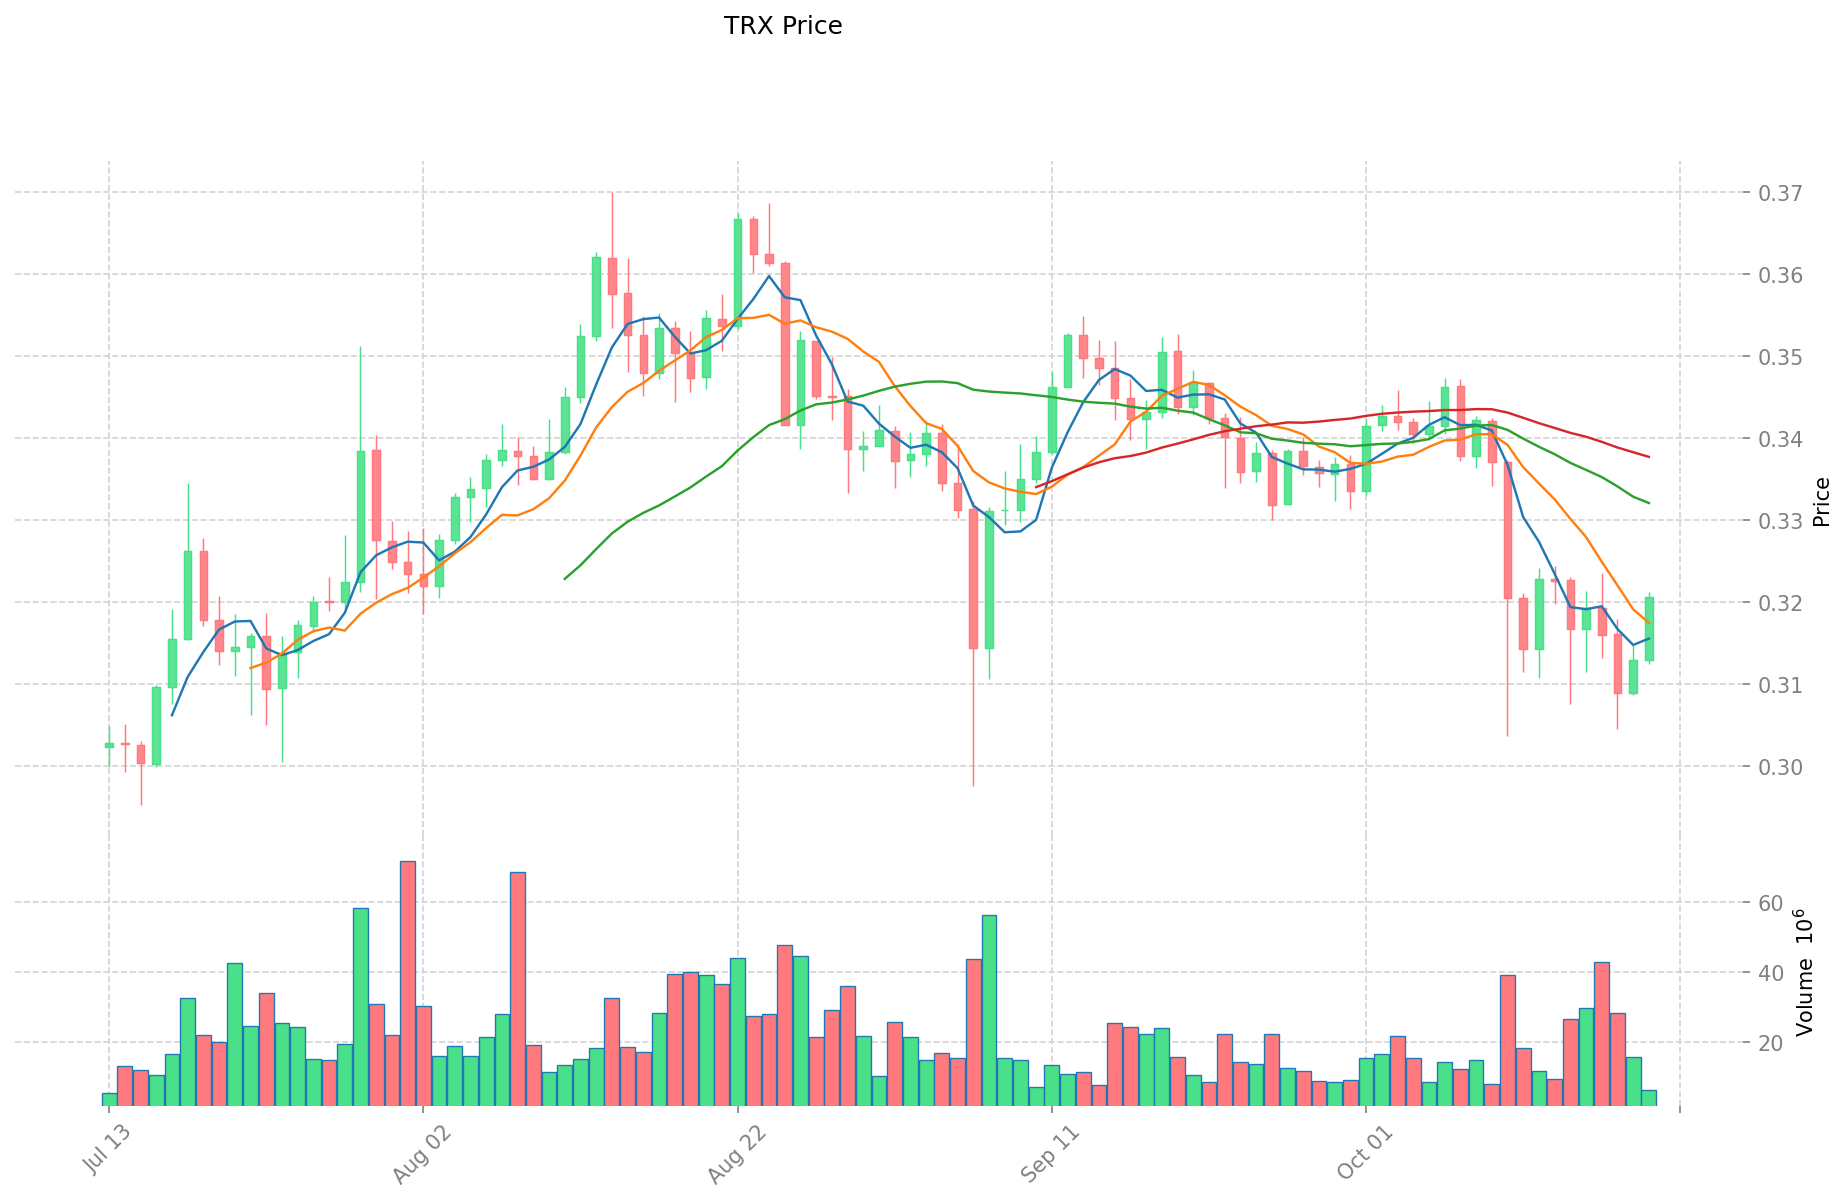
SC (Coin A) and TRX (Coin B) Historical Price Trends
- 2015: SC launched with an initial price of $0.000046.
- 2017: TRX launched with an initial price of $0.0015.
- Comparative Analysis: SC reached its all-time high of $0.092868 in January 2018, while TRX hit its all-time high of $0.431288 in December 2024.
Current Market Situation (2025-10-20)
- SC current price: $0.002048
- TRX current price: $0.32013
- 24-hour trading volume: SC $11,715.55 vs TRX $1,962,557.42
- Market Sentiment Index (Fear & Greed Index): 29 (Fear)
Click to view real-time prices:
- View SC current price Market Price
- View TRX current price Market Price
II. Project Overview and Technology Comparison
SC (Siacoin)
Siacoin is a decentralized cloud storage platform utilizing blockchain technology. It aims to provide a more secure, faster, and cost-effective cloud storage solution compared to traditional methods.
Key Features:
- Decentralized storage
- Erasure coding and encryption
- Built-in token system (Siacoin)
TRX (TRON)
TRON is a blockchain-based platform focusing on content sharing and entertainment. In May 2022, TRON launched USDD, a decentralized stablecoin.
Key Features:
- Decentralized content platform
- USDD stablecoin
- National blockchain infrastructure partnership
III. Market Performance Analysis
Market Capitalization
- SC: $114,740,503.60
- TRX: $30,304,892,983.48
Circulating Supply
- SC: 56,025,636,522.08 SC
- TRX: 94,664,333,188.03 TRX
24-hour Price Change
- SC: +0.93%
- TRX: +2.24%
IV. Future Outlook and Potential Risks
Potential Growth Factors
- SC: Increasing demand for decentralized storage solutions
- TRX: Expansion of USDD stablecoin and national blockchain partnerships
Potential Risks
- Regulatory challenges in the cryptocurrency sector
- Competition from other blockchain projects and traditional tech companies
V. Conclusion
Both SC and TRX have unique value propositions in the blockchain space. SC focuses on decentralized storage, while TRX has expanded into stablecoins and national partnerships. Investors should carefully consider the project fundamentals, market trends, and potential risks before making investment decisions.
II. Core Factors Affecting the Investment Value of SC vs TRX
Supply Mechanisms Comparison (Tokenomics)
- SC: Unlimited supply with no maximum cap, new coins are created as storage providers earn rewards
- TRX: Maximum supply cap of 100 billion TRX, deflationary mechanism through token burning
- 📌 Historical pattern: TRX's deflationary model has historically provided better price support during bear markets, while SC's unlimited supply model tends to create more sell pressure.
Institutional Adoption and Market Applications
- Institutional holdings: TRX has gained more institutional adoption, with the TRON DAO Reserve managing substantial assets
- Enterprise adoption: TRX has wider payment applications and cross-border settlement use cases through partnerships with payment processors, while SC remains primarily focused on decentralized storage
- Regulatory attitudes: Both face regulatory scrutiny, with TRX experiencing more regulatory challenges in certain jurisdictions due to its higher profile
Technical Development and Ecosystem Building
- SC technical upgrades: Focus on improving decentralized storage efficiency and reducing costs
- TRX technical development: TRON has expanded beyond its original design with various Layer 2 solutions and stablecoins like USDD
- Ecosystem comparison: TRX has a more diverse ecosystem spanning DeFi, NFTs, payments, and gaming applications, while SC remains more specialized in decentralized storage solutions
Macroeconomic and Market Cycles
- Inflation performance: TRX has shown better performance during inflationary periods due to its deflationary tokenomics
- Macro monetary policies: Both assets show correlation to broader crypto market trends following Federal Reserve decisions
- Geopolitical factors: TRX has gained adoption in regions with cross-border payment restrictions, providing potential value in certain geopolitical scenarios
III. 2025-2030 Price Prediction: SC vs TRX
Short-term Prediction (2025)
- SC: Conservative $0.0014343 - $0.002049 | Optimistic $0.002049 - $0.00227439
- TRX: Conservative $0.271932 - $0.31992 | Optimistic $0.31992 - $0.3807048
Mid-term Prediction (2027)
- SC may enter a growth phase, with an estimated price range of $0.00140510175 - $0.0029831391
- TRX may enter a steady growth phase, with an estimated price range of $0.34490007342 - $0.43379184492
- Key drivers: Institutional fund inflow, ETF, ecosystem development
Long-term Prediction (2030)
- SC: Base scenario $0.001930183389895 - $0.003574413684991 | Optimistic scenario $0.003574413684991 - $0.00407483160089
- TRX: Base scenario $0.258693444994687 - $0.410624515864584 | Optimistic scenario $0.410624515864584 - $0.595405548003646
Disclaimer: This analysis is based on historical data and market projections. Cryptocurrency markets are highly volatile and unpredictable. This information should not be considered as financial advice. Always conduct your own research before making any investment decisions.
SC:
| 年份 | 预测最高价 | 预测平均价格 | 预测最低价 | 涨跌幅 |
|---|---|---|---|---|
| 2025 | 0.00227439 | 0.002049 | 0.0014343 | 0 |
| 2026 | 0.0029831391 | 0.002161695 | 0.00140510175 | 5 |
| 2027 | 0.0027010379025 | 0.00257241705 | 0.0014662777185 | 25 |
| 2028 | 0.003717785741512 | 0.00263672747625 | 0.002030280156712 | 28 |
| 2029 | 0.003971570761101 | 0.003177256608881 | 0.002795985815815 | 55 |
| 2030 | 0.00407483160089 | 0.003574413684991 | 0.001930183389895 | 74 |
TRX:
| 年份 | 预测最高价 | 预测平均价格 | 预测最低价 | 涨跌幅 |
|---|---|---|---|---|
| 2025 | 0.3807048 | 0.31992 | 0.271932 | 0 |
| 2026 | 0.360821772 | 0.3503124 | 0.224199936 | 9 |
| 2027 | 0.43379184492 | 0.355567086 | 0.34490007342 | 11 |
| 2028 | 0.4104666440784 | 0.39467946546 | 0.335477545641 | 23 |
| 2029 | 0.418675976959968 | 0.4025730547692 | 0.209337988479984 | 25 |
| 2030 | 0.595405548003646 | 0.410624515864584 | 0.258693444994687 | 28 |
IV. Investment Strategy Comparison: SC vs TRX
Long-term vs Short-term Investment Strategy
- SC: Suitable for investors focused on decentralized storage potential
- TRX: Suitable for investors seeking ecosystem growth and stablecoin integration
Risk Management and Asset Allocation
- Conservative investors: SC: 20% vs TRX: 80%
- Aggressive investors: SC: 40% vs TRX: 60%
- Hedging tools: Stablecoin allocation, options, cross-currency portfolios
V. Potential Risk Comparison
Market Risk
- SC: Limited market adoption and high competition in cloud storage sector
- TRX: Volatility due to broader market sentiment and regulatory concerns
Technical Risk
- SC: Scalability, network stability
- TRX: Hash power concentration, security vulnerabilities
Regulatory Risk
- Global regulatory policies may have differing impacts on both assets
VI. Conclusion: Which Is the Better Buy?
📌 Investment Value Summary:
- SC advantages: Specialized in decentralized storage, potential for growth in cloud storage market
- TRX advantages: Wider ecosystem, stablecoin integration, higher institutional adoption
✅ Investment Advice:
- New investors: Consider a balanced approach with a higher allocation to TRX
- Experienced investors: Explore potential of SC while maintaining a TRX position
- Institutional investors: Focus on TRX for its broader market applications and liquidity
⚠️ Risk Warning: Cryptocurrency markets are highly volatile. This article does not constitute investment advice. None
VII. FAQ
Q1: What are the main differences between SC and TRX? A: SC focuses on decentralized cloud storage, while TRX is a broader blockchain platform for content sharing and entertainment. TRX has a larger market cap, higher trading volume, and a more diverse ecosystem including DeFi, NFTs, and stablecoins.
Q2: Which coin has performed better historically? A: TRX has generally outperformed SC in terms of price appreciation and market capitalization. TRX reached its all-time high of $0.431288 in December 2024, while SC's all-time high was $0.092868 in January 2018.
Q3: How do the supply mechanisms of SC and TRX differ? A: SC has an unlimited supply with no maximum cap, while TRX has a maximum supply cap of 100 billion tokens. TRX also employs a deflationary mechanism through token burning, which has historically provided better price support during bear markets.
Q4: Which coin has more institutional adoption? A: TRX has gained more institutional adoption, with the TRON DAO Reserve managing substantial assets. It also has wider payment applications and cross-border settlement use cases through partnerships with payment processors.
Q5: What are the potential growth factors for each coin? A: For SC, the increasing demand for decentralized storage solutions is a key growth factor. For TRX, the expansion of its USDD stablecoin and national blockchain partnerships present significant growth opportunities.
Q6: What are the main risks associated with investing in SC and TRX? A: Both face regulatory challenges in the cryptocurrency sector. SC risks include limited market adoption and high competition in the cloud storage sector. TRX risks include volatility due to broader market sentiment and potential security vulnerabilities.
Q7: Which coin is considered a better investment for 2025-2030? A: Based on current trends and predictions, TRX is generally considered to have stronger potential for 2025-2030 due to its broader ecosystem, higher institutional adoption, and more diverse applications. However, investors should conduct their own research and consider their risk tolerance before making investment decisions.
Share
Content
Introduction: Investment Comparison of SC vs TRX
I. Price History Comparison and Current Market Status
II. Project Overview and Technology Comparison
III. Market Performance Analysis
IV. Future Outlook and Potential Risks
V. Conclusion
II. Core Factors Affecting the Investment Value of SC vs TRX
III. 2025-2030 Price Prediction: SC vs TRX
IV. Investment Strategy Comparison: SC vs TRX
V. Potential Risk Comparison
VI. Conclusion: Which Is the Better Buy?
VII. FAQ
How to Buy Cryptocurrency


Trending Cryptocurrencies


LTO vs TRX: Which Blockchain Platform Offers Better Scalability and Transaction Speed?

SYND vs TRX: Comparing the Performance and Potential of Two Emerging Cryptocurrencies

SLIM vs TRX: Which Suspension Training System is Right for Your Fitness Goals?

OL vs TRX: Which Suspension Training System is Right for Your Fitness Goals?

VINE vs TRX: A Comparison of Suspension Training Systems for Home Workouts

MBG vs TRX: Comparing Two Popular Fitness Equipment Options for Home Workouts
How does TIMI token holder concentration and exchange fund flows impact trading opportunities in 2026?
What is tokenomics: token allocation, inflation mechanisms, and governance utility explained

How do crypto exchanges like Binance, gate, and Kraken compare in market share and user base in 2026
What is cryptocurrency price volatility and how does it affect Bitcoin and Ethereum correlations?

How to Use MACD, RSI, and Bollinger Bands for Crypto Trading Signals in 2026