TOMI vs DOT: A Battle for Supremacy in the Blockchain Ecosystem
Introduction: TOMI vs DOT Investment Comparison
In the cryptocurrency market, the comparison between TOMI vs DOT has always been an unavoidable topic for investors. The two not only show significant differences in market cap ranking, application scenarios, and price performance but also represent different positions in the crypto asset landscape.
TOMI (TOMI): Since its launch, it has gained market recognition for its mission to increase digital freedom and build a more democratic and decentralized internet.
Polkadot (DOT): Since its inception in 2020, it has been hailed as a multi-chain network aiming to connect various blockchains, becoming one of the most traded and highly valued cryptocurrencies globally.
This article will comprehensively analyze the investment value comparison between TOMI and DOT, focusing on historical price trends, supply mechanisms, institutional adoption, technological ecosystems, and future predictions, attempting to answer the question investors care about most:
"Which is the better buy right now?"
I. Price History Comparison and Current Market Status
TOMI and DOT Historical Price Trends
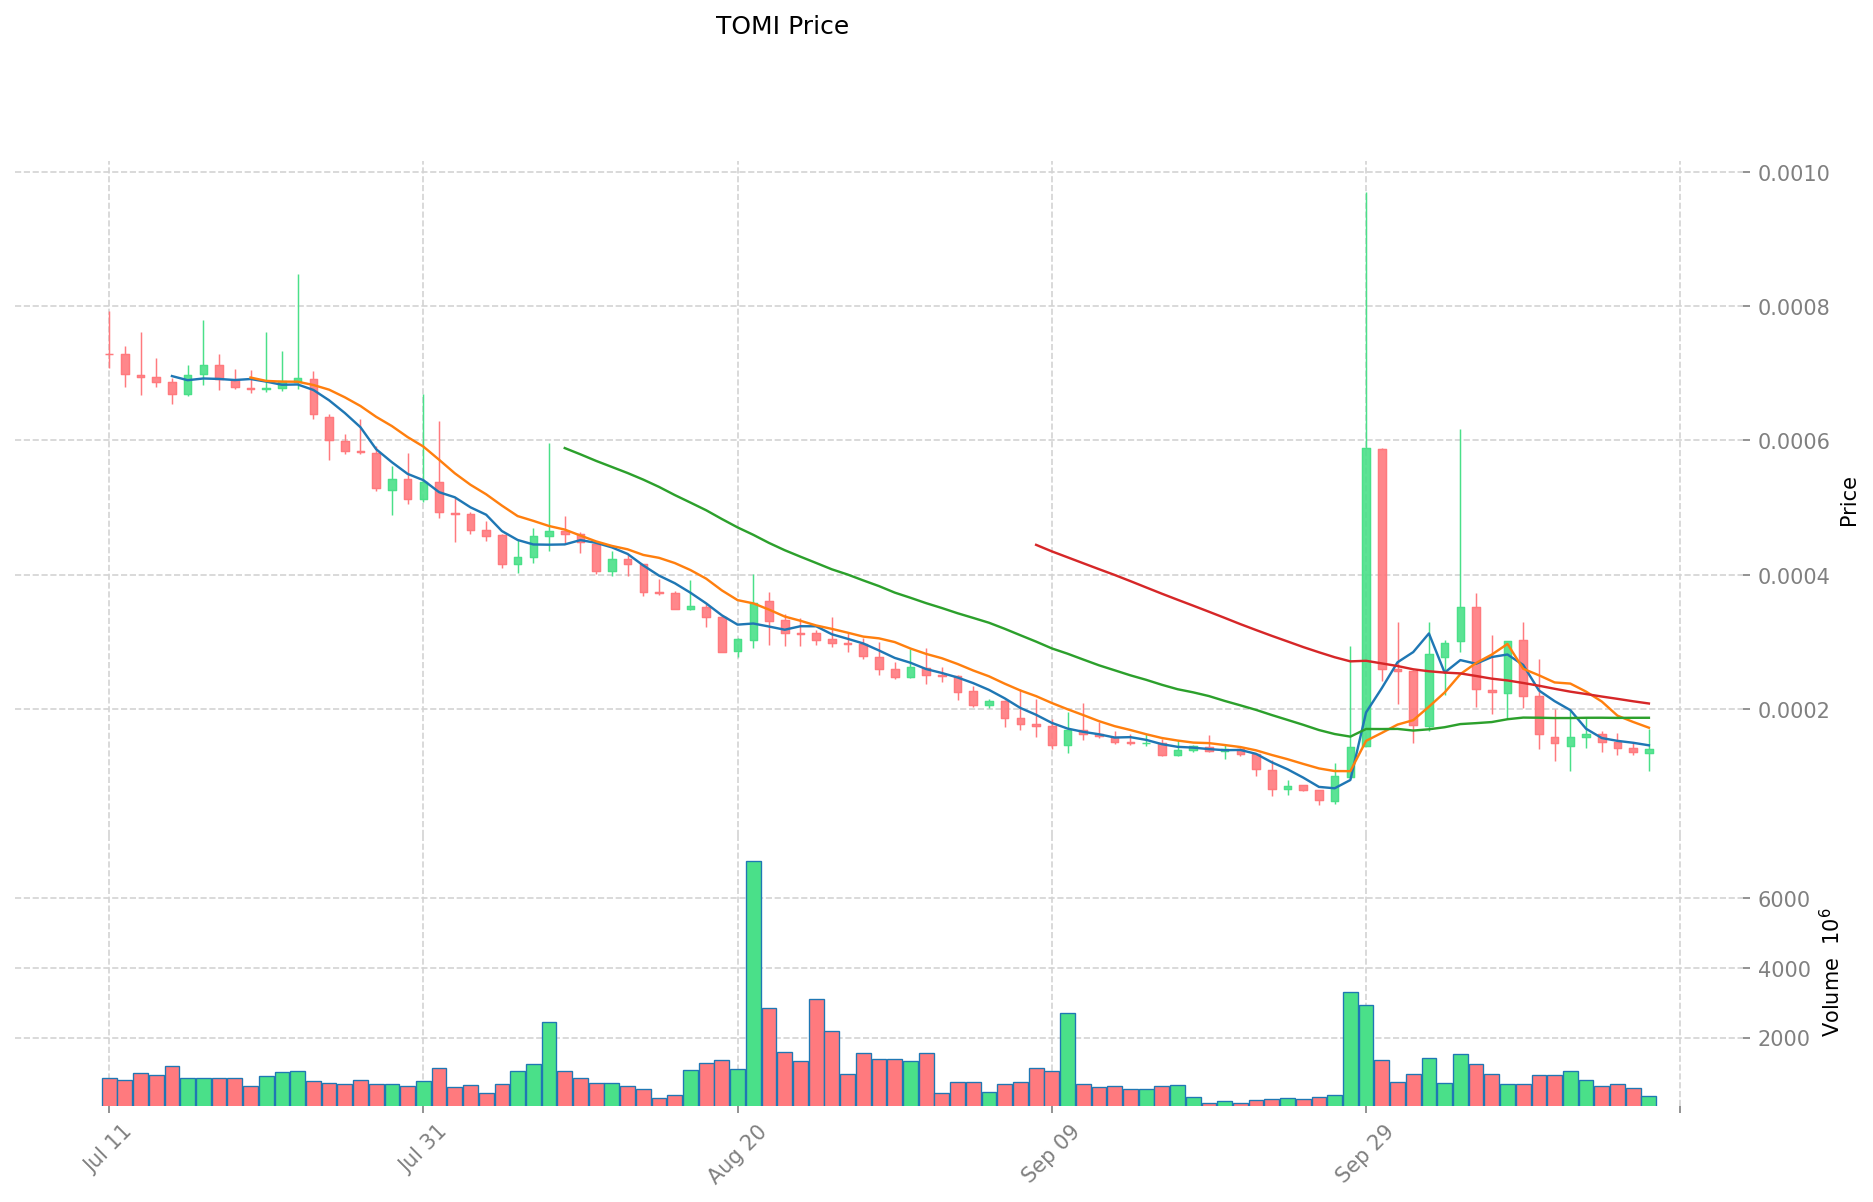
- 2023: TOMI reached its all-time high of $6.59 on June 6, 2023.
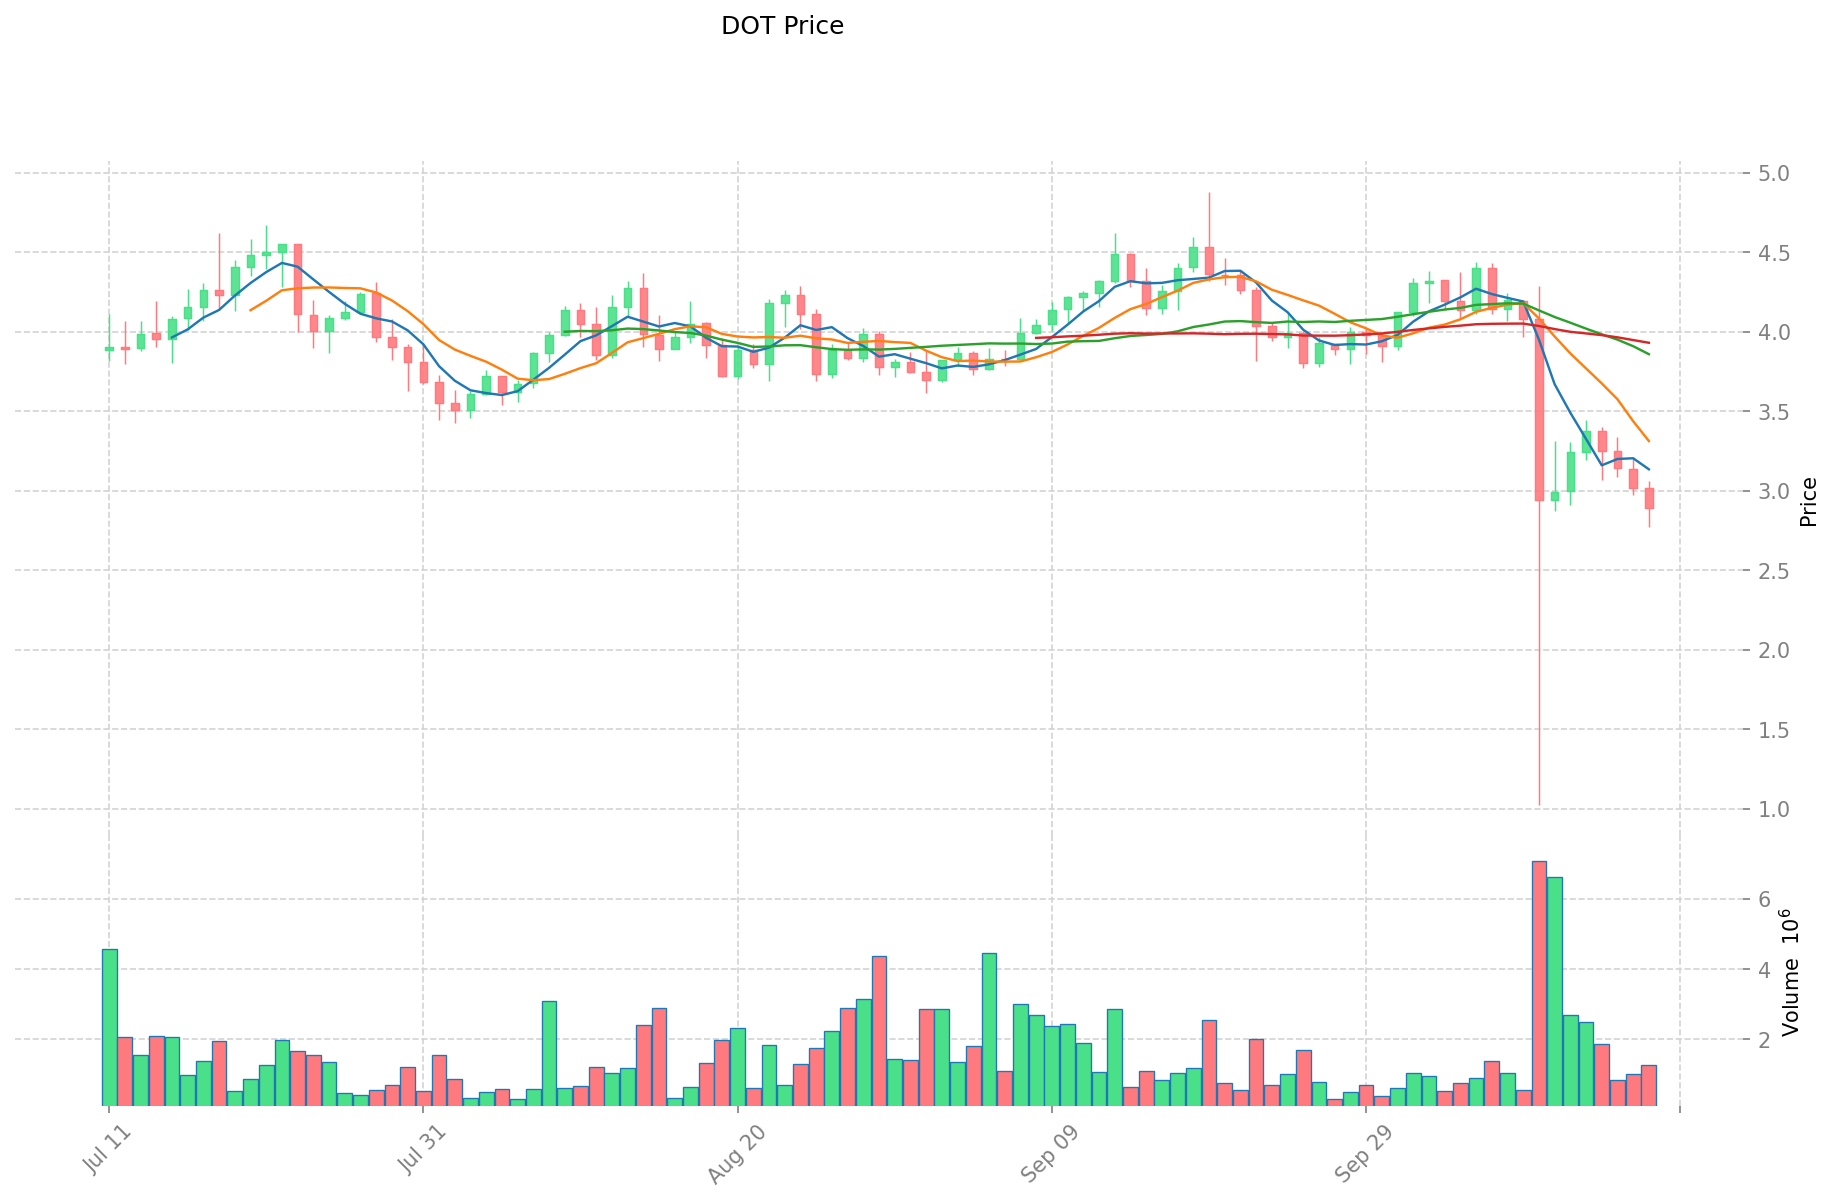
- 2021: DOT hit its all-time high of $54.98 on November 4, 2021.
- Comparative Analysis: During the market cycle, TOMI has fallen from its peak of $6.59 to a current price of $0.00013893, while DOT has declined from its high of $54.98 to $2.9.
Current Market Situation (2025-10-18)
- TOMI current price: $0.00013893
- DOT current price: $2.9
- 24-hour trading volume: TOMI $44,070.02 vs DOT $3,632,044.42
- Market Sentiment Index (Fear & Greed Index): 22 (Extreme Fear)
Click to view real-time prices:
- Check TOMI current price Market Price
- Check DOT current price Market Price
II. Key Factors Affecting TOMI vs DOT Investment Value
Supply Mechanism Comparison (Tokenomics)
- TOMI: Fixed maximum supply with a declining inflation rate, following a deflationary model. No new tokens will be minted after the initial supply is distributed.
- DOT: Inflationary model with no maximum supply cap. Annual inflation rate around 10%, with staking rewards incentivizing participation in network security.
- 📌 Historical Pattern: Deflationary or fixed supply tokens like TOMI tend to perform better in bull markets, while DOT's ongoing inflation requires strong network adoption to counter dilution effects.
Institutional Adoption and Market Applications
- Institutional Holdings: DOT has attracted more institutional interest with investments from major funds like Hypersphere Ventures and participation in Polkadot's parachain auctions.
- Enterprise Adoption: DOT offers more enterprise utility through its cross-chain interoperability infrastructure, while TOMI focuses on privacy solutions for financial applications.
- Regulatory Attitudes: Polkadot has generally received neutral-to-positive regulatory reception across jurisdictions, while privacy-focused tokens like TOMI may face additional scrutiny in certain regions.
Technical Development and Ecosystem Building
- TOMI Technical Upgrades: Implements tomiMPC protocol for secure private key sharing and theft prevention, with a focus on decentralized privacy infrastructure.
- DOT Technical Development: Advancing its parachain and cross-consensus messaging (XCM) capabilities, enabling a multi-chain ecosystem with specialized blockchains connected to the Relay Chain.
- Ecosystem Comparison: DOT has a more mature ecosystem with dozens of parachains covering DeFi, NFTs, identity, and infrastructure services. TOMI's ecosystem is more nascent, focusing on privacy applications and asset protection.
Macroeconomic Factors and Market Cycles
- Inflation Performance: DOT's utility-based value proposition may offer more resilience during economic uncertainty, while TOMI's fixed supply model could theoretically perform better as an inflation hedge.
- Monetary Policy Impact: Both assets show correlation with broader crypto market reactions to interest rate changes, with DOT potentially more sensitive to liquidity conditions due to its infrastructure focus.
- Geopolitical Factors: Increased privacy concerns and regulations may boost TOMI's value proposition, while DOT benefits from growing demand for interoperability between blockchain networks.
III. 2025-2030 Price Prediction: TOMI vs DOT
Short-term Prediction (2025)
- TOMI: Conservative $0.0001305754 - $0.00013891 | Optimistic $0.00013891 - $0.0001500228
- DOT: Conservative $1.83267 - $2.909 | Optimistic $2.909 - $3.81079
Mid-term Prediction (2027)
- TOMI may enter a growth phase, with estimated prices ranging from $0.00016956021368 to $0.00020626912592
- DOT may enter a consolidation phase, with estimated prices ranging from $2.91420492825 to $4.775082774
- Key drivers: Institutional capital inflow, ETF, ecosystem development
Long-term Prediction (2030)
- TOMI: Base scenario $0.000169253781664 - $0.000241791116664 | Optimistic scenario $0.000241791116664 - $0.000328835918663
- DOT: Base scenario $3.872149381230322 - $4.502499280500375 | Optimistic scenario $4.502499280500375 - $5.538074115015461
Disclaimer: This analysis is for informational purposes only and should not be considered as financial advice. Cryptocurrency markets are highly volatile and unpredictable. Always conduct your own research before making any investment decisions.
TOMI:
| 年份 | 预测最高价 | 预测平均价格 | 预测最低价 | 涨跌幅 |
|---|---|---|---|---|
| 2025 | 0.0001500228 | 0.00013891 | 0.0001305754 | 0 |
| 2026 | 0.000205142288 | 0.0001444664 | 0.000134353752 | 3 |
| 2027 | 0.00020626912592 | 0.000174804344 | 0.00016956021368 | 25 |
| 2028 | 0.000221022612553 | 0.00019053673496 | 0.000097173734829 | 37 |
| 2029 | 0.000277802559571 | 0.000205779673756 | 0.000144045771629 | 48 |
| 2030 | 0.000328835918663 | 0.000241791116664 | 0.000169253781664 | 74 |
DOT:
| 年份 | 预测最高价 | 预测平均价格 | 预测最低价 | 涨跌幅 |
|---|---|---|---|---|
| 2025 | 3.81079 | 2.909 | 1.83267 | 0 |
| 2026 | 3.66228555 | 3.359895 | 2.92310865 | 15 |
| 2027 | 4.775082774 | 3.511090275 | 2.91420492825 | 21 |
| 2028 | 4.433102581215 | 4.1430865245 | 2.81729883666 | 42 |
| 2029 | 4.71690400814325 | 4.2880945528575 | 3.130309023585975 | 47 |
| 2030 | 5.538074115015461 | 4.502499280500375 | 3.872149381230322 | 55 |
IV. Investment Strategy Comparison: TOMI vs DOT
Long-term vs Short-term Investment Strategies
- TOMI: Suitable for investors focused on privacy solutions and deflationary tokenomics
- DOT: Suitable for investors interested in interoperability and ecosystem development
Risk Management and Asset Allocation
- Conservative investors: TOMI: 20% vs DOT: 80%
- Aggressive investors: TOMI: 40% vs DOT: 60%
- Hedging tools: Stablecoin allocation, options, cross-currency portfolios
V. Potential Risk Comparison
Market Risk
- TOMI: Higher volatility due to lower market cap and trading volume
- DOT: Susceptible to broader crypto market trends and sentiment
Technical Risk
- TOMI: Scalability, network stability
- DOT: Parachain auction dynamics, cross-chain security
Regulatory Risk
- Global regulatory policies may have different impacts on both, with privacy-focused TOMI potentially facing more scrutiny
VI. Conclusion: Which Is the Better Buy?
📌 Investment Value Summary:
- TOMI advantages: Fixed supply, privacy focus, potential for higher growth
- DOT advantages: Established ecosystem, institutional adoption, interoperability solutions
✅ Investment Advice:
- New investors: Consider a balanced approach, leaning towards DOT for its established presence
- Experienced investors: Explore a mix of both, with TOMI as a higher-risk, higher-reward option
- Institutional investors: Focus on DOT for its ecosystem potential and regulatory clarity
⚠️ Risk Warning: The cryptocurrency market is highly volatile. This article does not constitute investment advice. None
VII. FAQ
Q1: What are the main differences between TOMI and DOT? A: TOMI is a privacy-focused token with a fixed supply and deflationary model, while DOT is an interoperability-focused token with an inflationary model and no maximum supply cap. TOMI has a smaller market cap and ecosystem, while DOT has a more established presence and institutional adoption.
Q2: Which token has performed better historically? A: DOT reached a higher all-time high of $54.98 in November 2021, compared to TOMI's all-time high of $6.59 in June 2023. However, both have experienced significant declines since their peaks.
Q3: How do the supply mechanisms of TOMI and DOT differ? A: TOMI has a fixed maximum supply with a declining inflation rate, following a deflationary model. DOT has an inflationary model with no maximum supply cap and an annual inflation rate of around 10%.
Q4: What are the key factors affecting the investment value of TOMI and DOT? A: Key factors include supply mechanisms, institutional adoption, market applications, technical development, ecosystem building, macroeconomic factors, and market cycles.
Q5: How do the long-term price predictions for TOMI and DOT compare? A: By 2030, TOMI's base scenario price range is predicted to be $0.000169253781664 - $0.000241791116664, while DOT's base scenario range is $3.872149381230322 - $4.502499280500375.
Q6: What are the main risks associated with investing in TOMI and DOT? A: Risks include market volatility, technical challenges (such as scalability for TOMI and cross-chain security for DOT), and regulatory uncertainties, particularly for privacy-focused tokens like TOMI.
Q7: How should investors approach allocating between TOMI and DOT? A: Conservative investors might consider allocating 20% to TOMI and 80% to DOT, while more aggressive investors could opt for a 40% TOMI and 60% DOT split. The exact allocation should be based on individual risk tolerance and investment goals.
Share
Content