THQ Price Deep Dive: Analyzing Trends, Support Levels, and Trading Opportunities from THQ/USDT Latest Market Data
THQ Current Price Overview
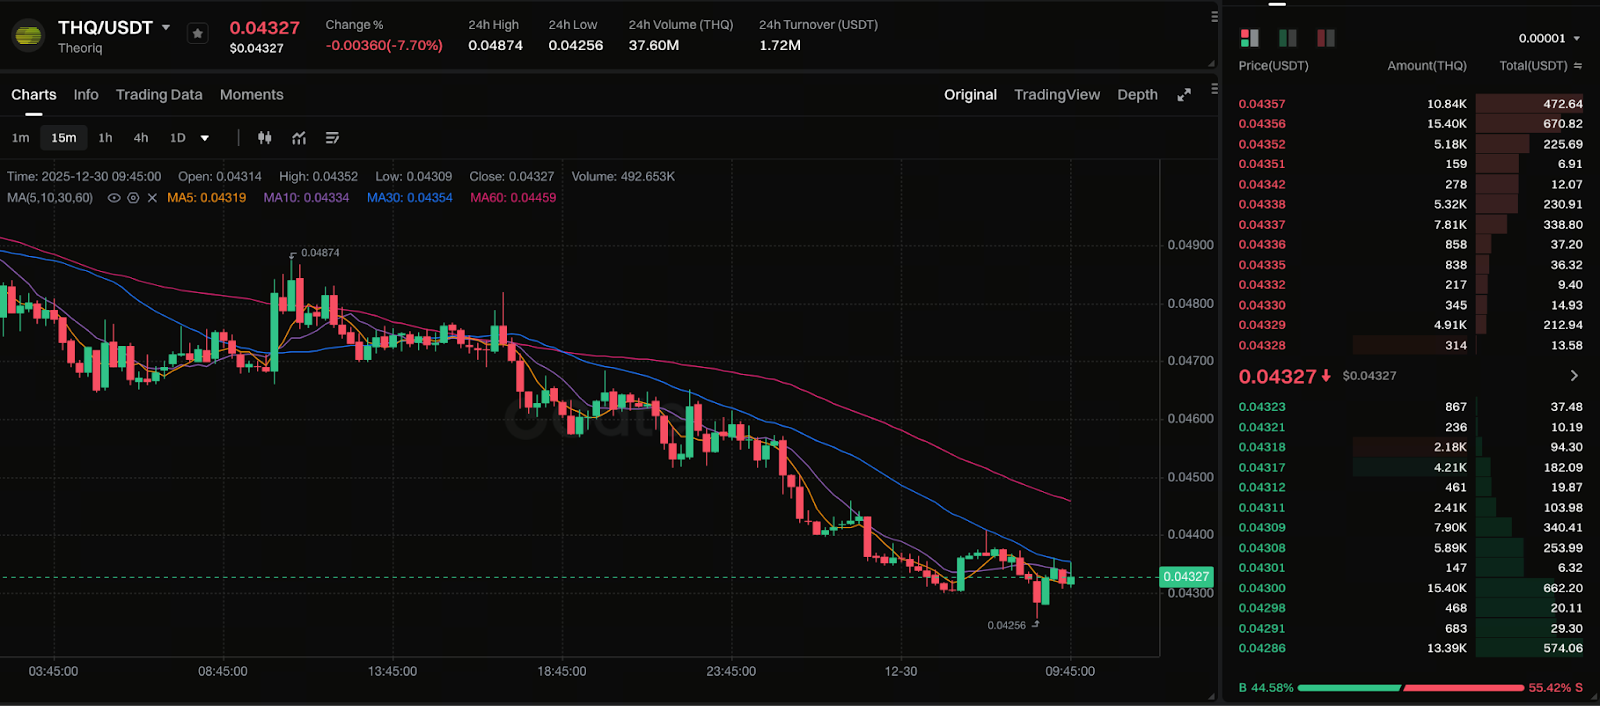
Chart: https://www.gate.com/trade/THQ_USDT
As of December 30, 2025, THQ is trading around $0.0475 USDT on the Gate exchange’s THQ/USDT pair. Over the past 24 hours, the highest price reached approximately $0.0505, while the lowest hovered near $0.0395, repeatedly testing these boundaries and reflecting substantial volatility. The marked amplitude in price swings within this period highlights a dynamic contest between buyers and sellers in the short term.
On a broader time scale, THQ’s price over the last seven days has also fluctuated widely, climbing from about $0.046 to a short-term high near $0.076 before retreating to its current level. This movement has created a broad range between recent highs and lows.
Such volatility indicates that THQ has yet to establish a clear long-term trend and is instead repeatedly confirming support and resistance across several critical price zones.
Analysis of Recent Price Volatility Structure
Examining THQ’s recent price action reveals a distinct oscillating pattern. The price has frequently tested the lower ranges, forming several short-term highs and lows. This structure generally suggests:
- The market lacks sufficient momentum for a sustained directional trend,
- There is a clear equilibrium between bullish and bearish forces in the current price zone,
- A decisive external catalyst is needed to break out of the current range.
Short-term charts show multiple failed attempts to push higher, followed by swift retreats, indicating strong resistance. Conversely, price rebounds at certain levels during pullbacks demonstrate notable support absorption. This alternating pattern is typical of a consolidation phase.
Key Support and Resistance Level Analysis
Identifying support and resistance levels is essential for anticipating future price movements. Based on recent volatility, the following zones are particularly noteworthy:
Short-term support: THQ has repeatedly bounced between $0.0395–$0.0420, indicating active short-term buying interest in this area.
Mid-term support: If short-term support fails, the next significant support lies around $0.0360–$0.0380, where previous consolidation and stabilization have occurred.
Short-term resistance: Recent upward price moves have met concentrated resistance at $0.0505–$0.0530, with multiple reversals after touching this range.
Mid-term resistance: Should the price break higher, mid-term resistance is likely to cluster around $0.0700–$0.0760, a level that saw notable pullbacks in the past week.
These support and resistance zones are critical reference points for traders as they formulate strategies and manage positions.
Trading Volume and Market Activity Trends
Trading volume serves as a vital indicator for validating price trends. Analysis of THQ’s volume shows:
- Periods of price appreciation are accompanied by a significant increase in trading volume,
- While declines or consolidations typically see volume recede somewhat from previous highs.
This pattern indicates that upward price movements are driven by capital inflows, but as prices reach resistance, market interest wanes, leading to retracements.
Divergence between price and volume often signals limited potential for trend continuation, underscoring the need for new trading momentum.
Potential Drivers of THQ Price Trends
Price action is influenced by both technical factors and a range of fundamental drivers:
- Overall market sentiment has a pronounced impact on small-cap tokens,
- Liquidity and depth of trading pairs on the exchange directly affect price volatility,
- Project developments or major announcements can shift market expectations,
- Broader macro market trends may also disrupt THQ’s short-term direction.
Combining these factors with technical analysis provides a stronger foundation for assessing price trends.
Comprehensive Technical and Sentiment Analysis
Technical indicators show THQ is still consolidating within a range and has not formed a clear trend, though short-term support remains robust. From a sentiment perspective, market attention toward THQ has fluctuated in recent periods, which may affect traders’ decisions to enter or wait on the sidelines.
Integrating technical and sentiment analysis offers a more complete understanding of THQ’s current price action and helps avoid misjudgments from relying solely on technical signals.
Key Price Zones for Investor Focus
As market structure evolves, investors should closely monitor these zones:
- If the price holds above $0.0530 with sustained volume growth, it may signal a short-term bullish reversal,
- If it breaks below $0.0395 support, short-term downside risk could intensify,
- Mid-term resistance at $0.0700–$0.0760 could trigger a new upward cycle if breached.
These price levels serve as clear reference points for traders developing strategies.
Summary: Structured, Disciplined Approach to THQ Trading
Analysis of the latest THQ/USDT market data reveals:
- THQ is currently in a consolidation phase with no clear directional trend,
- Key support and resistance levels will determine the next stage of price movement,
- Changes in trading volume and market sentiment are major drivers of price direction.
For traders, combining key price zones, volume confirmation, and disciplined risk management is essential for robust trading. As an early-stage asset, THQ’s price structure presents short-term volatility opportunities, but traders should remain vigilant against potential trend reversal risks.
Share
Content
THQ Current Price Overview
Analysis of Recent Price Volatility Structure
Key Support and Resistance Level Analysis
Trading Volume and Market Activity Trends
Potential Drivers of THQ Price Trends
Comprehensive Technical and Sentiment Analysis
Key Price Zones for Investor Focus
Summary: Structured, Disciplined Approach to THQ Trading


Related Articles

2025 BTC Price Prediction: BTC Trend Forecast Based on Technical and Macroeconomic Data

Flare Crypto Explained: What Is Flare Network and Why It Matters in 2025

Pi Coin Transaction Guide: How to Transfer to Gate.com

How to Use a Crypto Whale Tracker: Top Tool Recommendation for 2025 to Follow Whale Moves

What is N2: An AI-Driven Layer 2 Solution