A leading analyst has just forecasted that the price of Zcash could reach $580 if it surpasses the $470 threshold. At the time of the update, Zcash has entered the weekend with an impressive 17% growth, trading around $519.
Zcash Price Forecast: Surpassing $470 – Unlocking 35% Growth Potential
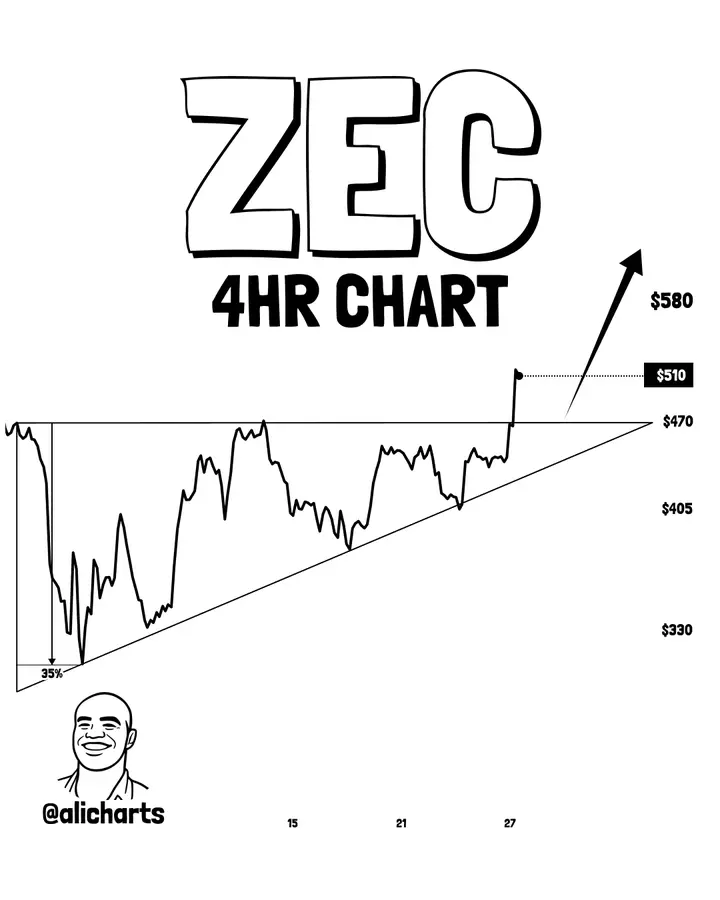
The Zcash price is showing clear strength on short-term timeframes, with the latest analysis from Ali_charts predicting this coin could move toward $580 after breaking through the important resistance level of $470.
 Alicharts’ Zcash Price Prediction Chart According to Ali, $470 is a key level to watch closely. He believes that breaking this level will trigger a strong rally, heading toward the $600 zone – an area that has repeatedly limited Zcash’s upward momentum during recent accumulation phases. Previous attempts to break through this level have failed, further reinforcing the role of $470 as a strong resistance zone. Therefore, closing above this level is seen as a confirmation signal of a breakout trend.
This confirmation signal appeared when ZEC broke above $470 with strong momentum, followed by a rapid price increase. This move indicates clear confidence from investors.
From a technical perspective, this completes the classic ascending triangle pattern. The projection from this pattern suggests a potential 35% increase from the breakout point, corresponding to the $580 target mentioned by Ali.
In the short term, the $470 zone will now serve as a critical support level. As long as the price remains above this level, the breakout trend remains intact. Mild corrections back to the support zone are normal and do not reflect market weakness.
Zcash: Trading within an Symmetrical Triangle – Breakout Opportunity
According to expert Matthew, Zcash has been consolidating over multiple sessions and is now showing signs of a turnaround. After a prolonged period of price compression, the market is attempting to break higher, bringing ZEC back into the spotlight for investors.
On the 2-hour chart, ZEC has been moving within a symmetrical triangle pattern with clearly defined sides. Currently, the balance has shifted in favor of the bulls as ZEC breaks above the upper trendline, opening the door for further growth.
 Symmetrical Triangle Chart of Zcash by @MatthewMatthew notes that Zcash is showing signs of breaking out of the triangle pattern but also advises traders to be cautious of false breakouts – a common occurrence in such patterns when the market has not fully confirmed the trend.
The market structure before the breakout has improved significantly, with higher lows indicating increasing buyer confidence. The most recent candles also closed near the upper boundary, reflecting investor conviction in holding at higher prices.
However, breakouts often do not happen smoothly. Short-term corrections back to the broken trendline are normal, and if this area is well defended, the upward trend will be further reinforced.
Trading volume has not yet surged dramatically but remains stable. Ideally, volume will increase significantly if this trend is truly confirmed. Otherwise, the risk of a false breakout remains, and investors should stay cautious.
The previous resistance line now becomes a key support level. If ZEC stays above this zone, the chances of reaching recent highs are high. Conversely, if the price falls back inside the triangle, the upward trend will weaken, and a deeper correction may occur.
Currently, the market structure still leans toward an upward trend but has not been fully confirmed. Patience at this stage can bring significant benefits to investors. The next candles will be crucial in determining whether ZEC is truly breaking out or if the market is creating a “bull trap.”
Mr. Giáo
Disclaimer: The information on this page may come from third parties and does not represent the views or opinions of Gate. The content displayed on this page is for reference only and does not constitute any financial, investment, or legal advice. Gate does not guarantee the accuracy or completeness of the information and shall not be liable for any losses arising from the use of this information. Virtual asset investments carry high risks and are subject to significant price volatility. You may lose all of your invested principal. Please fully understand the relevant risks and make prudent decisions based on your own financial situation and risk tolerance. For details, please refer to
Disclaimer.
Related Articles
Hyperliquid Price Jumps 22% as Commodity Trading Hits Record
Key Insights:
Hyperliquid surged over 20% weekly, driven by record commodity futures trading volumes, especially oil and silver contracts, gaining strong traction among traders.
Whale activity surpassed $3.6 billion in leveraged positions, boosting liquidity and reinforcing upward momentum a
CryptoFrontNews1m ago
Weekly Report: Gold Breaks Below $4,500! Crude Oil Surges Past $110, But Bitcoin Rallies and Outperforms Gold
Escalating tensions in the Middle East and the Federal Reserve's hawkish stance have impacted global financial markets. Gold plummeted more than 10% this week, marking its worst performance since 1983, while oil prices surged to historic highs. In contrast, Bitcoin rose against the trend, indicating a flow of capital toward crypto assets. The market continues to face uncertainty, and volatility in risk assets may persist.
動區BlockTempo1h ago
Bitcoin dips back below $75,000 on the eve of the Federal Reserve decision
Bitcoin recently touched $75,000 but failed to sustain the level, pulling back to $74,000, reflecting cautious sentiment among investors ahead of the upcoming Federal Reserve interest rate decision. Geopolitical risks and elevated energy prices have driven inflation higher, affecting market expectations for rate cuts and pushing the timeline for cuts to year-end. Technical analysis shows Bitcoin remains strong but has not confirmed a decisive breakout above the $75,000 level, with limited upside potential in the near term.
区块客1h ago
Here is why Bitcoin Cash traders should watch for this buy signal
Bitcoin Cash (BCH) remains above the crucial support level of 440 USD. Current market indicators show mixed signals, yet BCH's price action reflects positive momentum influenced by Bitcoin (BTC). Short-term trading opportunities arise, but long-term trends also need consideration for a robust strategy.
TapChiBitcoin2h ago
HAEDAL Pushes $0.03194 As It Breaks Out of Downtrend, Rare Market Analytics Signal 1252% Rally Ahead
As the broader cryptocurrency market continues to regain strength, the HAEDAL coin demonstrates strong upward momentum, according to a technical analysis shared today by analyst RoccoBullBottom.
The HAEDAL coin is the native cryptocurrency that drives the Haedal Protocol, a liquid staking
BlockChainReporter3h ago
