On December 31st, the market reported that Bitwise has officially filed for the issuance of 11 cryptocurrency ETF funds, with Sui being one of the notable altcoins included in the list.
Following this development, the price of SUI surged strongly, increasing nearly 19% in just three days, attracting significant investor interest.
Currently, Bitcoin is approaching and testing an important resistance zone around the $90,000 mark. Notably, Bitcoin’s dominance rate has decreased significantly since 12/30, indicating that capital is shifting towards the altcoin market.
In this context, the question arises whether the current upward momentum has enough strength to sustain, and whether Sui (SUI) is facing an opportunity to form a sustainable growth trend in the near future.
Why Sui could increase by another 70%
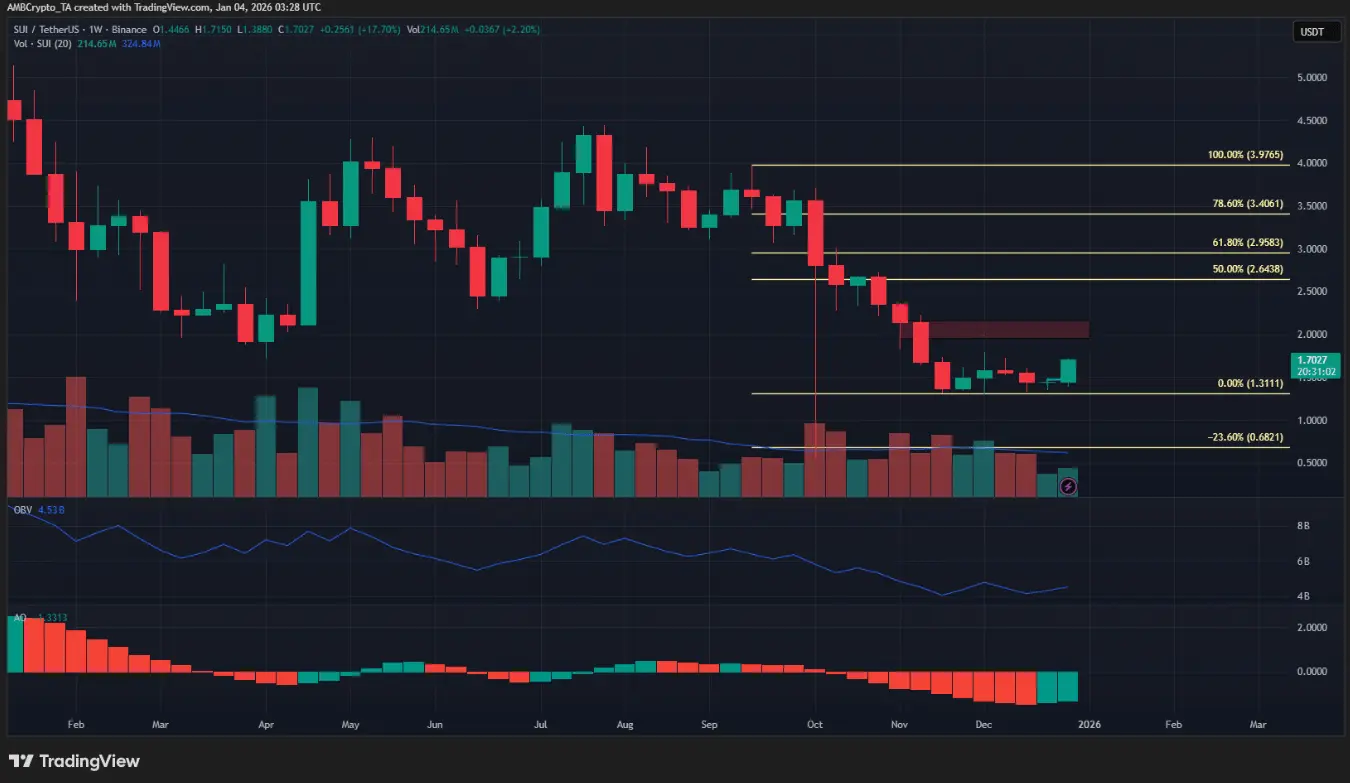 Weekly SUI/USDT chart | Source: TradingViewOn the weekly timeframe, the main trend of SUI remains bearish, although the recent recovery has attracted market attention. However, if the weekly candle can close firmly above the $1.79 level, this will send a positive signal that the bulls are temporarily regaining control and open up hope for a more noticeable recovery phase.
At that point, the price could be pushed towards higher target zones at $2.95 and $3.4 — important Fibonacci retracement levels acting as resistance above.
Nevertheless, momentum indicators and buying pressure on this timeframe still do not show a clear breakout, implying that the current rally may only be a technical rebound after previous weakness.
Potential reversal at the peak of the range
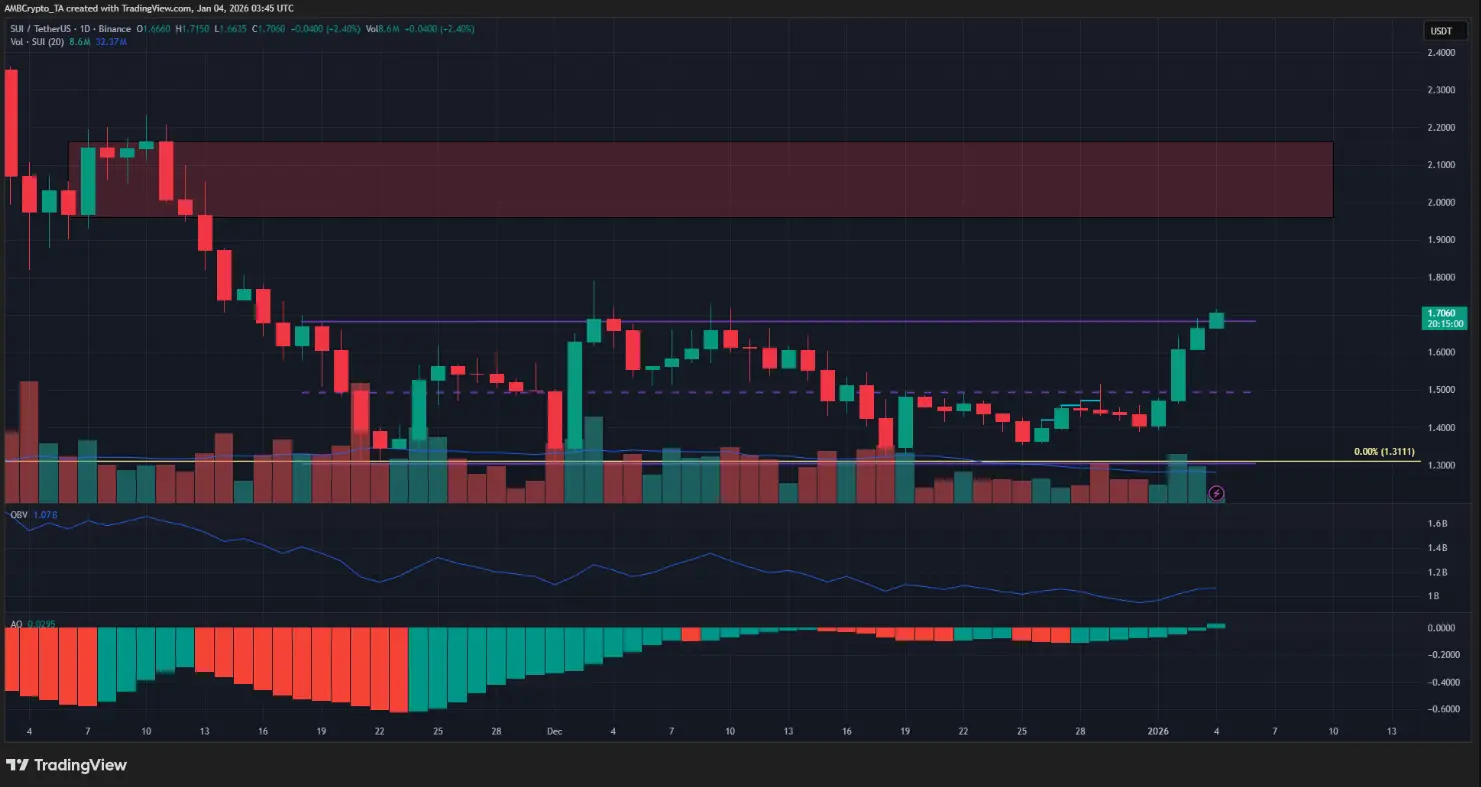 Daily SUI/USDT chart | Source: TradingViewThe oscillation pattern within the (purple zone) indicates an important peak at $1.68. At the time of writing, SUI is trading steadily above this level. If the price can record a clear daily candle closing above the upper boundary of the range, it will be a strong signal to reinforce confidence in the upward trend.
Conversely, failure to break out of the current range could serve as an early warning of increasing selling pressure and the risk of rejection. However, based on current developments, this negative scenario is considered unlikely.
Action for traders: Buy on breakout
The OBV indicator is gradually rising, while the Awesome Oscillator shows a bullish crossover — signs that demand and market momentum are improving significantly. At the same time, Bitcoin (BTC) has successfully broken through the local resistance zone around $90,000, further boosting momentum and reinforcing broad positive sentiment.
Based on the weekly chart signals, traders may consider a buy strategy upon confirmation of a breakout, aiming for higher targets, notably around the $3.40 zone.
Disclaimer: The information on this page may come from third parties and does not represent the views or opinions of Gate. The content displayed on this page is for reference only and does not constitute any financial, investment, or legal advice. Gate does not guarantee the accuracy or completeness of the information and shall not be liable for any losses arising from the use of this information. Virtual asset investments carry high risks and are subject to significant price volatility. You may lose all of your invested principal. Please fully understand the relevant risks and make prudent decisions based on your own financial situation and risk tolerance. For details, please refer to
Disclaimer.
Related Articles
Saylor Hints at Buying More Bitcoin as New Analysis States BTC Is Years Away From New ATH
Michael Saylor hints at buying more Bitcoin as new analysis comes to light.
Expert believes BTC is years away from a new ATH.
Bearish vs bullish sentiments clash.
The crypto market is in higher spirits this week as the price of pioneer crypto
CryptoNewsLand1m ago
Shiba Inu Death Cross Emerges as SHIB Price Slips Below Key Support
Key Insights
Shiba Inu confirms a death cross on the daily chart as the short term moving average drops below the long term average.
Over 112 billion SHIB moved to exchanges within two days, increasing market attention on potential selling activity and near term price pressure.
SHIB
CryptoFrontNews2m ago
Crypto Market Cap Surges Past $2.5T As Bitcoin and Ethereum Rally
The crypto market is recovering, with a market cap of $2.52T and a 3.23% increase. Bitcoin and Ethereum rose by 3.20% and 7.28%, respectively. Other gains include D ($D) at 728.37%. DeFi TVL and NFT sales also increased, while the Australian Senate supports a crypto regulatory framework.
BlockChainReporter39m ago
Virtuals Protocol (VIRTUAL) Shows AI Agents Can Thrive Off Ethereum – Here’s What That Means
Virtuals Protocol is making significant strides in the crypto and AI sectors with innovative features like the ERC-8183 token for trustless payments between AI agents. Recognized as a top altcoin, it fosters real-world applications, driving demand and growth for its ecosystem.
CaptainAltcoin42m ago
Bitcoin Price Enters Critical Resistance Zone! Renowned Trader Eugene: Already Reversed to Go Long
The cryptocurrency market rebounded this morning, with Bitcoin briefly breaking through $74,000 to reach a new high. Known trader Eugene turned bullish, believing the market is showing resilience. Ethereum and Sol also gained, with over $300 million in liquidations across the network in the past 24 hours, mainly concentrated in Ethereum. Eugene maintains an optimistic outlook on the market, expecting that if Bitcoin can firmly hold above $74,000, it will drive an overall market rally.
ChainNewsAbmedia1h ago
MORPHO Rockets 9% – Key Resistance Could Determine the Next Move
MORPHO surged 9% as spot trading volume jumped 52 percent in 24 hours.
Price now tests a critical $2.08 supply zone that may trigger breakout or pullback.
Growing TVL supports bullish momentum, indicating rising user confidence and ecosystem participation.
Morpho — MORPHO, has captured t
CryptoNewsLand1h ago
