On December 31st, the market reported that Bitwise has officially filed for the issuance of 11 cryptocurrency ETF funds, with Sui being one of the notable altcoins included in the list.
Following this development, the price of SUI surged strongly, increasing nearly 19% in just three days, attracting significant investor interest.
Currently, Bitcoin is approaching and testing an important resistance zone around the $90,000 mark. Notably, Bitcoin’s dominance rate has decreased significantly since 12/30, indicating that capital is shifting towards the altcoin market.
In this context, the question arises whether the current upward momentum has enough strength to sustain, and whether Sui (SUI) is facing an opportunity to form a sustainable growth trend in the near future.
Why Sui could increase by another 70%
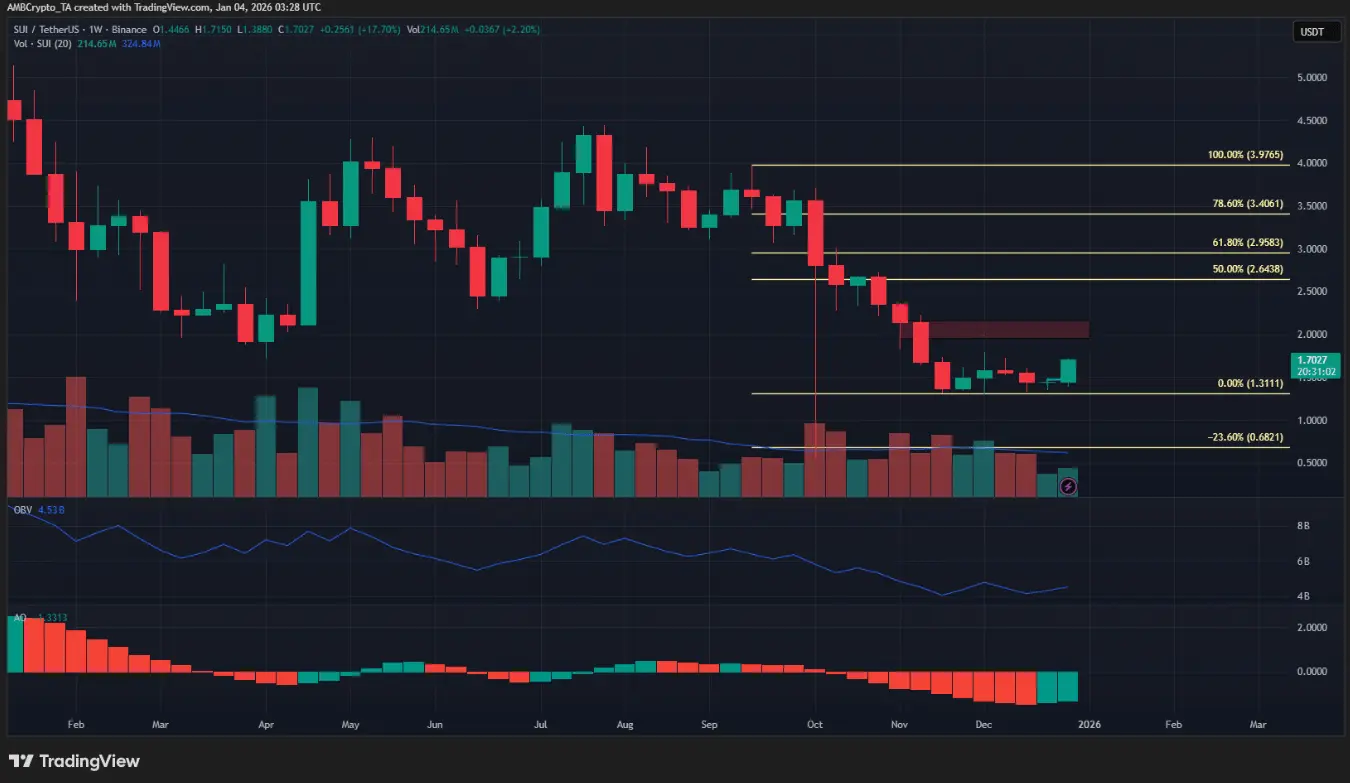 Weekly SUI/USDT chart | Source: TradingViewOn the weekly timeframe, the main trend of SUI remains bearish, although the recent recovery has attracted market attention. However, if the weekly candle can close firmly above the $1.79 level, this will send a positive signal that the bulls are temporarily regaining control and open up hope for a more noticeable recovery phase.
At that point, the price could be pushed towards higher target zones at $2.95 and $3.4 — important Fibonacci retracement levels acting as resistance above.
Nevertheless, momentum indicators and buying pressure on this timeframe still do not show a clear breakout, implying that the current rally may only be a technical rebound after previous weakness.
Potential reversal at the peak of the range
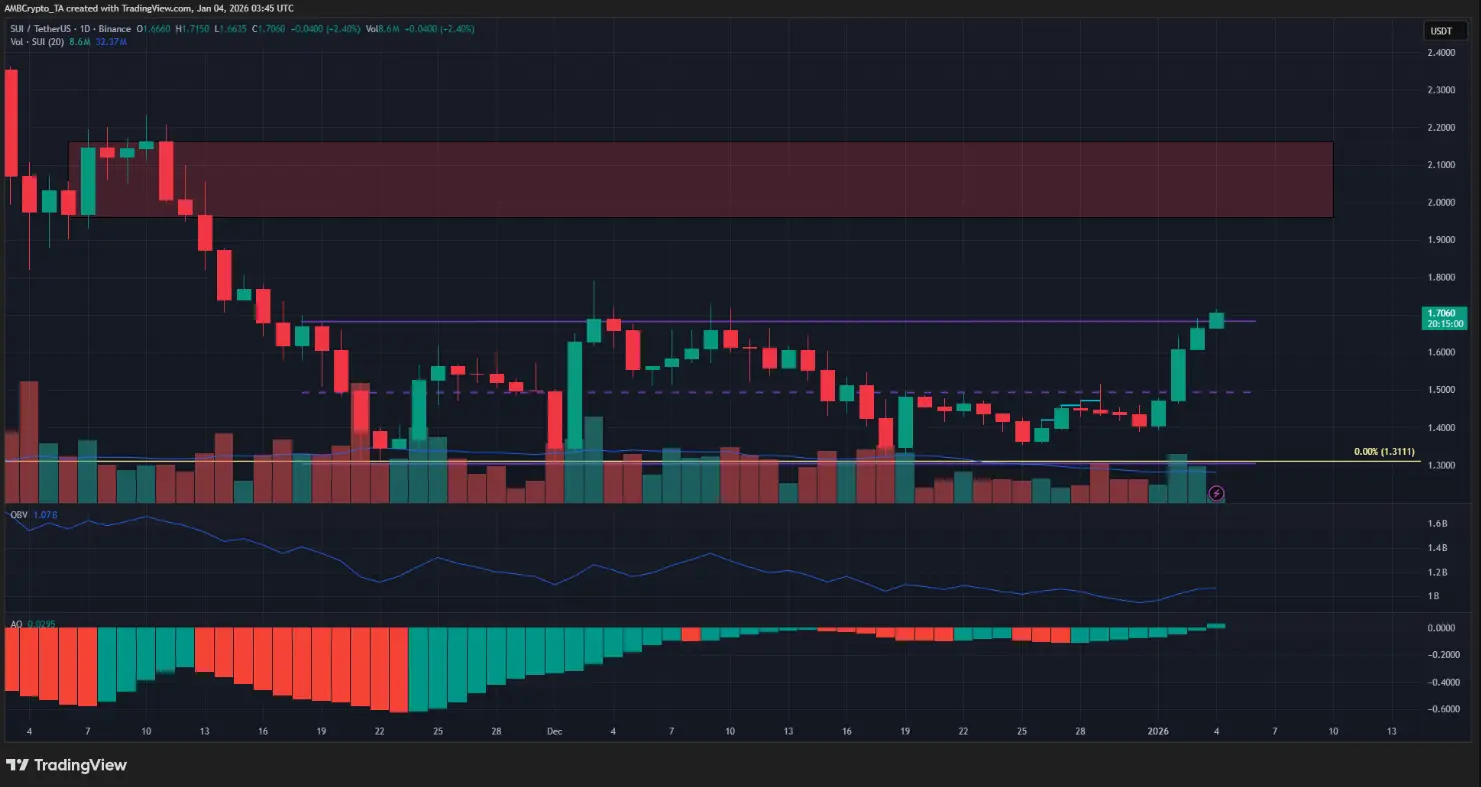 Daily SUI/USDT chart | Source: TradingViewThe oscillation pattern within the (purple zone) indicates an important peak at $1.68. At the time of writing, SUI is trading steadily above this level. If the price can record a clear daily candle closing above the upper boundary of the range, it will be a strong signal to reinforce confidence in the upward trend.
Conversely, failure to break out of the current range could serve as an early warning of increasing selling pressure and the risk of rejection. However, based on current developments, this negative scenario is considered unlikely.
Action for traders: Buy on breakout
The OBV indicator is gradually rising, while the Awesome Oscillator shows a bullish crossover — signs that demand and market momentum are improving significantly. At the same time, Bitcoin (BTC) has successfully broken through the local resistance zone around $90,000, further boosting momentum and reinforcing broad positive sentiment.
Based on the weekly chart signals, traders may consider a buy strategy upon confirmation of a breakout, aiming for higher targets, notably around the $3.40 zone.
Disclaimer: The information on this page may come from third parties and does not represent the views or opinions of Gate. The content displayed on this page is for reference only and does not constitute any financial, investment, or legal advice. Gate does not guarantee the accuracy or completeness of the information and shall not be liable for any losses arising from the use of this information. Virtual asset investments carry high risks and are subject to significant price volatility. You may lose all of your invested principal. Please fully understand the relevant risks and make prudent decisions based on your own financial situation and risk tolerance. For details, please refer to
Disclaimer.
Related Articles
Bitcoin Stalls Near $67K As Analyst Warns Market Could Revisit Recent Lows
Crypto analyst Michaël van de Poppe’s latest comment on Bitcoin landed at a moment when the market is already struggling to find direction. In his post, he said the trend remains unchanged, described the session as one of the “most boring” of the week, and argued that if Bitcoin cannot push back
BlockChainReporter4m ago
Hyperliquid is experiencing strong growth from 2 main areas: What does this mean for the demand for HYPE?
Recent on-chain data shows a clear shift in how demand is forming around Hyperliquid (HYPE). A "whale" deposited 4 million USDC, then purchased approximately 56,208 HYPE for a total value of about 2.1 million USD at a price of 38.21 USD.
Notably, the accumulation process did not stop at a single transaction.
TapChiBitcoin6m ago
Oil prices exceed $100! Trump calls for negotiations nearing the end "to seize Iranian oil," analysts warn: Bitcoin may dip to a bottom of $46,000.
Oil prices broke above $100 on Monday due to a sharp rise in geopolitical risks, especially Trump's tough rhetoric towards Iran. Crypto analyst Willy Woo warned that Bitcoin's on-chain capital outflow may fall to between $46,000 and $54,000. If the global macro market structure breaks down, the crypto market faces a deeper bear market risk. Trump's negotiation moves and the strategic importance of Hark Island have heightened market uncertainty and affected global oil prices and asset liquidity.
動區BlockTempo9m ago
Trump TACO trading encounters bottlenecks, Iranian speaker teaches traders reverse operations.
Iranian Parliament Speaker Ghalibaf questioned Trump's trading strategy TACO and suggested taking a reverse approach. The article analyzes the reasons for TACO's failure in the Iranian crisis, including the different nature of the opponents, the absence of the Supreme Leader, and the rising geopolitical risks, which have led to a decline in market confidence. Additionally, Ghalibaf also threatened that institutions purchasing U.S. Treasury bonds are "legitimate military targets," posing a new threat to the bond market.
MarketWhisper28m ago
A Canadian billionaire mocks Tom Lee's latest forecast for the crypto market.
Frank Giustra mocked Wall Street strategist Tom Lee's optimistic forecast about the end of "crypto winter." While Lee sees market reversal signals and potential bullish trends, Giustra remains skeptical, emphasizing gold as a safer investment amid high-risk crypto.
TapChiBitcoin34m ago
The MVRV of short-term Bitcoin holders has dropped to 0.77, with an average unrealized loss of nearly 30%.
The current price of Bitcoin is in the range of $65,000 to $70,000, which is significantly different from the average cost of short-term holders at $85,900, leading most investors to incur losses. The MVRV metric has dropped to 0.77, indicating that the short-term holding group is under pressure.
GateNews39m ago
