- Raydium เป็นผู้นําผู้แพ้ โดยพุ่งขึ้นกว่า 33%
- ปริมาณการซื้อขายรายวันของ RAY เพิ่มขึ้นอย่างมากถึง 421%
DEX ชั้นนำบน Solana, Raydium (RAY), ได้รับความเสียหายมากที่สุดและลื่นล้มลงมากกว่า 33.27% การลดลงนี้เกิดจากรายงานที่ Pump.fun, แพลตฟอร์มการเสนอขายโทเค็นที่อิงจาก Solana, กำลังวางแผนที่จะเปิดตัวเครื่องมือทำตลาดอัตโนมัติของตน (AMM)
การแทนที่ Raydium สําหรับ AMM จะส่งผลให้เกิดความเชื่อมั่นที่ลดลงสําหรับแนวโน้มระยะยาวของ RAY และอาจท้าทายการครอบงําในบริการ Solana DEX
ปัจจุบันกำลังผ่านขั้นตอนการทดสอบ สิ่งนี้ช่วยให้ผู้ใช้สามารถซื้อขายสกุลเงินดิจิทัลโดยตรงต่อความเป็นเหมืองในสัญญาอัจฉริยะ ซึ่งทำให้ไม่จำเป็นต้องมีคู่ค้าแบบดั้งเดิม
การสับสนของ RAY ทำให้ราคาลดจาก $4.27 ลงไป $2.83 ทำให้เป็นหุ้นที่ขาดทุนมากที่สุด ณ เวลาที่เขียนราคาของสินทรัพย์ค้างที่ $2.85 พร้อมกับปริมาณการซื้อขายรายวันที่ถึง $326 ล้าน
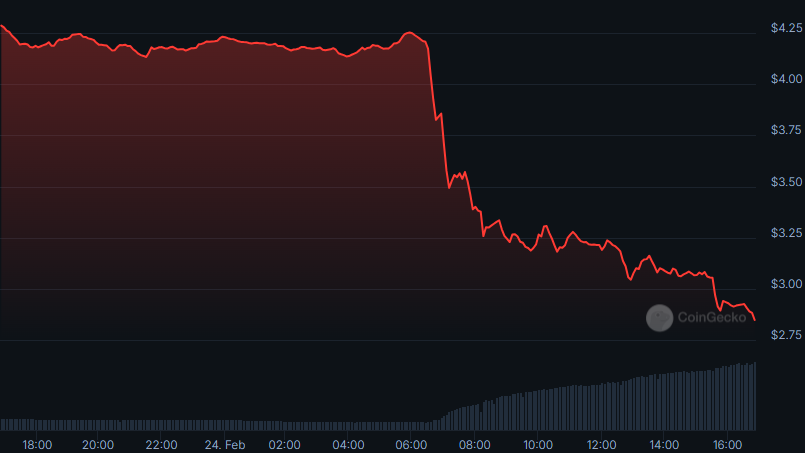 *กราฟราคา RAY (แหล่งที่มา: CoinGecko)*ความสำคัญที่สุดคือ สินทรัพย์เหล่านี้เป็นรูปแบบหมี ตลอด 30 วันที่ผ่านมา ลดลงมากกว่า 60.80% หมีรักษาตัวไว้โดยไม่มีการเปลี่ยนแนว ในช่วง 7 วันที่ผ่านมา Raydium ลดลงประมาณ 41.80% RAY ยังคงสูญเสียเรทการเคลื่อนไหวและมาถึงระดับการซื้อขายที่ต่ำที่สุด
รัยสามารถหลุดพ้นจากกดดันทิศลบได้หรือไม่?
ความกดดันจากตลาดหมีของ RAY ทำให้ราคาลดลงจากระดับที่ได้รับก่อนหน้าและตกอย่างรุนแรงต่ำกว่าพื้นที่สนับสนุนสำคัญ ในกรณีที่พื้นที่สนับสนุนที่ระดับ $3.07 ล้มเหลว ราคา Raydium อาจตกลงไปยังระดับ $2 ที่ไม่เคยเป็นที่รู้ก่อน
ในกรณีที่มีการเปลี่ยนแนวโน้ม ราคาสินทรัพย์อาจทดสอบความต้านทานที่ $3.16 ทันที แรงเสริมตลาดที่มีมุมมองด้านบวกของ Raydium อาจเสนอตัวเสาทองเพื่อเริ่มต้นการเคลื่อนไหวที่เป็นไปได้สู่ระดับสูงสุดที่ $5 หรือมากกว่า
เส้น Raydium’s Moving Average Convergence Divergence (MACD) และเส้นสัญญาณตั้งอยู่ด้านล่างเส้นศูนย์ นี่แสดงให้เห็นว่ามีการเกิดการตัดกันแบบหมีแข็งและการกดขายเป็นหลักในตลาด
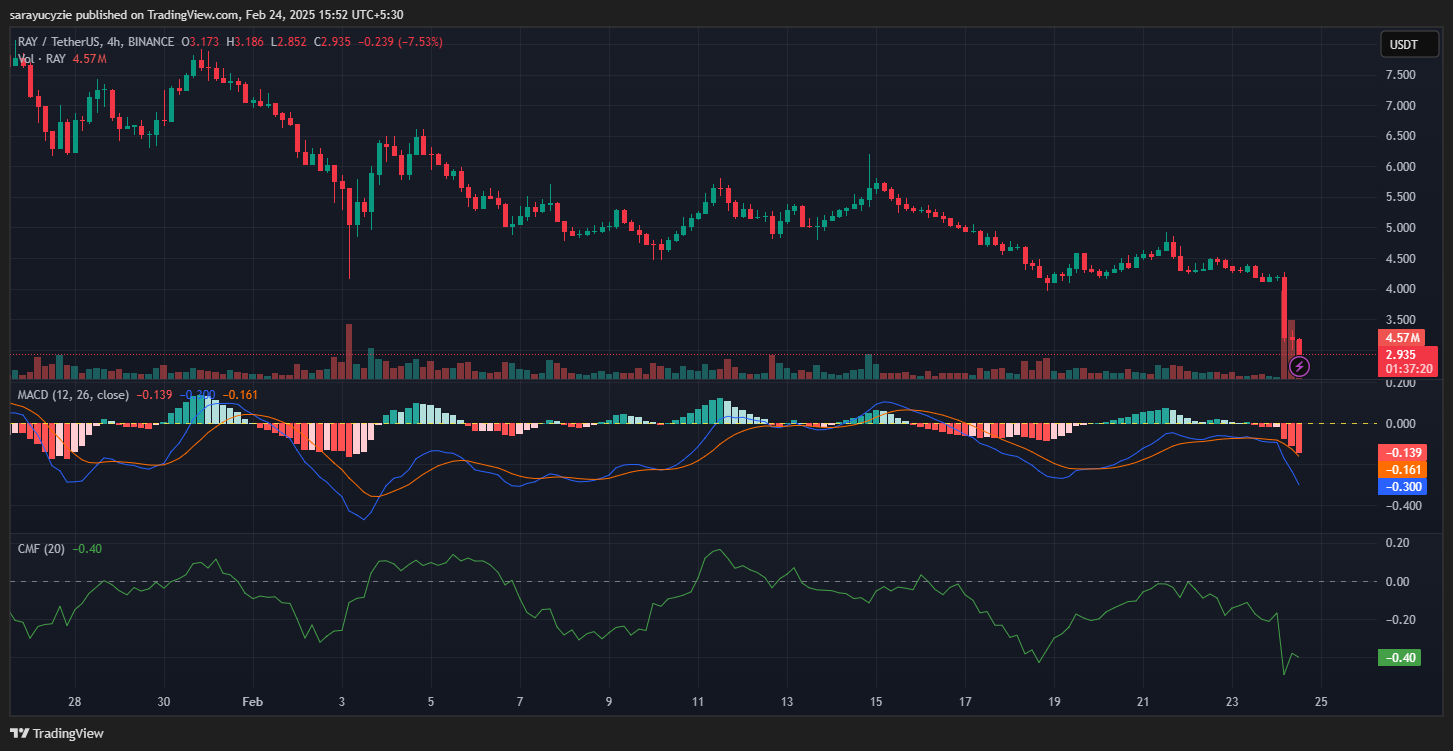 *กราฟ RAY (แหล่งที่มา: TradingView)*ตัวบ่งชี้การกระทำเงินตรา Chaikin Money Flow (CMF) ที่ -0.40 บ่งชี้ว่าเงินกำลังไหลออกจากสินทรัพย์ด้วยผู้ขายควบคุมตลาดในขณะเดียวกันปริมาณซื้อขาย RAY รายวันเพิ่มขึ้น 421%
นอกจากนี้ แผนภูมิการซื้อขายแสดงค่า Bull Bear Power (BBP) ที่ -1.662 ระบุว่า หมีอยู่ในการควบคุม โดยมีความกดดันในการขายเพิ่มมากกว่าเสถียรภาพในการซื้อของ Raydium’s ดัชนีความแข็งแกร่งสัมพันธ์รายวัน (RSI) ที่ 18.21 จุดระบุว่าสินทรัที่ขายกำลังมีกฎหมาย
คำประกาศ: ความเห็นที่แสดงในบทความนี้เป็นเพียงของผู้เขียนเท่านั้น มันไม่แสดงถึงคำแนะนำในการลงทุนใด ๆ TheNewsCrypto team ขอเสนอให้ทุกคนทำการวิจัยของตนเองก่อนการลงทุน.
ข่าวสารเกี่ยวกับสกุลเงินดิจิทัลที่โดดเด่น
XRP จะล้มลุกใต้ $3 นานเท่าไร?