Trade
Basic
Futures
Futures
Hundreds of contracts settled in USDT or BTC
TradFi
Gold
Trade global traditional assets with USDT in one place
Options
Hot
Trade European-style vanilla options
Unified Account
Maximize your capital efficiency
Demo Trading
Futures Kickoff
Get prepared for your futures trading
Futures Events
Participate in events to win generous rewards
Demo Trading
Use virtual funds to experience risk-free trading
Earn
Launch
CandyDrop
Collect candies to earn airdrops
Launchpool
Quick staking, earn potential new tokens
HODLer Airdrop
Hold GT and get massive airdrops for free
Launchpad
Be early to the next big token project
Alpha Points
Trade on-chain assets and enjoy airdrop rewards!
Futures Points
Earn futures points and claim airdrop rewards
Investment
Simple Earn
Earn interests with idle tokens
Auto-Invest
Auto-invest on a regular basis
Dual Investment
Buy low and sell high to take profits from price fluctuations
Soft Staking
Earn rewards with flexible staking
Crypto Loan
0 Fees
Pledge one crypto to borrow another
Lending Center
One-stop lending hub
VIP Wealth Hub
Customized wealth management empowers your assets growth
Private Wealth Management
Customized asset management to grow your digital assets
Quant Fund
Top asset management team helps you profit without hassle
Staking
Stake cryptos to earn in PoS products
Smart Leverage
New
No forced liquidation before maturity, worry-free leveraged gains
GUSD Minting
Use USDT/USDC to mint GUSD for treasury-level yields
More
INVESTERCLUB
RIZE TO CONCURE
INVESTERCLUB
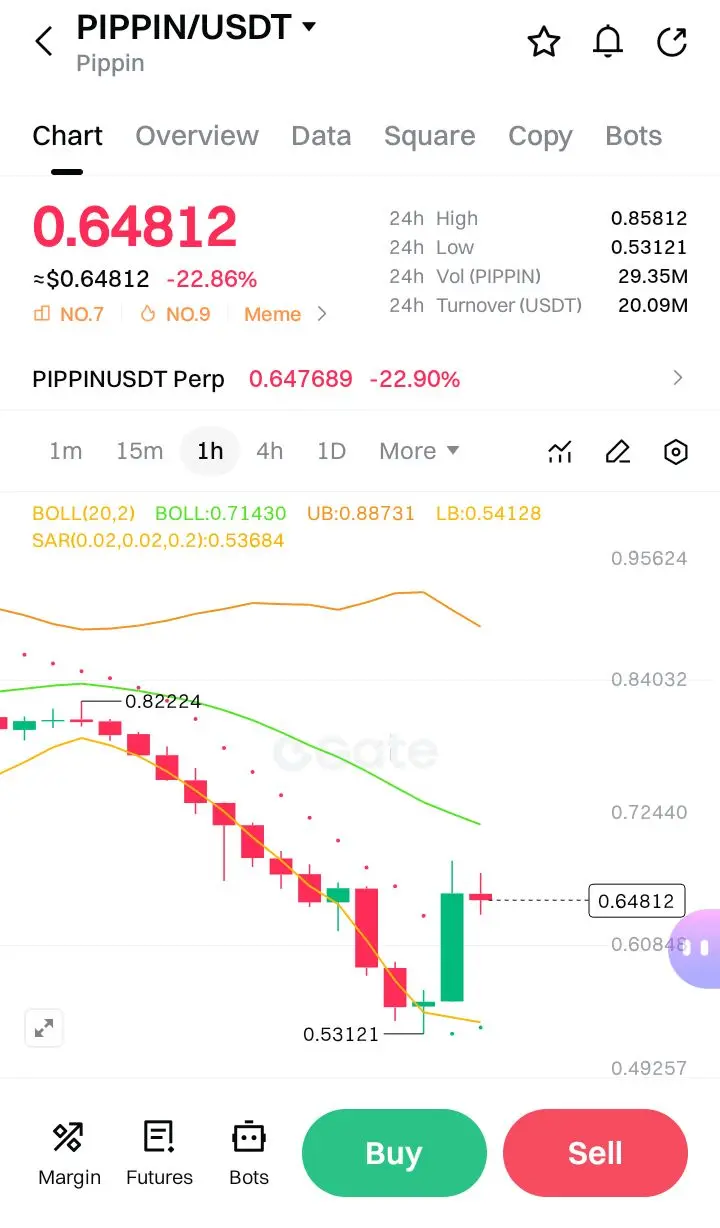
$PIPPIN #DeepCreationCamp
PIPPIN/USDT 1-hour chart, Detailed technical analysis based on the visible indicators and price action.
Technical Overview
Current Price: 0.64812 USDT
24h Change: -22.86% (significant bearish momentum)
Key Technical Levels
Support Levels:
· Immediate Support: 0.60848 (recent consolidation zone)
· Strong Support: 0.54128 (Lower Bollinger Band)
· Critical Support: 0.53211 (recent swing low)
· Major Support: 0.49257 (multi-week low)
Resistance Levels:
· Immediate Resistance: 0.72440 (psychological level)
· Key Resistance: 0.84032 (previous consolidation)
· Major Resista
PIPPIN-27.64%

- Reward
- 1
- Comment
- Repost
- Share
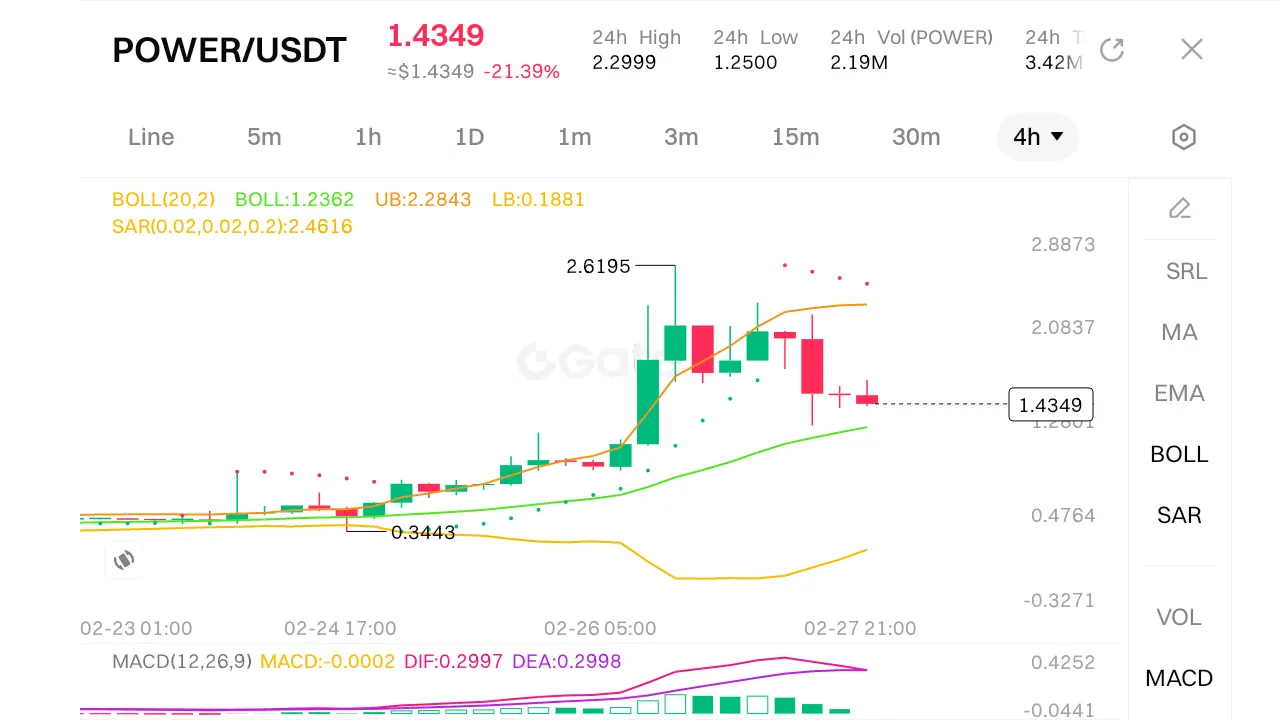
$POWER #DeepCreationCamp
Here is the analysis applying The 3 Candle Model (Range, OB + Break + OTE, KOD).
The Setup
· Pair: POWER/USDT
· Current Price: ~$1.44
· Context: The price is showing a significant drop (-21% in 24h) and appears to be attempting to find a bottom or reverse after a sell-off.
Candle 1: Range
Function: To identify the high and low that defines the range. This is the "parent" candle that provides the structure.
· Identification: Looking at the charts (specifically the 1D or 4H structure implied by the data), the high is clearly defined by the 24h High of 2.2999.
· Low: The
POWER-23.11%
- Reward
- 2
- Comment
- Repost
- Share
#DeepCreationCamp
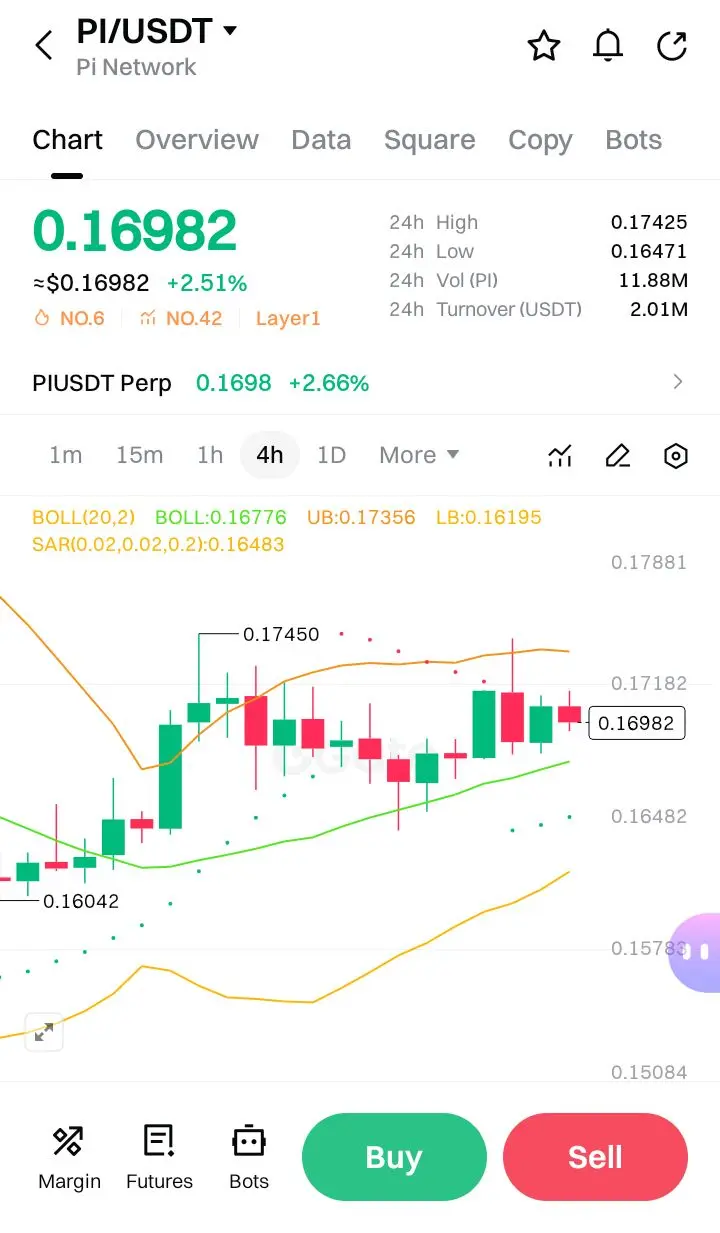
Here is an in-depth technical K-line analysis focusing on price action, indicators, and market structure:
$PI
1. Price Action & Market Structure
· Current Price: 0.16982
· 24h Change: +2.51\%
· Rank: #6 in trending (?), #42 in Layer 1
The asset is trading near the upper half of its 24h range (0.16471–0.17425), indicating bullish momentum within the day. The price is currently above the middle and upper Bollinger Bands, suggesting strength and potential overextension.
2. Bollinger Bands (20, 2)
· Upper Band (UB): 0.17356
· Middle Band (MB): 0.16776
· Lower Band (LB
PI3.29%

- Reward
- 4
- Comment
- Repost
- Share
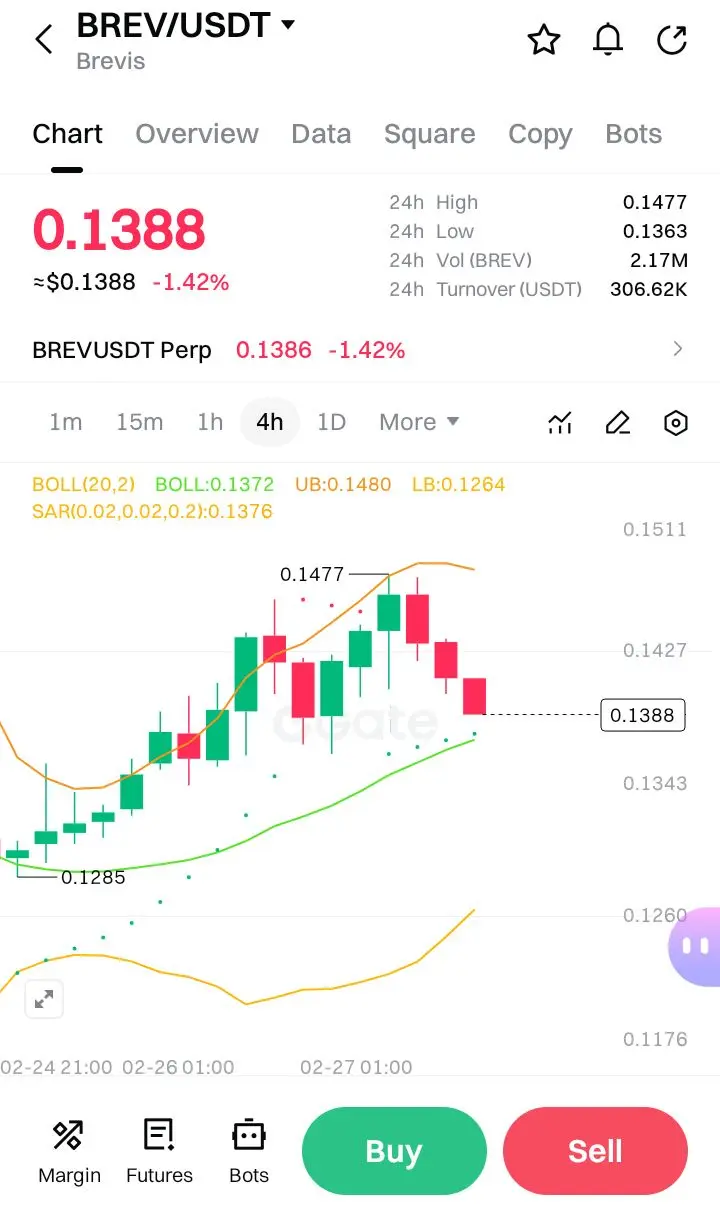
#CelebratingNewYearOnGateSquare Based on the charts & concepts Of SMC (CHOCH, Order Block, FVG, BOS), here is a technical analysis and trade setup for BREV/USDT.
$BREV
Analysis of the Chart
Looking at the structure on the right-side chart (which appears to be a lower timeframe like the 15m or 1h), the market has recently exhibited the following behavior:
1. Break of Structure (BOS) / CHOCH: The price was previously in a downtrend, making lower lows. Recently, the price broke above a key resistance level (around 0.1403). This break of the previous lower high structure indicates a Change of C
BREV-2.77%
- Reward
- 2
- 1
- Repost
- Share
EqunixHub:
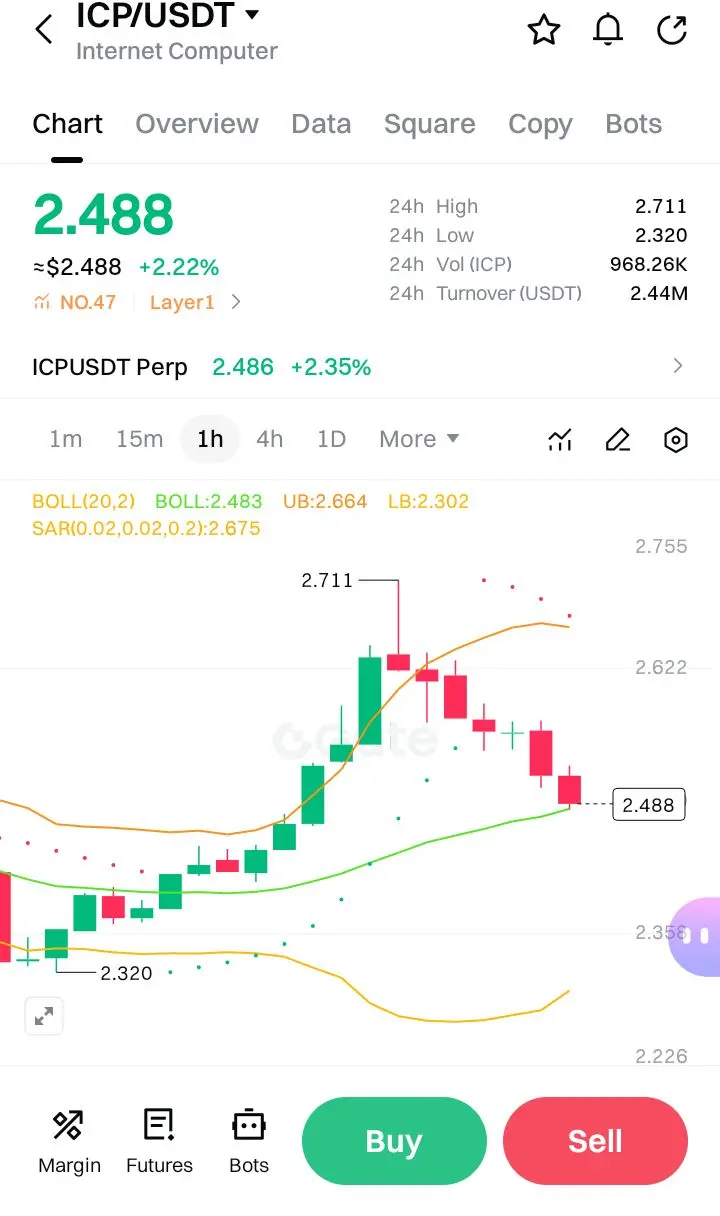
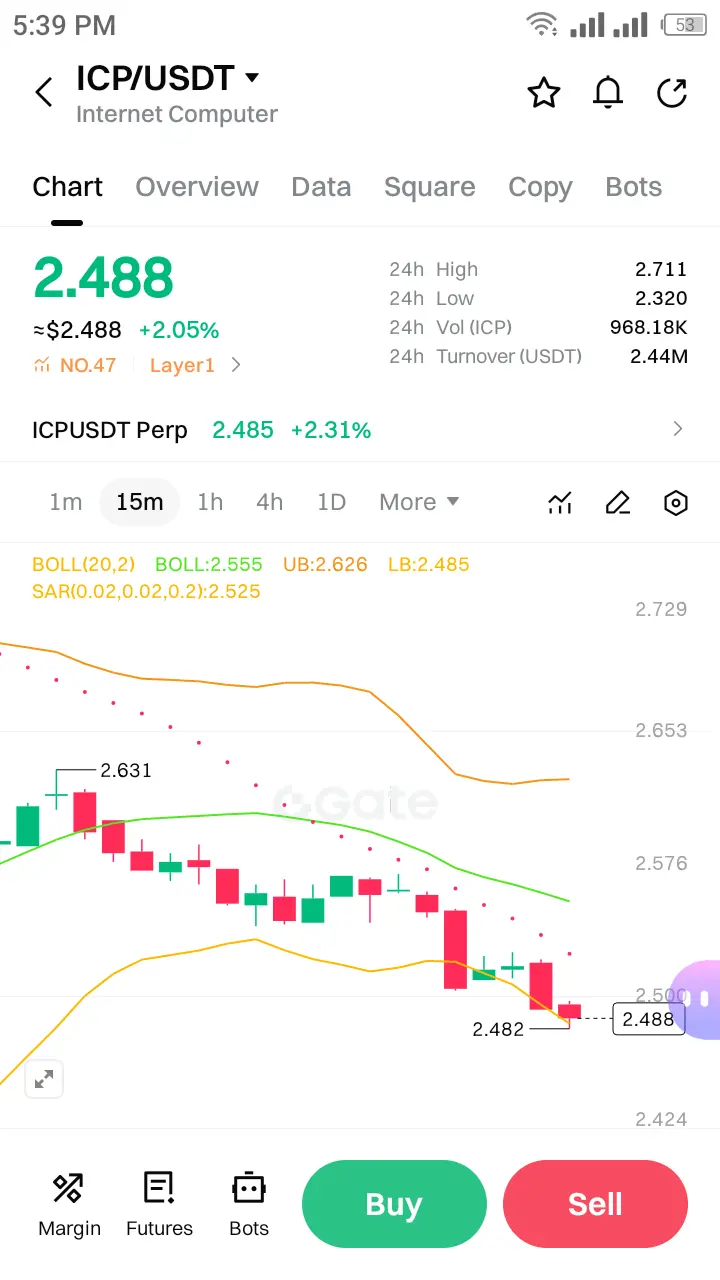
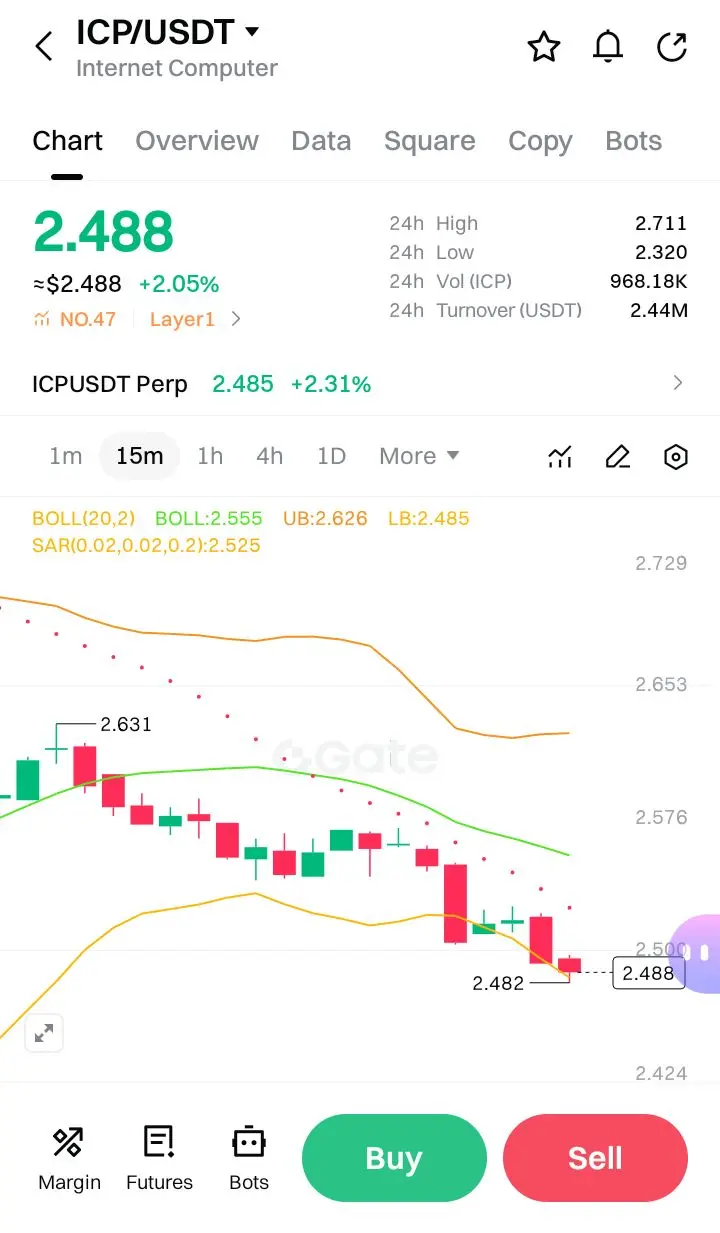
nice article#CelebratingNewYearOnGateSquare ICP/USDT, here is an in-depth technical analysis.
Executive Summary
Internet Computer (ICP) is trading at $2.488, showing a modest gain of approximately +2.2% on the day. The price is currently in a consolidation phase, sandwiched between critical support and resistance levels defined by the Bollinger Bands. The market is reacting to the upper resistance from the previous session, indicating a short-term battle between bulls and bears.
1. Price Action & Market Structure
· Current Price: $2.488
· Context: The price action on the 1-hour (1H) timeframe.
· Structure
ICP5.06%
- Reward
- 5
- 1
- Repost
- Share
ShortingBeachfrontVill :
:
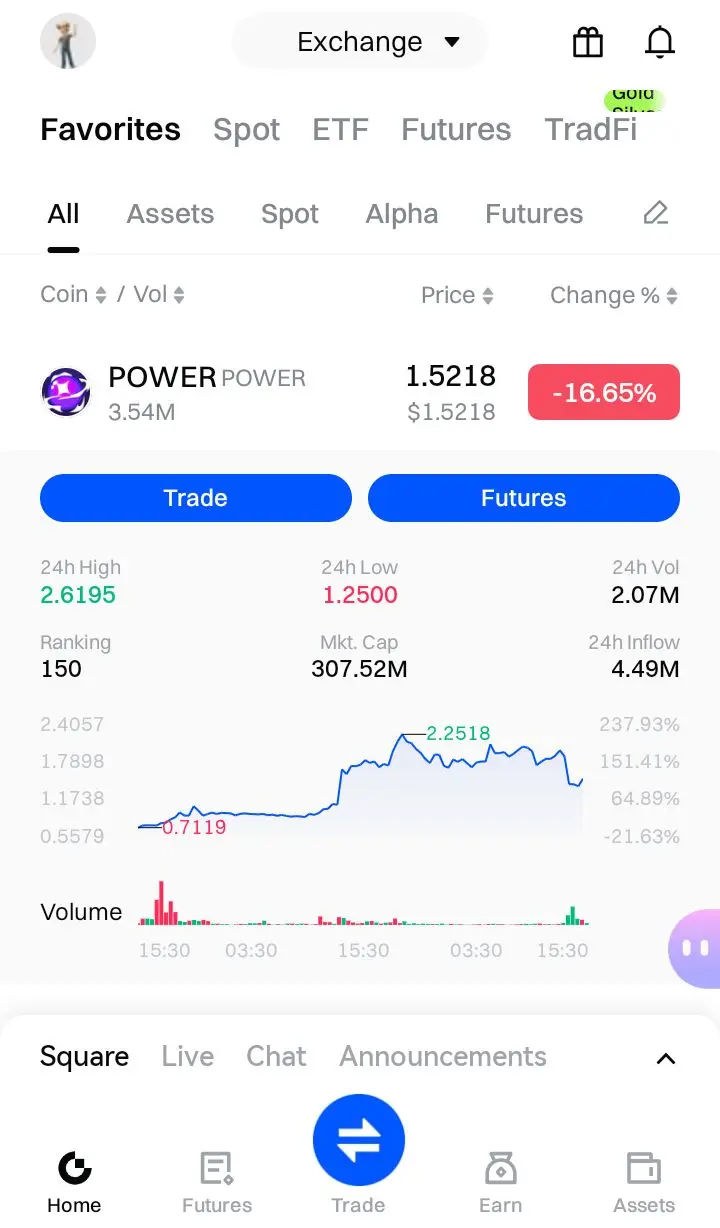
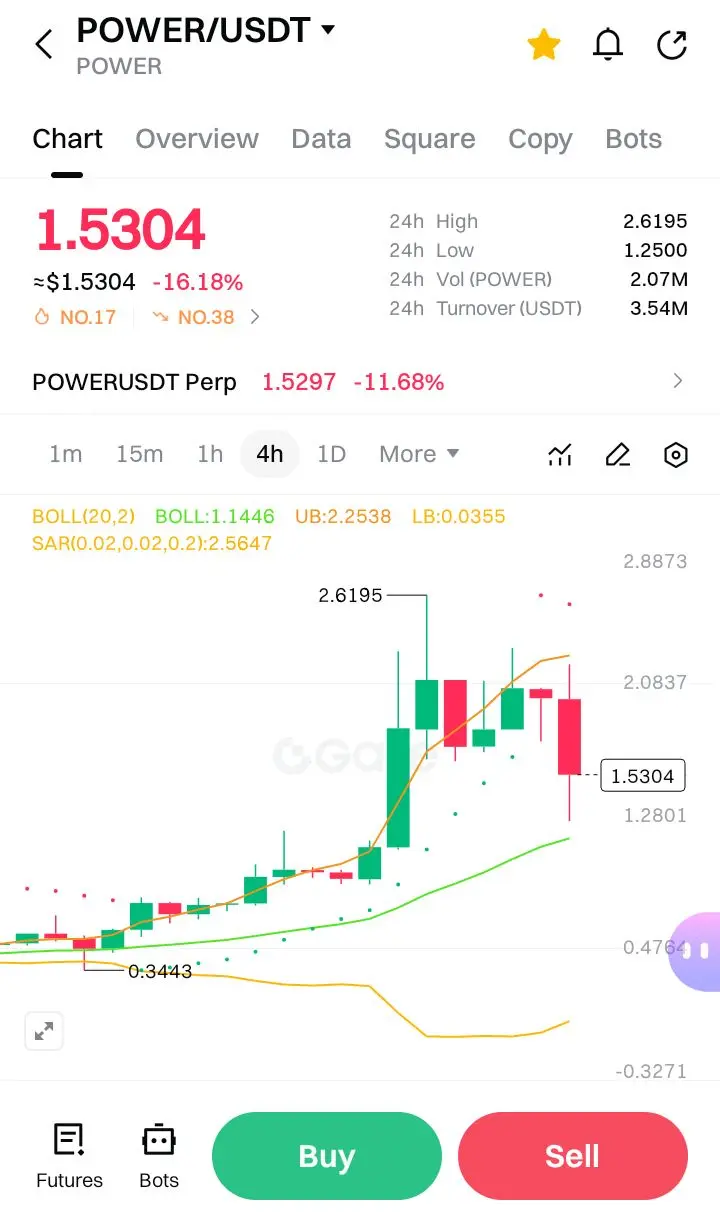
Let me know next time when to buy long or short!🙏🏻#CelebratingNewYearOnGateSquare POWER/USDT, here is a concise technical analysis:
$POWER
1. Market Overview
· Current Price: $1.5304
· 24-Hour Change: -16.18% (Strong bearish momentum)
· 24-Hour Range: High $2.6195 / Low $1.2500 (High volatility)
2. Key Indicators Analysis
Bollinger Bands (20,2)
· Upper Band (UB): 2.2538
· Middle Band (BOLL): 1.1446
· Lower Band (LB): 0.0355
· Analysis: The current price ($1.5304) is trading above the middle band but well below the upper band.
· Implication: The sharp drop from the high suggests the price has broken down from an overextended rally. The wide
POWER-23.11%
- Reward
- 3
- 3
- Repost
- Share
INVESTERCLUB:
Bollinger Bands are wide, volatility is high, and price is bleeding. In markets like this, patience beats precision. Let the levels set up before you set your entries.View More
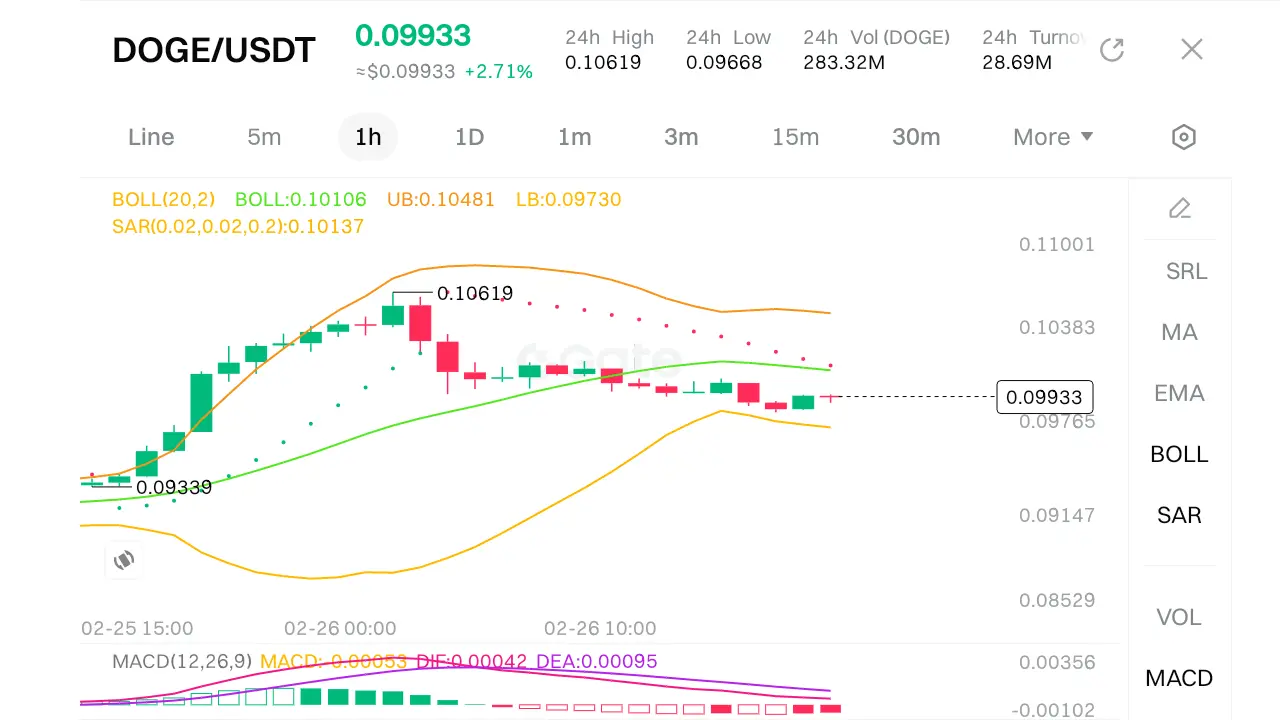
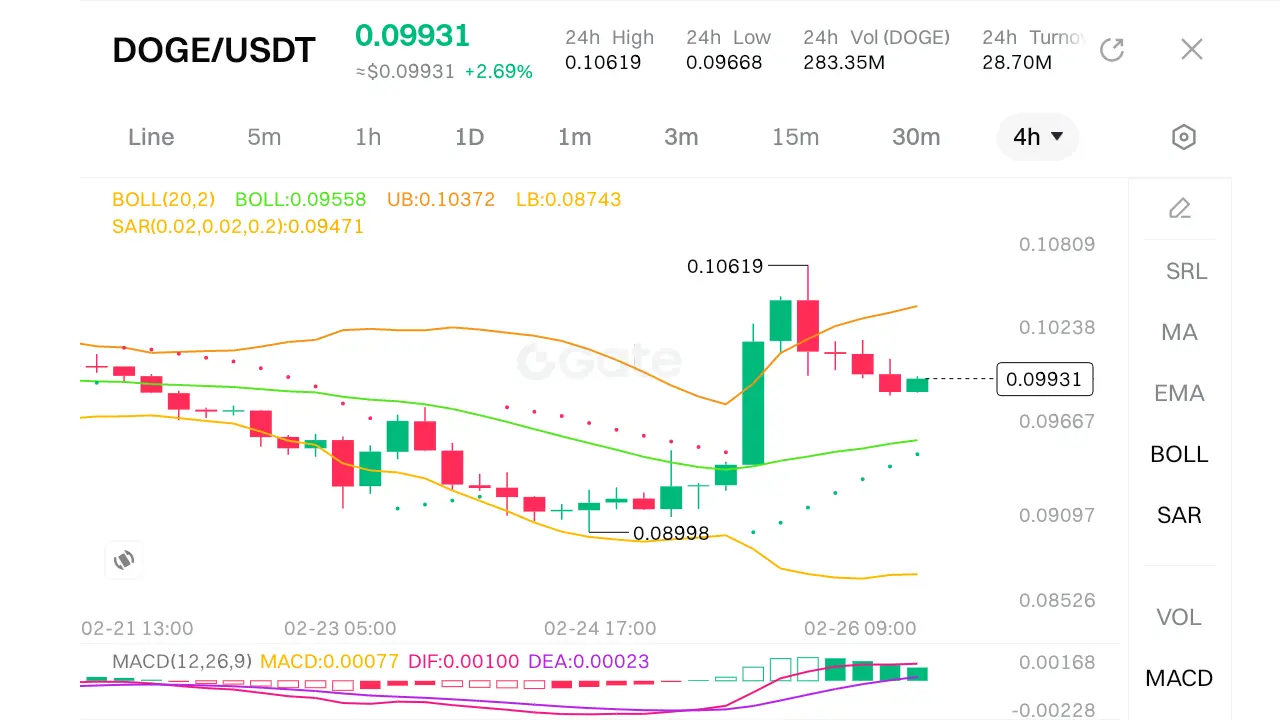
$DOGE #DeepCreationCamp
Here’s a breakdown of the current market structure, potential key levels, and what to watch for.
Key Levels to Watch
· Immediate Resistance: $0.10047 – $0.10089 (Upper Bollinger Band on the shorter timeframes and psychological resistance).
· Major Resistance: $0.10383 – $0.10619 (Recent swing high and 24h High).
· Immediate Support: $0.09816 – $0.09850 (Lower Bollinger Band and SAR level).
· Major Support: $0.09668 – $0.09730 (24h Low and LB on longer timeframe).
Momentum and Flow
· Overall Trend: The price is hovering near the middle Bollinger Band (0.0993–0.0995) acr
DOGE-3.68%
- Reward
- 3
- Comment
- Repost
- Share
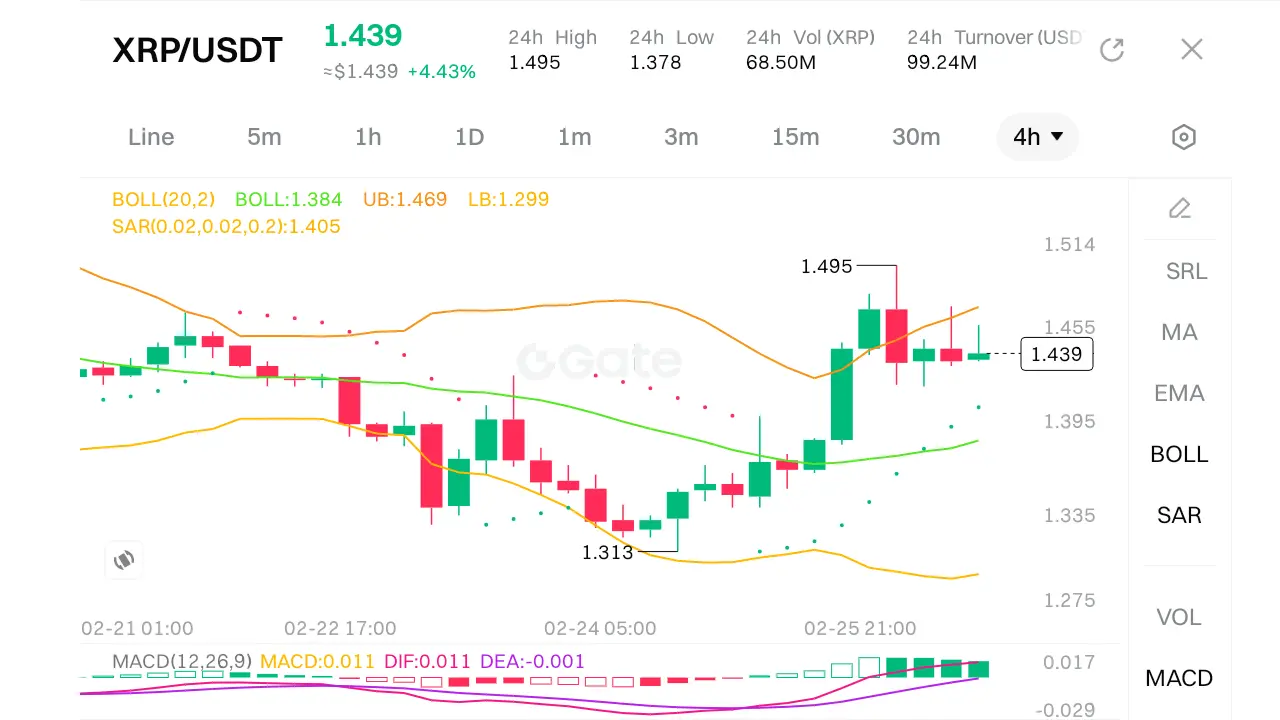
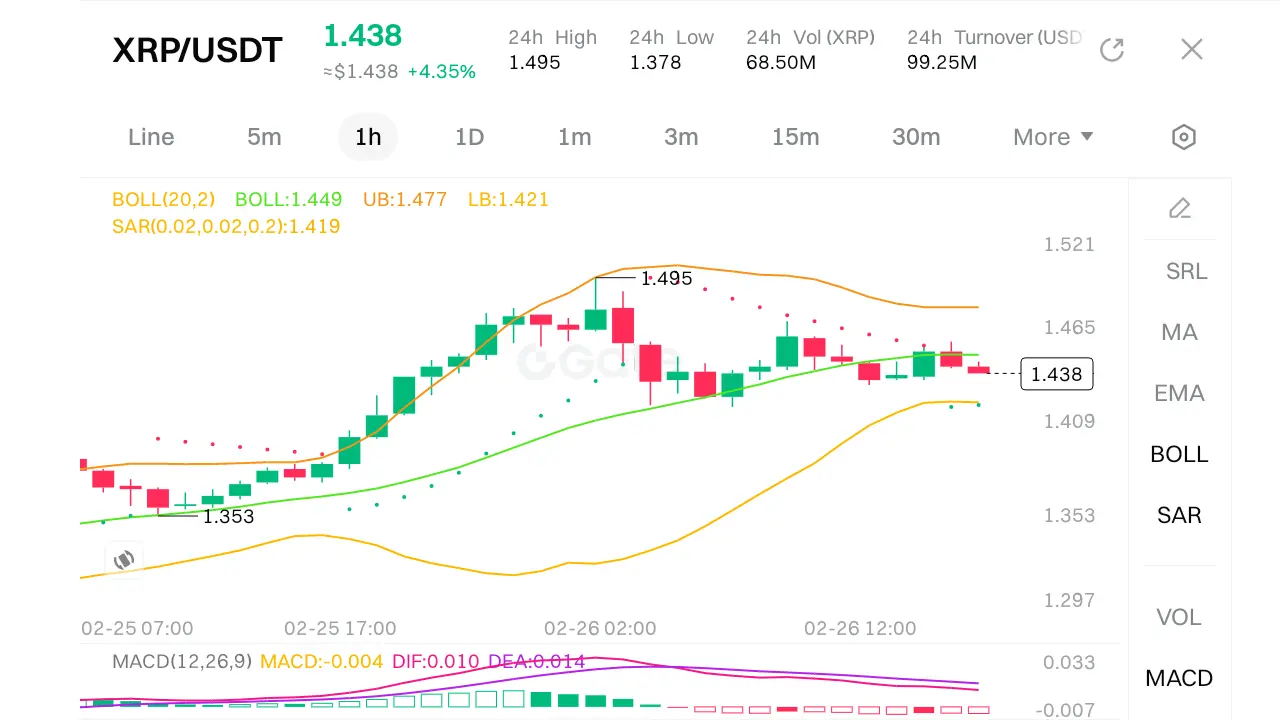
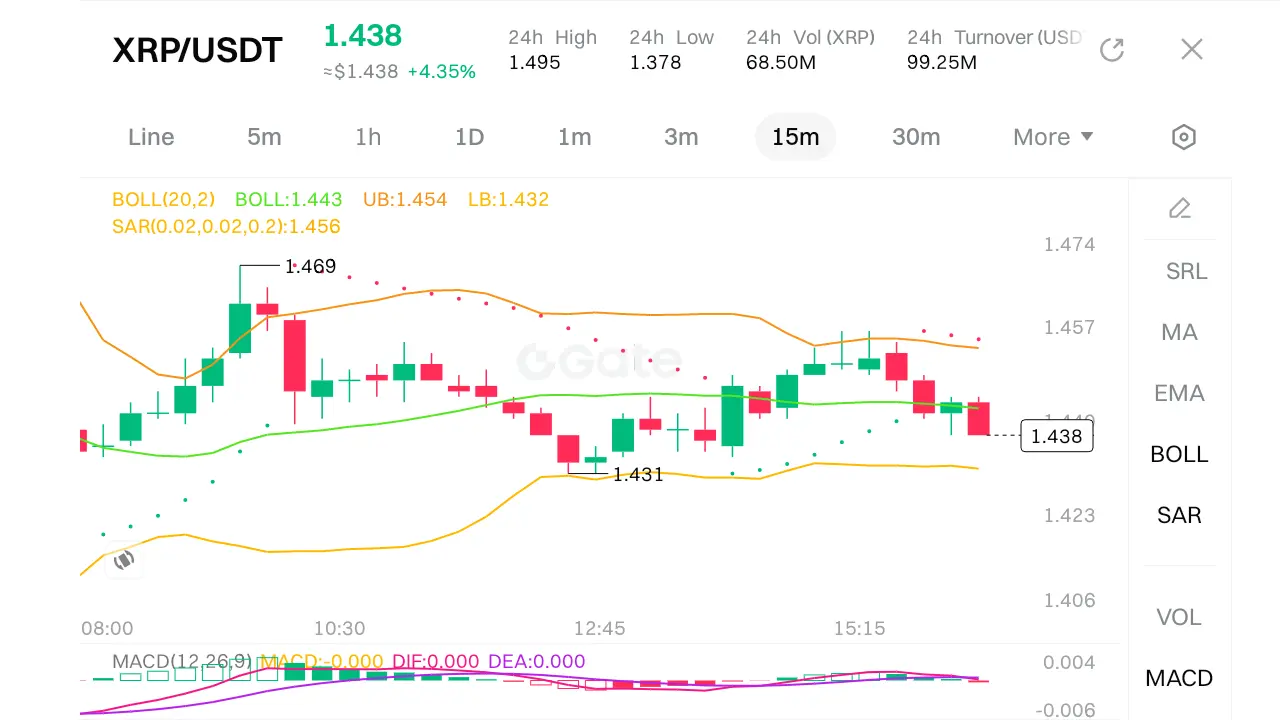
$XRP #StripeConsidersAcquiringPayPalAssets
Here is a professional technical analysis breakdown.
1. The Macro View: 4-Hour Chart (Direction)
Primary Indicators: Bollinger Bands (BOLL), Parabolic SAR (SAR)
· Current Structure: The price is currently trading at $1.439**. It is attempting to recover from a low of **$1.378.
· Bollinger Band Analysis: The price is trading above the middle band (BOLL: $1.384)** but facing immediate resistance at the Upper Band (UB: **$1.469). The bands are relatively wide, indicating high volatility.
· Key Levels:
· Resistance: $1.495 (24h High / recent swing high
XRP-3.07%
- Reward
- 3
- Comment
- Repost
- Share
$GT #CLARITYActAdvances
Here is a complete and in-depth technical analysis based on the GT/USDT chart.
1. Overview & Market Sentiment
· Current Status: GT is trading at $7.19, showing a positive daily gain of +2.86%.
· Context: It is labeled as a top-tier exchange token (Ranked #3), which often implies higher liquidity and relative stability compared to smaller altcoins.
· Intraday Range: The price is currently in the upper half of its daily range (24h Low: $6.99, High: $7.29), indicating bullish momentum throughout the session.
2. Volatility & Momentum (Bollinger Bands)
The chart utilizes Bo
GT-1.97%
- Reward
- 7
- 5
- Repost
- Share
Harrio4life:
nice one, waiting for more funds..View More
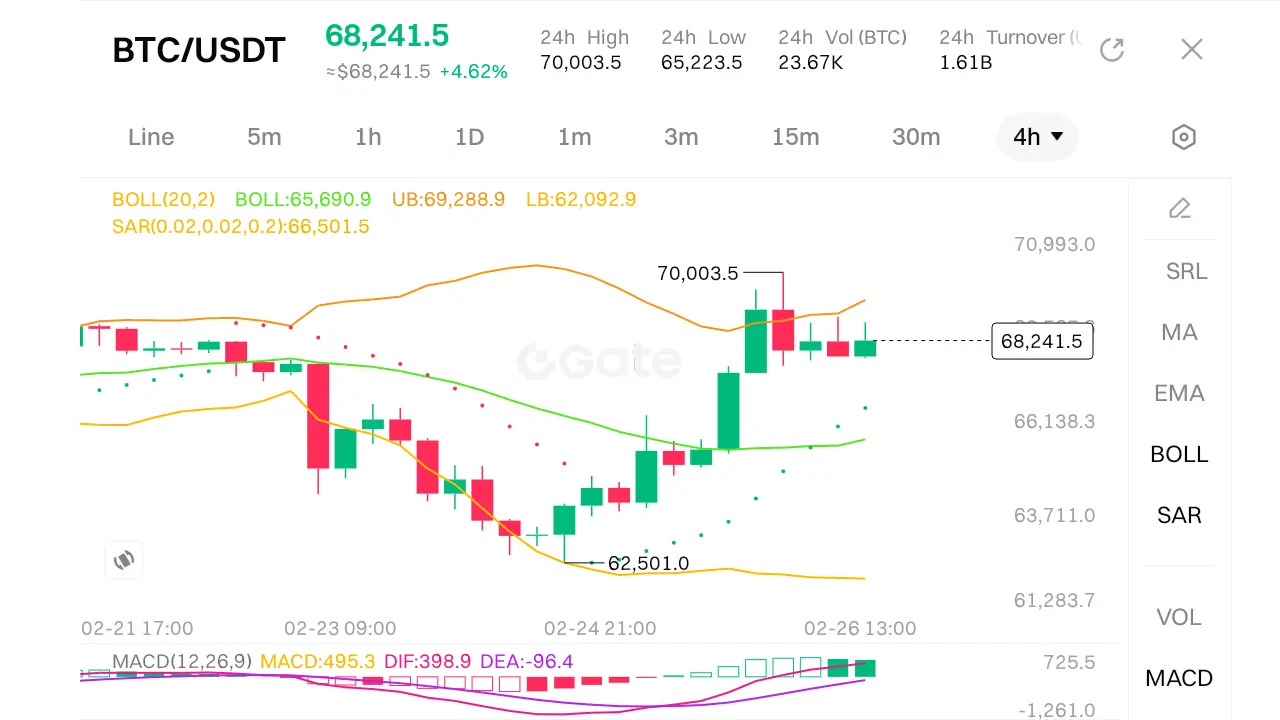
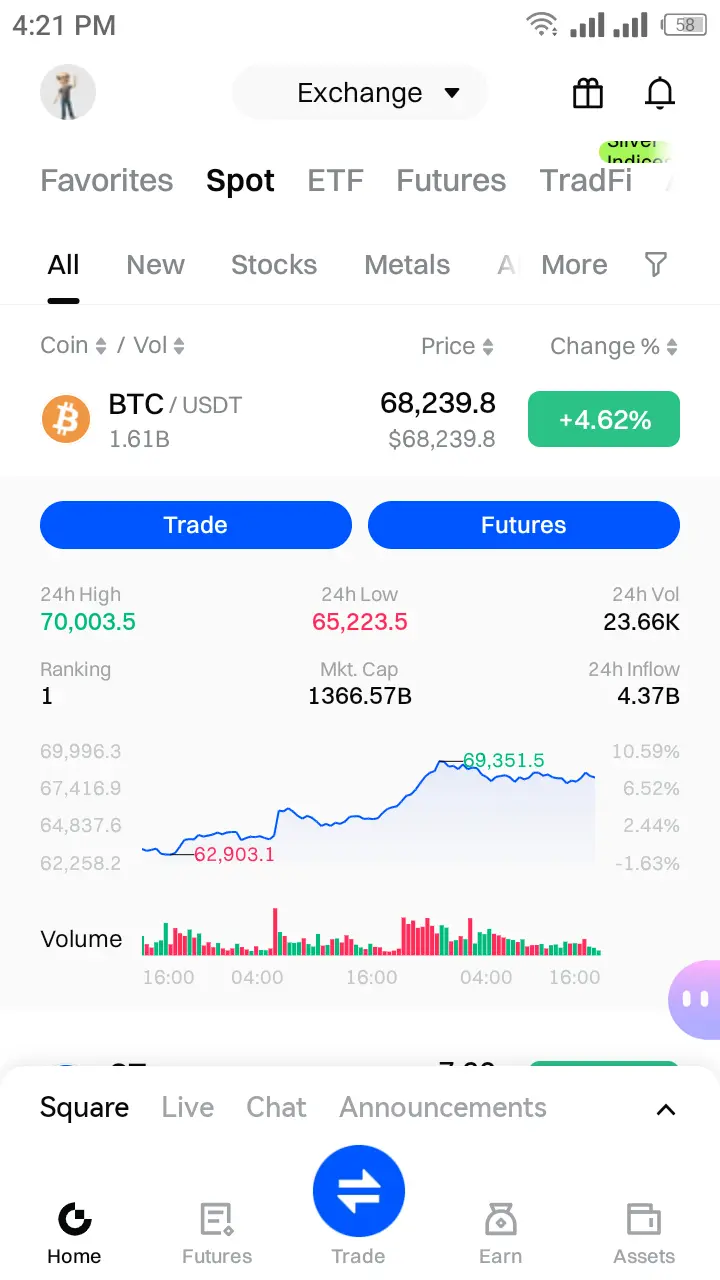
$BTC #CryptoRelatedStocksRallyBroadly
Here is a technical analysis;
1. Market Context
· Current Price: $68,241.5 (+4.62%).
· 24h Range: High of $70,003.5 and Low of $65,223.5, indicating high intraday volatility.
· Volume: 24h Volume (BTC) is 23.67K, with Turnover at $1.61B, suggesting strong market participation.
2. Bollinger Bands (BOLL)
· Upper Band (UB): $69,288.9
· Middle Band (BOLL): $65,690.9
· Lower Band (LB): $62,092.9
· Analysis: The current price ($68,241.5) is trading well above the middle band and is approaching the upper band. This suggests bullish momentum. If the price breaks
BTC-2.54%
- Reward
- 3
- Comment
- Repost
- Share
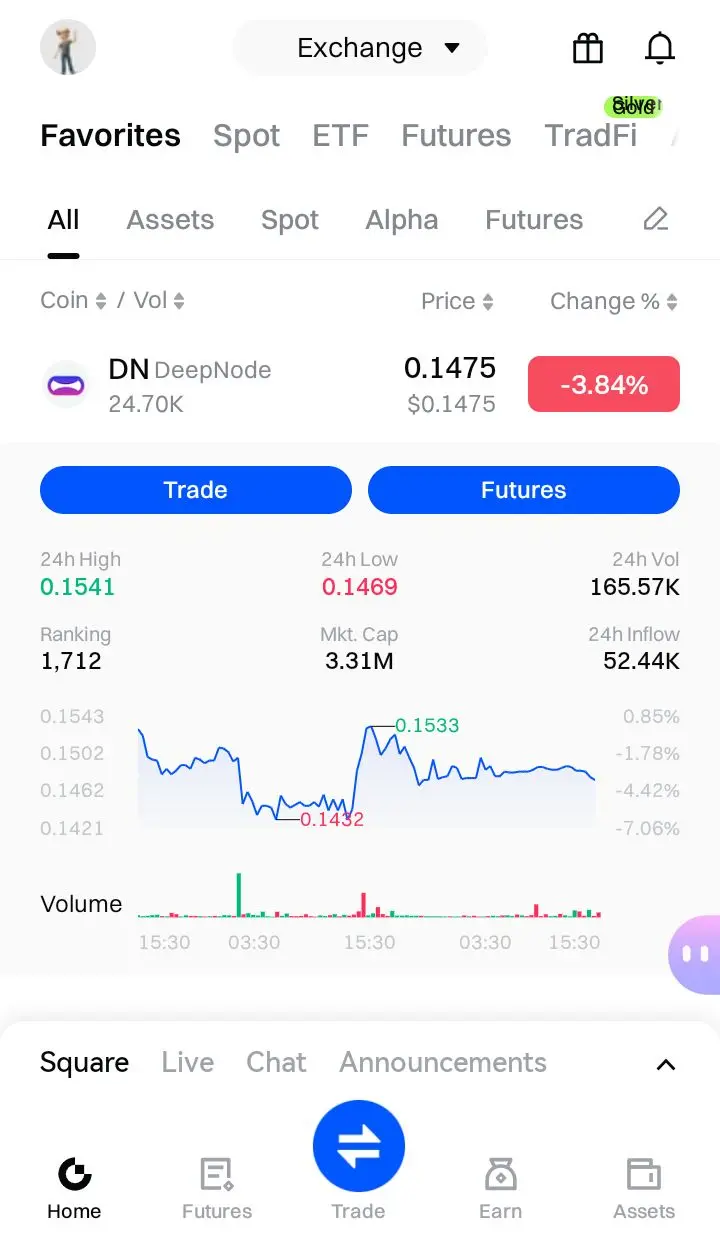
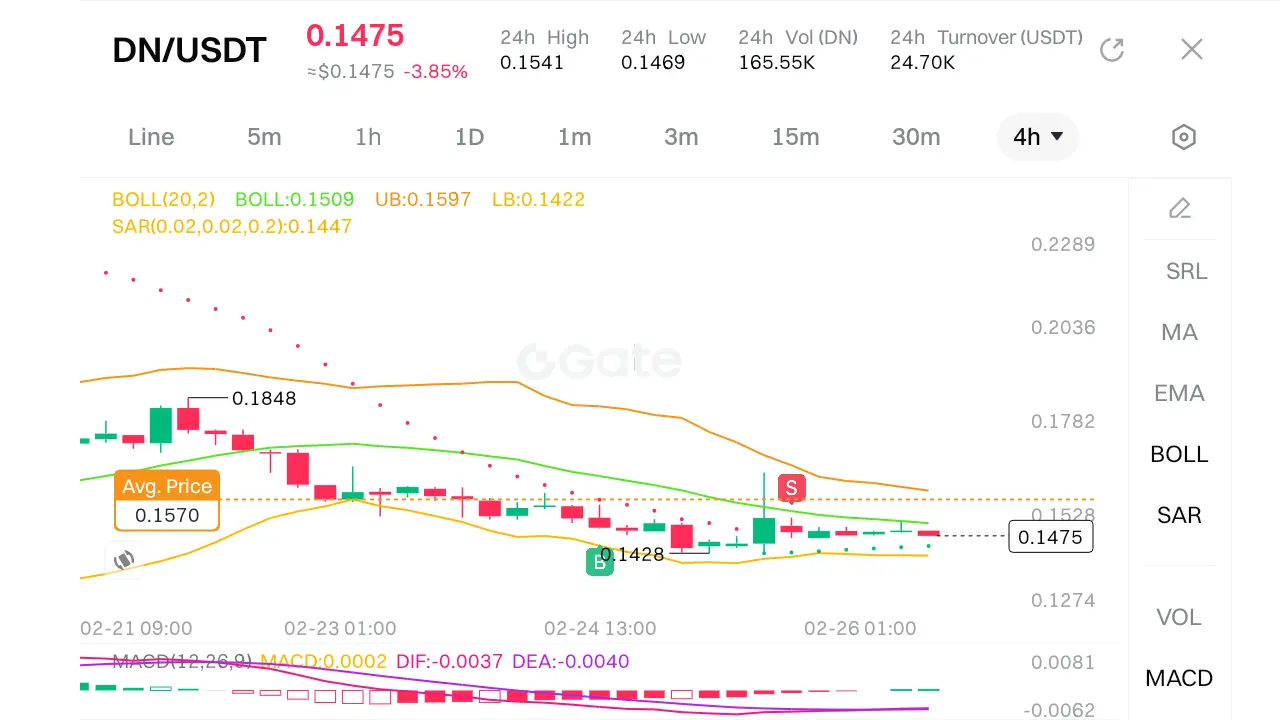
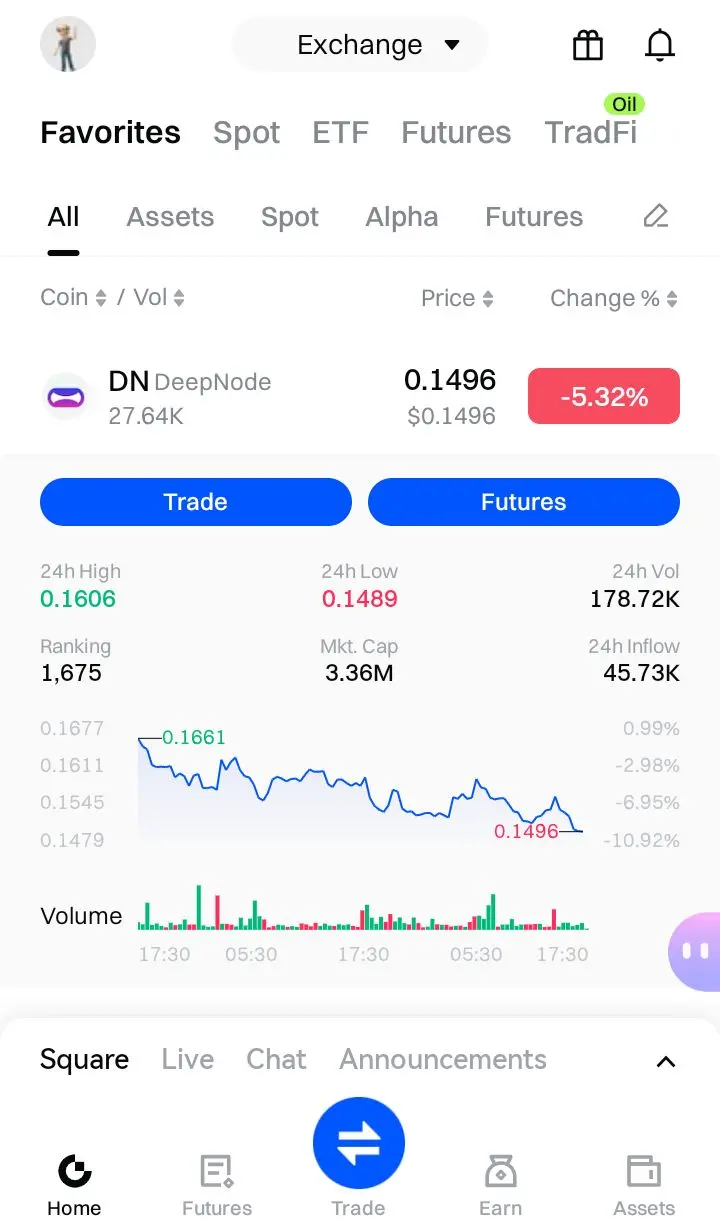
#DeepCreationCamp $DN
Here is the DN/USDT market data and technical analysis;
📊 Market Overview
· Current Price: 0.1475 USDT
· 24h Change: -3.85%
· 24h High: 0.1541
· 24h Low: 0.1469
· 24h Volume (DN): 165.55K
· 24h Turnover (USDT): 24.70K
· Market Cap: 3.31M USDT
· 24h Inflow: 52.44K USDT
📈 Technical Indicators
Bollinger Bands (BOLL, 20, 2)
· Middle Band (BOLL): 0.1509
· Upper Band (UB): 0.1597
· Lower Band (LB): 0.1422
· Current price (0.1475) is between the middle and lower bands, indicating bearish momentum but not yet oversold.
Parabolic SAR
· SAR Value: 0.1447
· Price is currently abo
DN-1.86%
- Reward
- 1
- Comment
- Repost
- Share
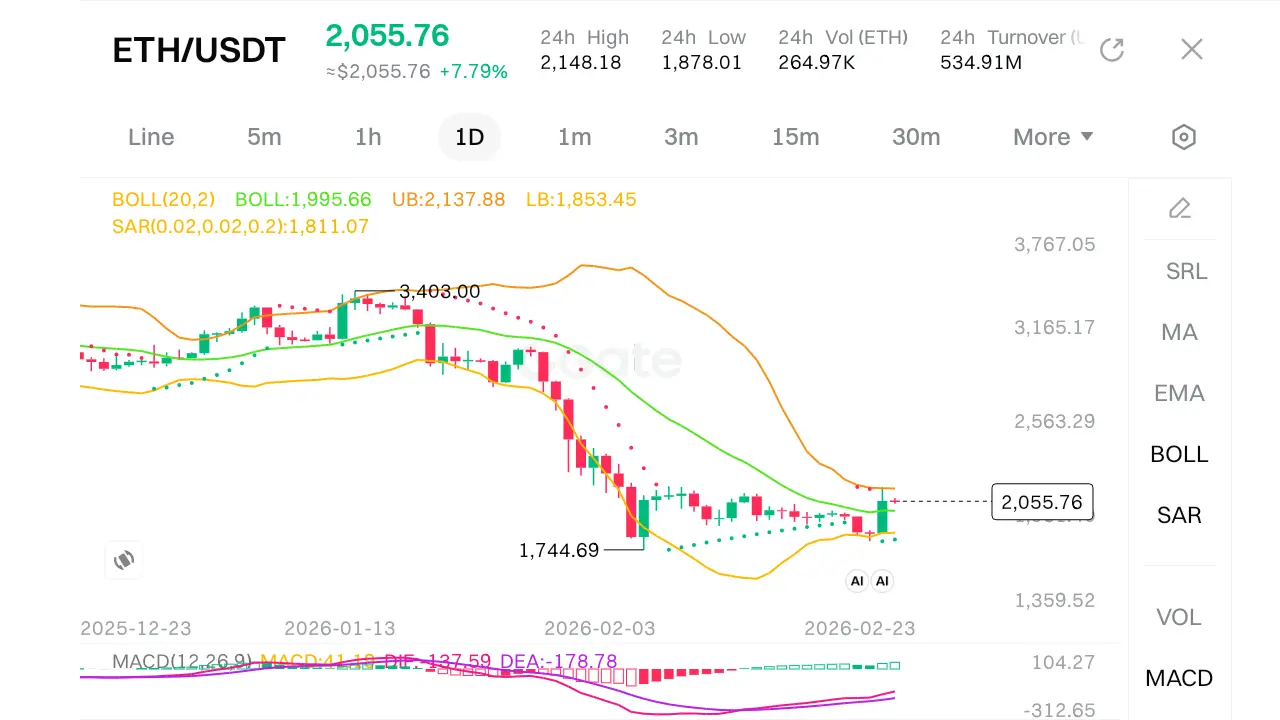
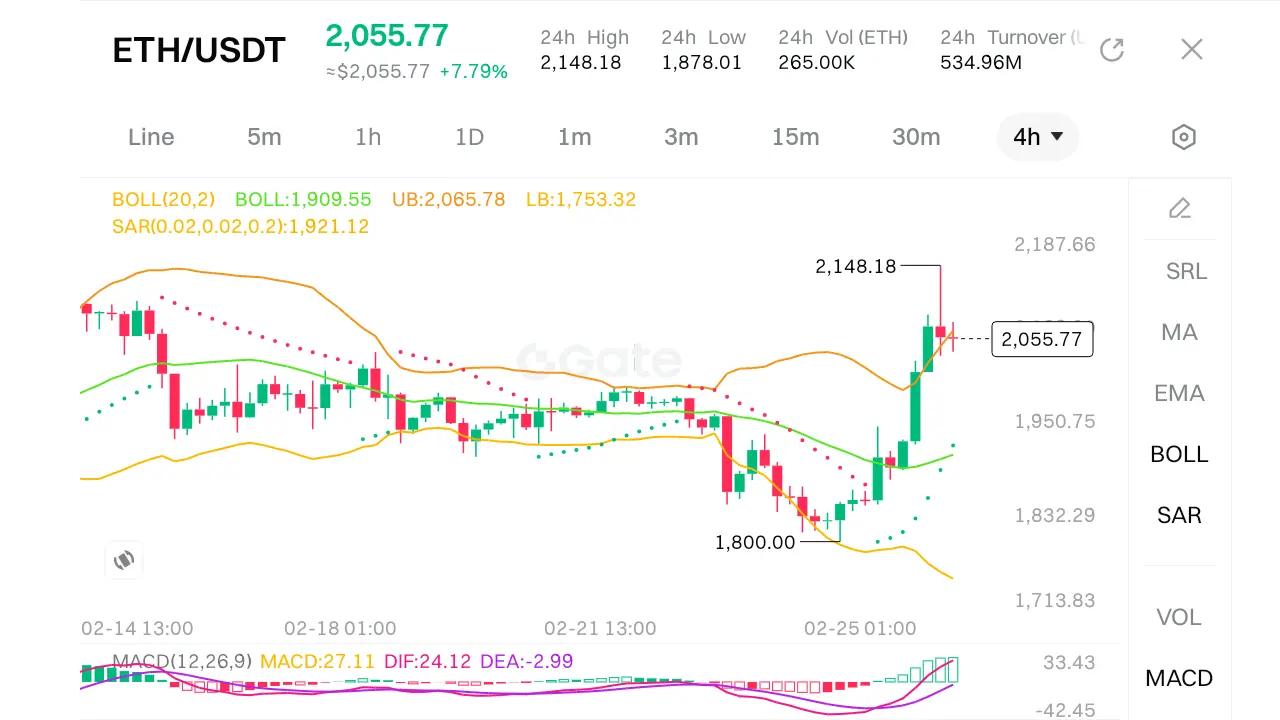
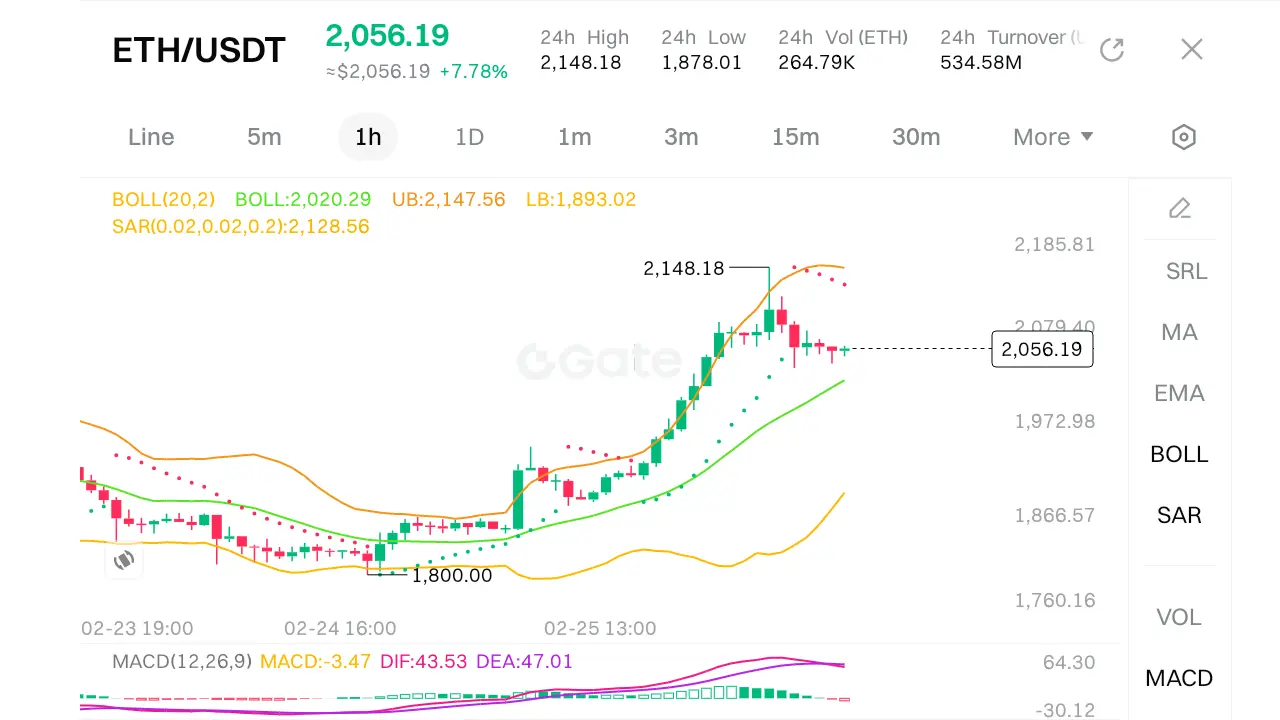
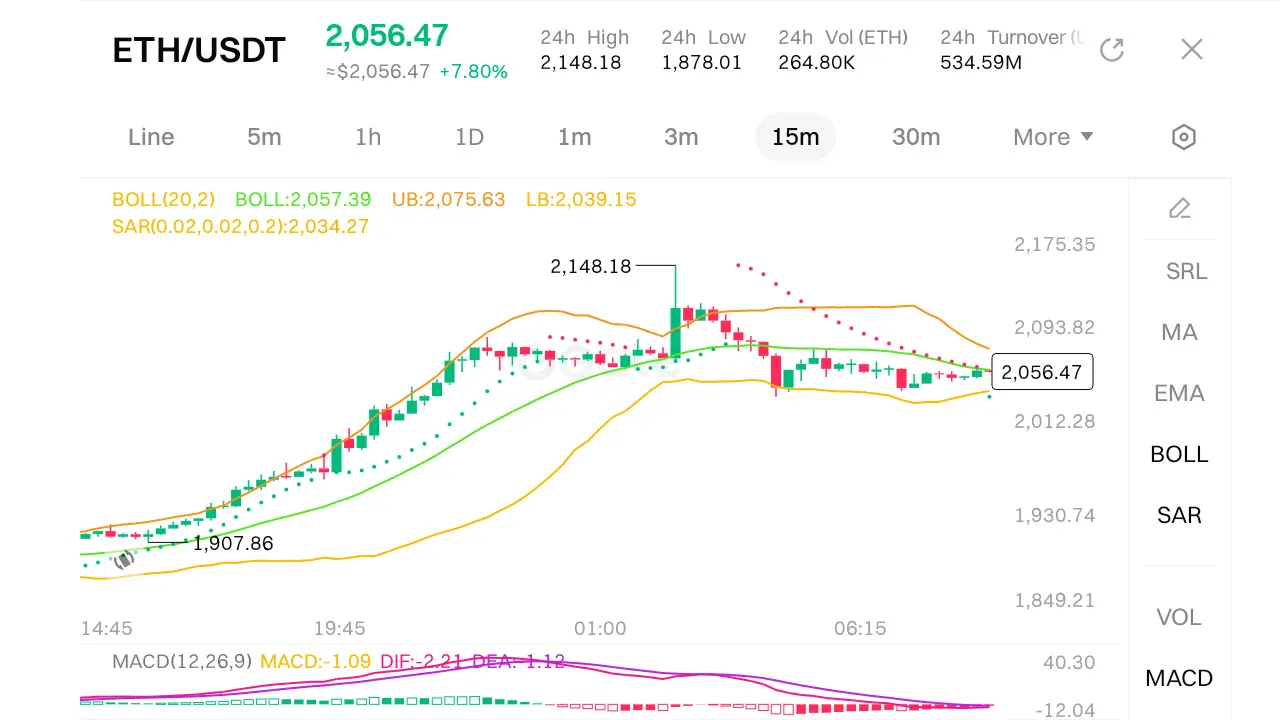
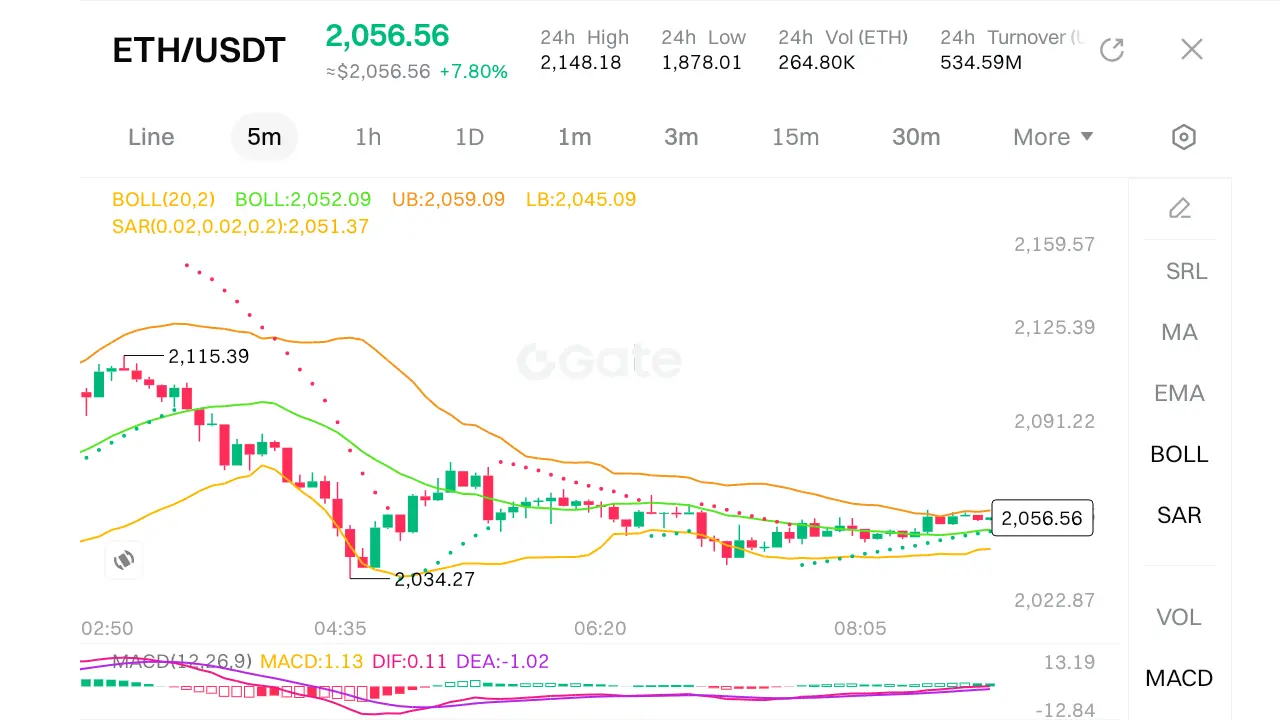
$ETH #ETHLongShortBattle
📊 Complete Silver Bullet Strategy Analysis - ETH/USDT
🎯 Strategy Framework Recap
The Silver Bullet strategy combines:
· Daily timeframe for key levels (PDH/PDL)
· 5-minute timeframe for execution
· Liquidity sweeps + Market Structure Shift (MSS)
· PD Arrays for entry zones
📈 Daily Timeframe Analysis
Key Levels Identified:
Previous Day High (PDH): $2,148.18 ✓
Previous Day Low (PDL): $1,878.01 ✓
Current Price: $2,055.76
Daily Bollinger Bands (20,2):
Upper Band (UB): $2,137.88 (Resistance)
Middle (BOLL): $1,995.66
Lower Band (LB): $1,853.45 (Support)
SAR:
ETH-4.98%
- Reward
- 4
- 1
- Repost
- Share
EqunixHub:
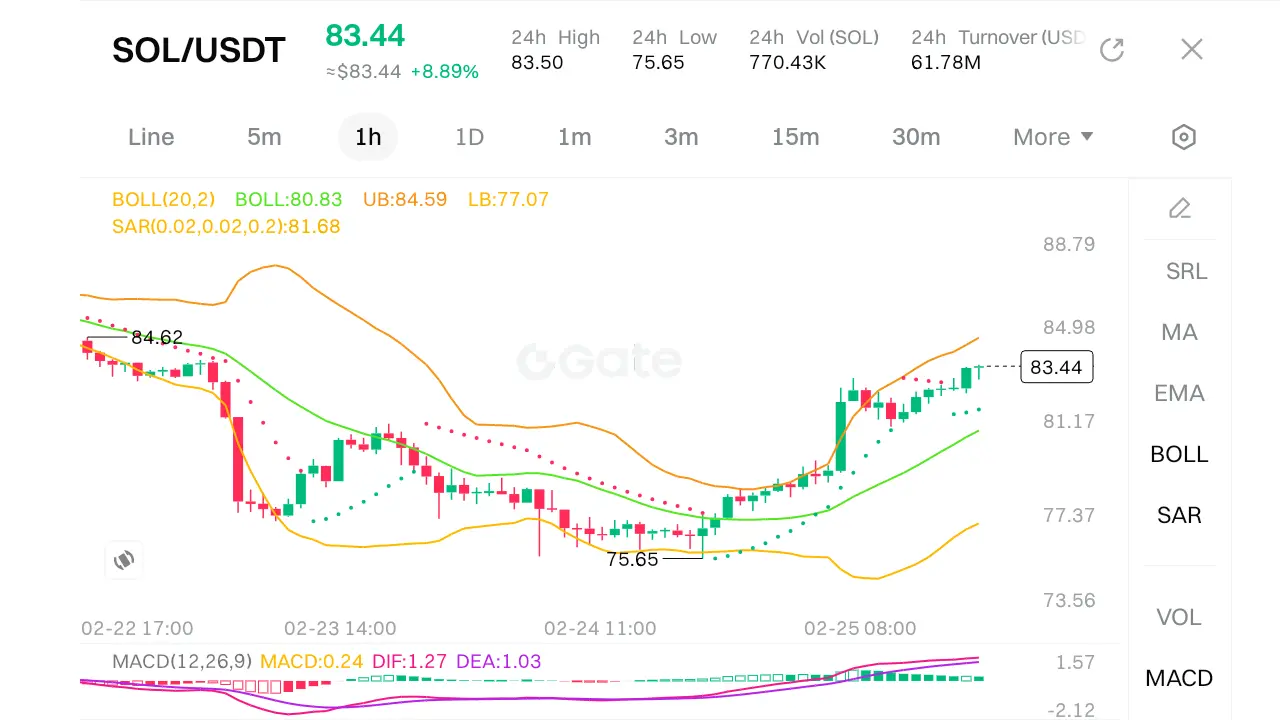
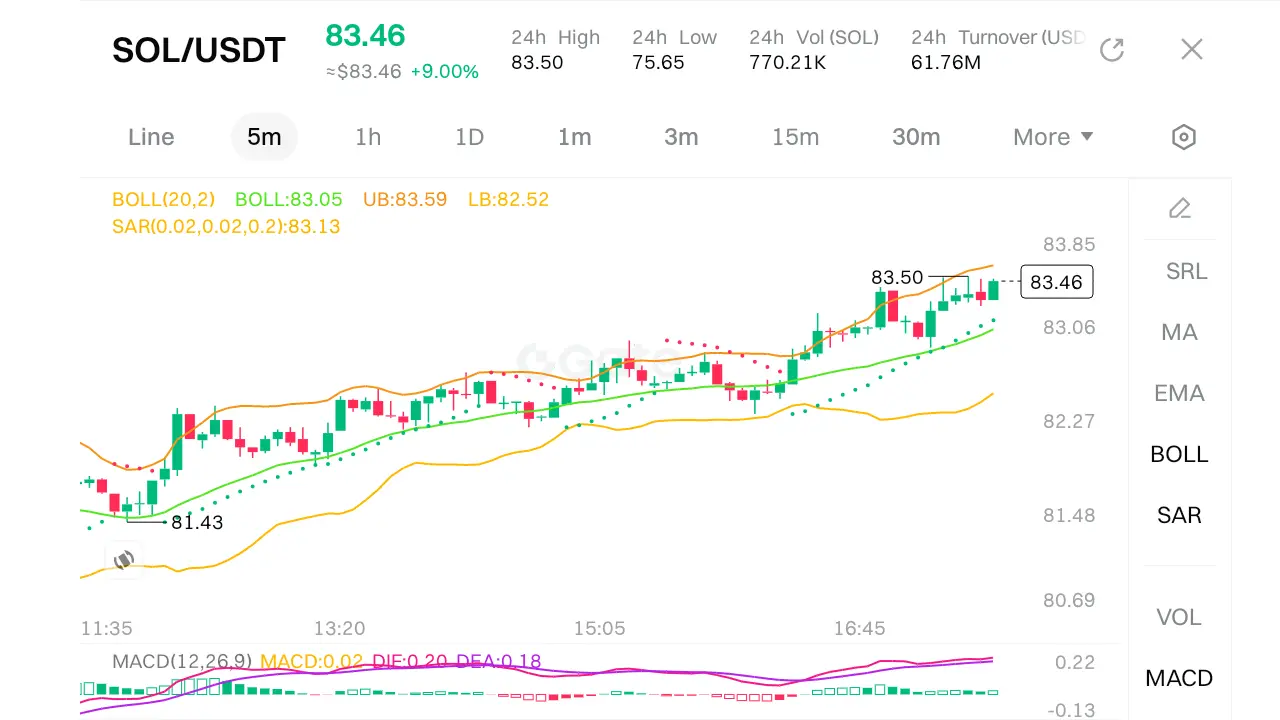
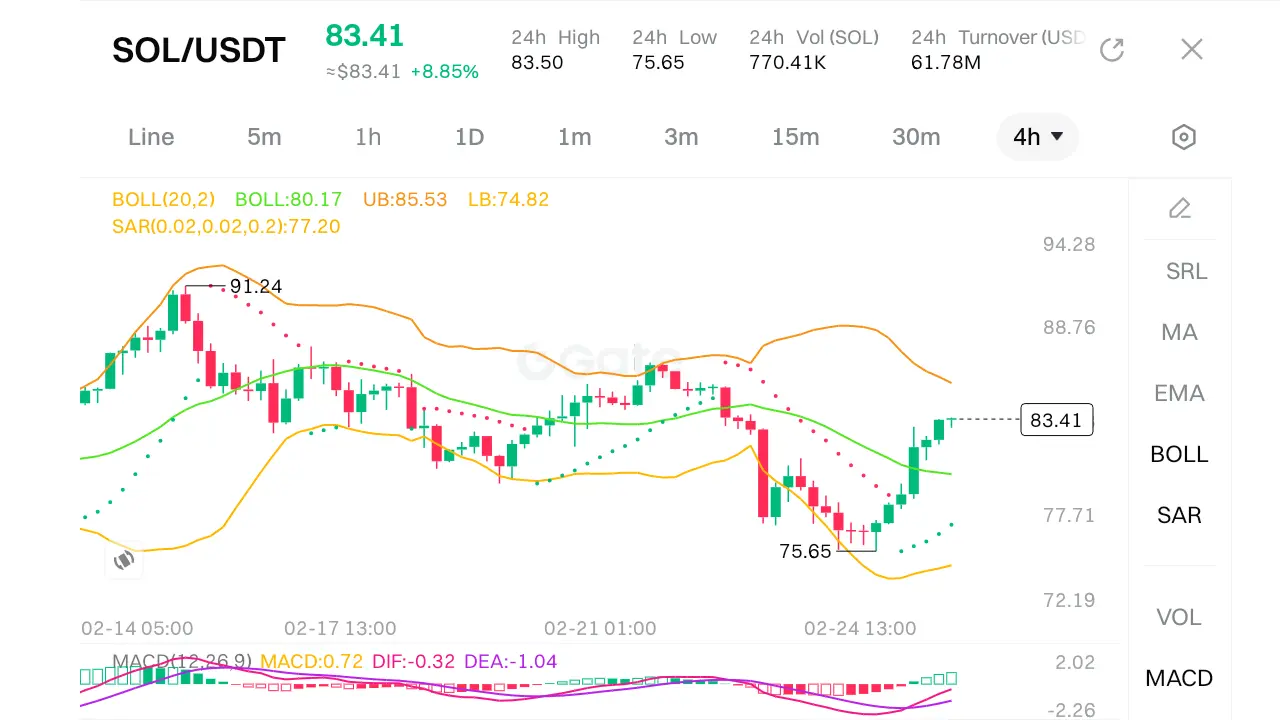
amazing detailed articke$SOL #LatestMarketInsights
Here’s a structured SOL/USDT, aligned with the key concepts you mentioned: 4H direction/key levels, 1H trend break, reversal, OB, FVG, ChoCh, liquidity, and 15M confirmation for entry;
🕯️ 4H Timeframe – Direction & Key Levels (Supply & Demand)
Trend Context:
· The asset is in a strong recovery phase after a low of 75.65.
· Price is currently trading near 83.41–83.46, just below the 24h high of 83.50.
· On the 4H chart (last screenshot), price broke above previous structure and is now approaching a supply zone near 85.53–88.76.
Key Levels:
· Demand Zone: ~75.65 – 77
SOL-5.17%
- Reward
- 2
- Comment
- Repost
- Share
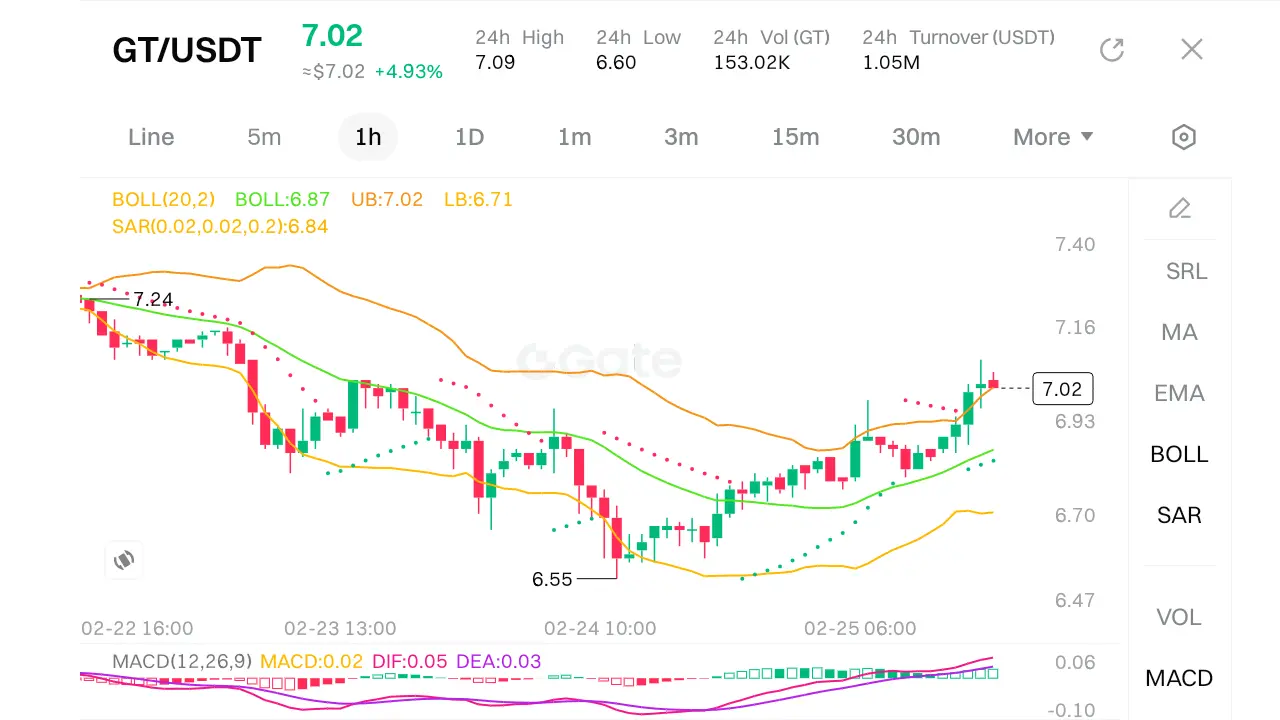
$GT #TrumpAnnouncesNewTariffs
Based on strategy (1H IRL/ERL, 5M FVG),
Here is a breakdown of the current situation for GT/USDT:
🔍 Current Market Context (1H Analysis)
· Price Action: The price is currently at $7.02.
· Trend: On the 1D chart (visible in the second screenshot), the market is in a strong uptrend, recently spiking to $7.40 before pulling back.
· 1H Structure (IRL/ERL):
· The 1H chart shows price recently broke below a key structure (likely an ERL break) and is now trading inside a range.
· The Bollinger Bands on the 1H are wide, indicating volatility. Price is hovering near
GT-1.97%
- Reward
- 3
- Comment
- Repost
- Share
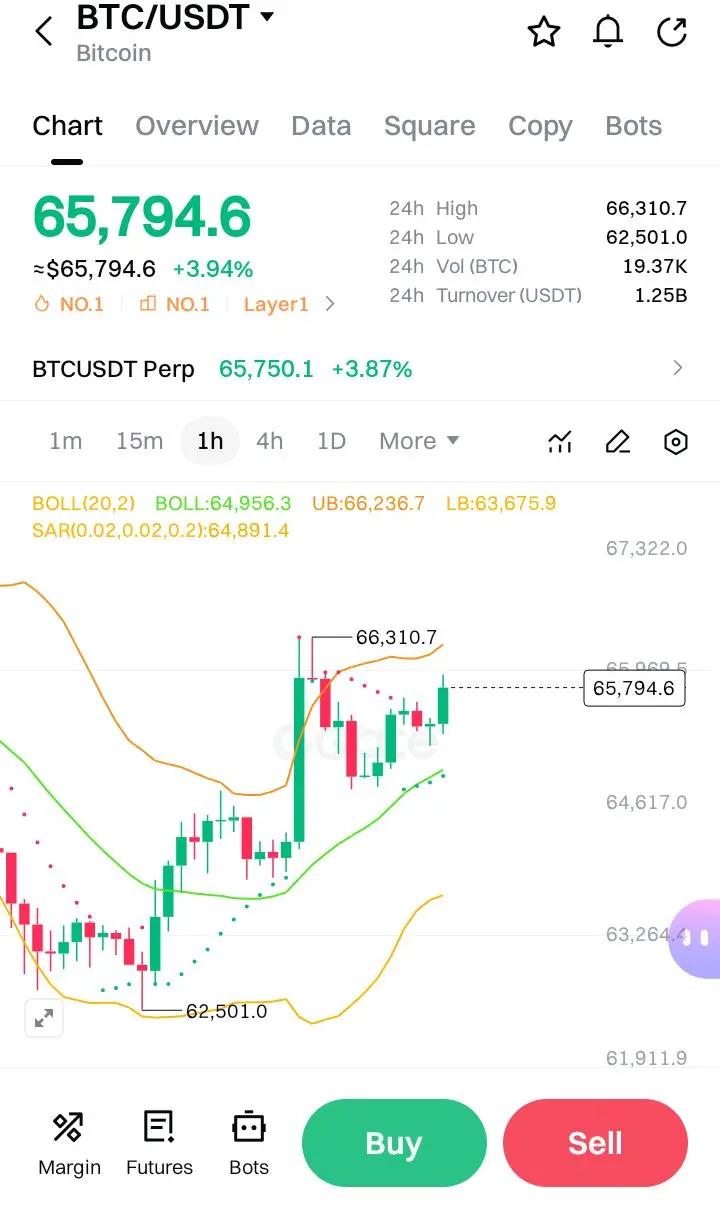
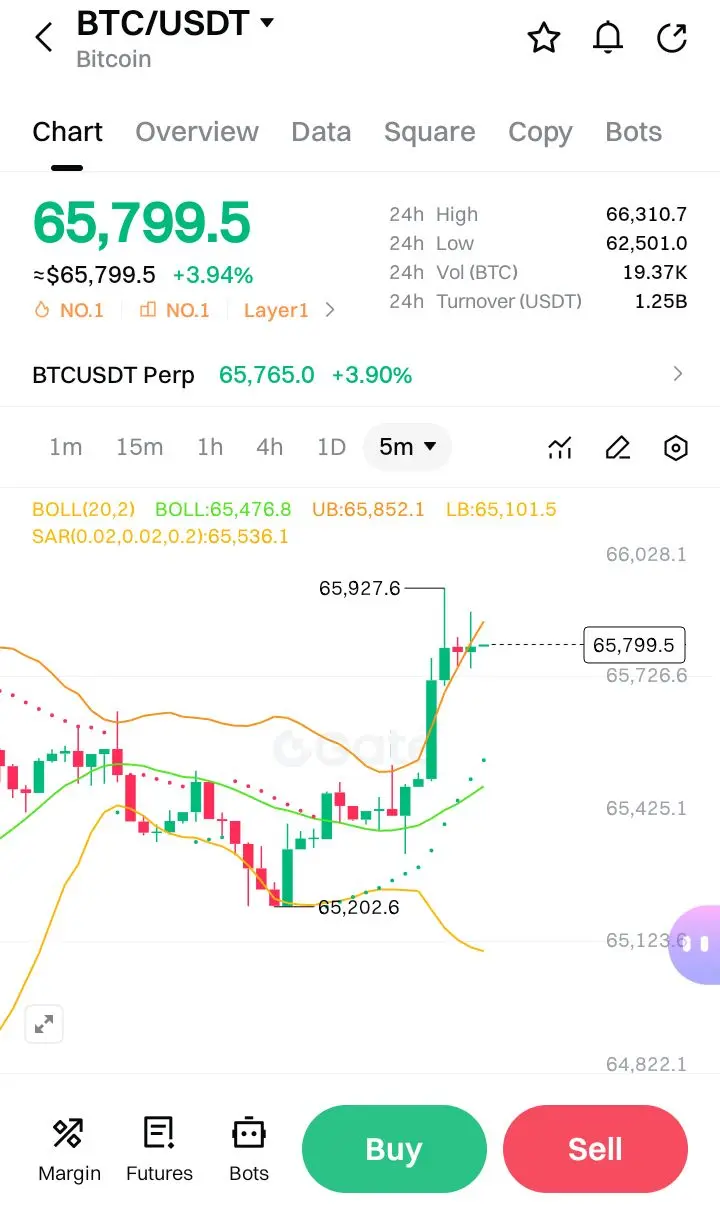
$BTC #BitcoinBouncesBack
Let me break down how played out in this trade:
SMC Model in Action
✔ Liquidity Sweep - Price swept below the 24h low of 62,501.0, grabbing stops before reversing
✔ Market Structure Shift - After the sweep, price broke above the previous structure, confirming the shift from bearish to bullish
✔ Fair Value Gap (FVG) - The first screenshot shows a clear imbalance around 63,675.9 - 64,956.3 (LB to BOLL)
✔ FVG Entry Zone - Second screenshot shows price returning to the FVG area (65,101.5 - 65,476.8) for the perfect retest
✔ Stop Placement - Logically placed below the FVG
BTC-2.54%
- Reward
- 3
- Comment
- Repost
- Share
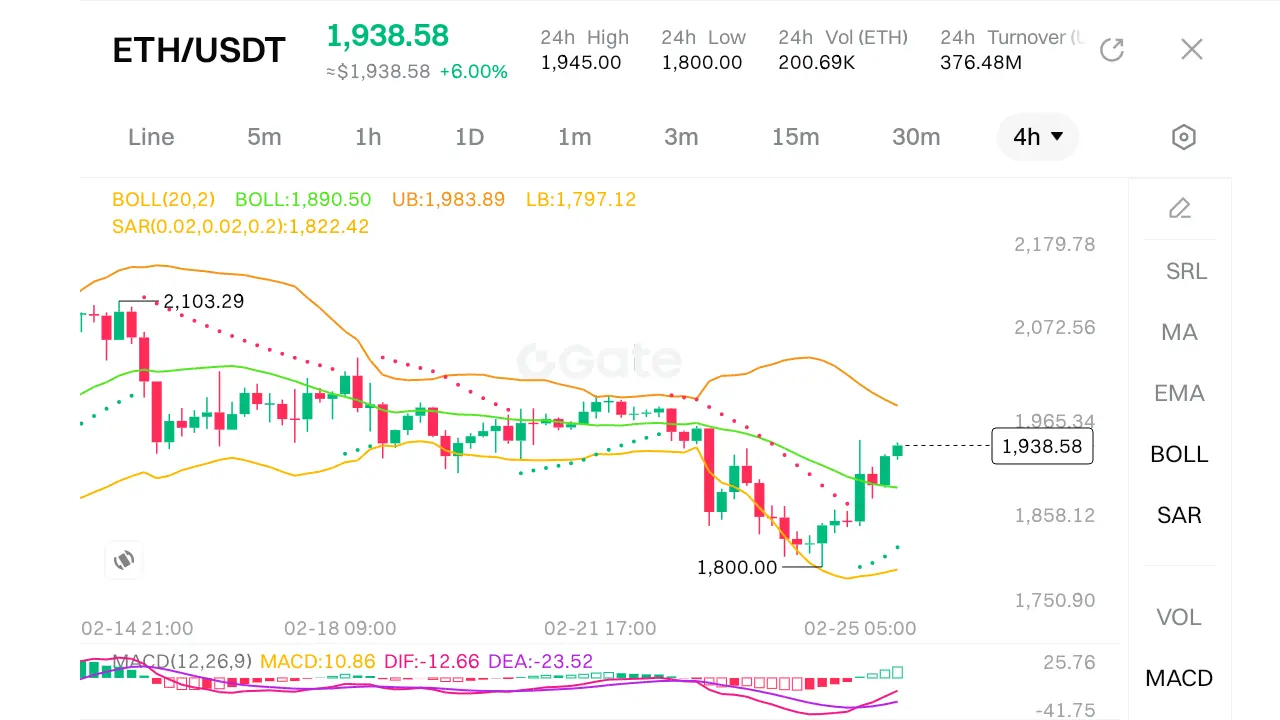
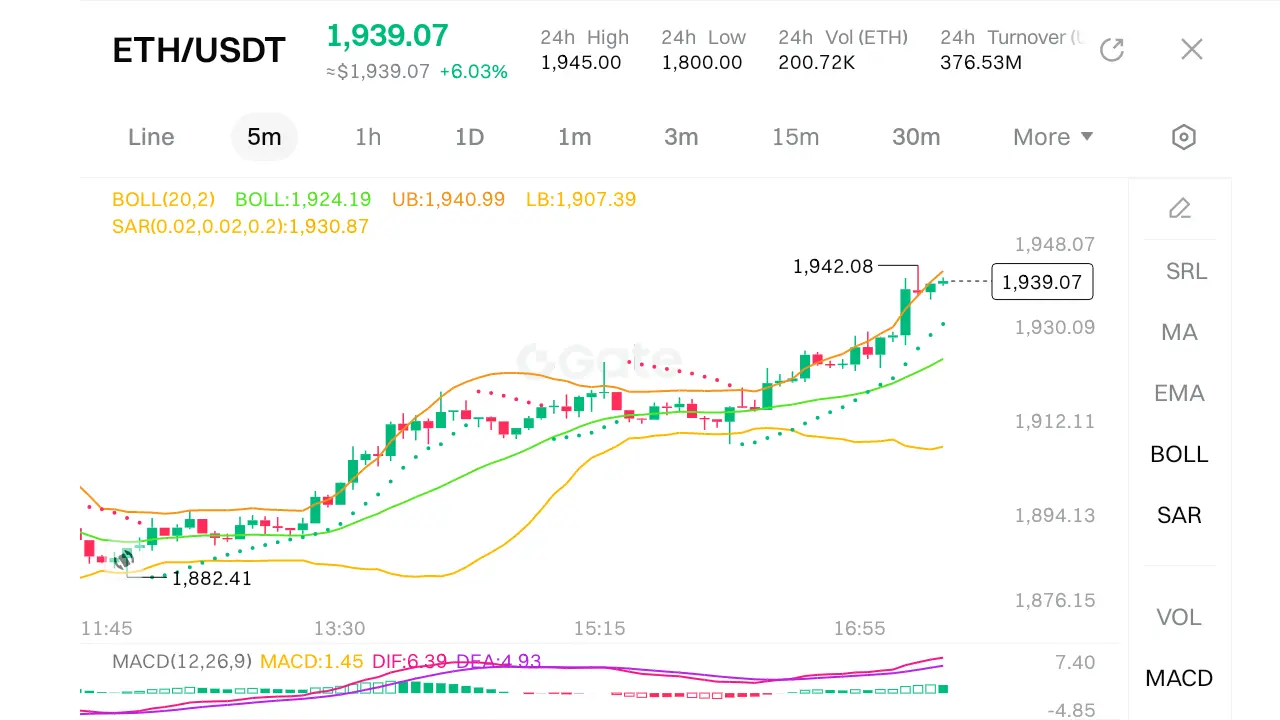
$ETH #ETHLongShortBattle
1. 4-Hour Chart: The Direction
The 4H chart provides the macro view. We are looking for the trend and key structural levels.
· Current Price: 1,938.58
· Trend Definition: Bullish Momentum.
· Price is trading significantly above the 4H Bollinger Bands (BOLL) mid-line (1,890.50).
· The MACD shows a strong bullish setup. While the DIF (-12.66) and DEA (-23.52) are negative, they are converging sharply upward, and the histogram (MACD: 10.86) is positive and growing. This indicates momentum is shifting aggressively to the upside.
· SAR (Parabolic SAR): 1,822.42. Pric
ETH-4.98%
- Reward
- 4
- 1
- Repost
- Share
ybaser :
:
To The Moon 🌕
- Reward
- 2
- 1
- Repost
- Share
EqunixHub:
amazing keep it grow
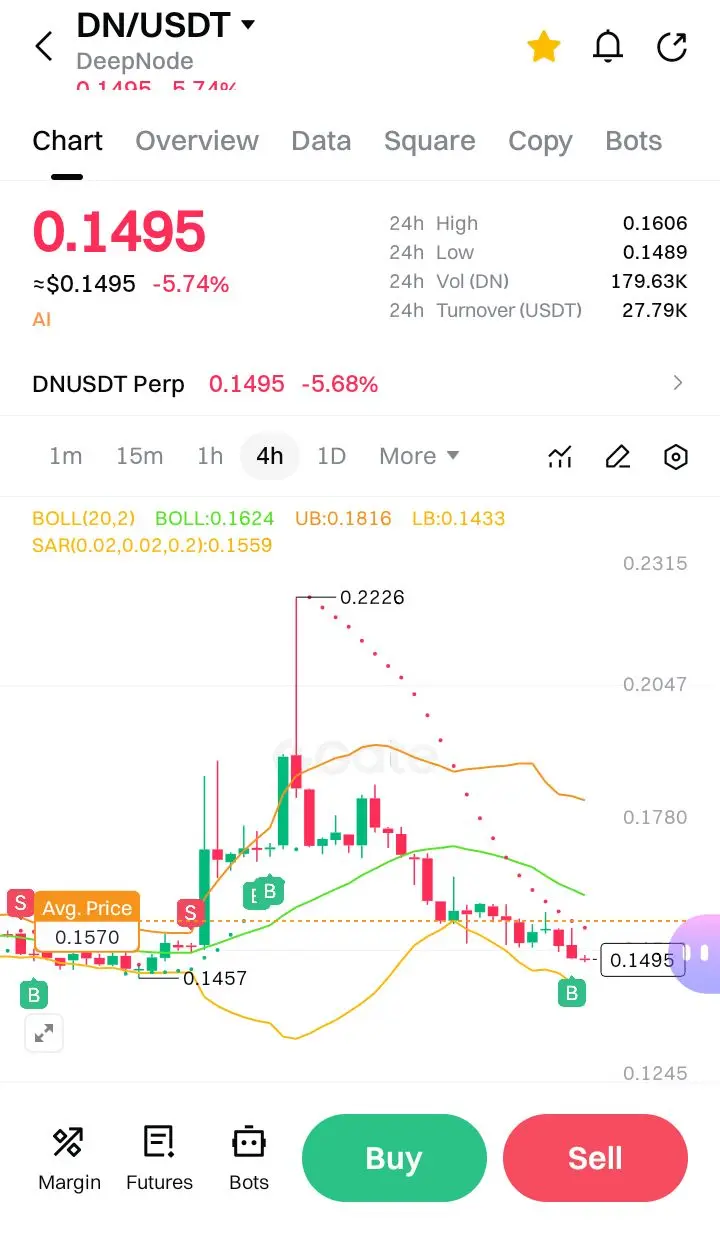
$DN #LatestMarketInsights
DN/USDT (DeepNode), Here is an in-depth technical analysis covering trend, momentum, key levels, and potential scenarios.
1. Overall Market Context
· Current Price: 0.1495 USDT
· Daily Change: -5.74% (The top banner shows 6.74%, but the main data shows a decline, indicating a recent pullback or a delay in data refresh).
· Session Context: The 24-hour range is tight (High: 0.1606 / Low: 0.1489), suggesting the asset is currently in a consolidation phase after failing to hold higher prices.
2. Indicator Analysis
A. Bollinger Bands (BOLL 20,2)
· Parameters: Middle Band
DN-1.86%
- Reward
- 3
- Comment
- Repost
- Share
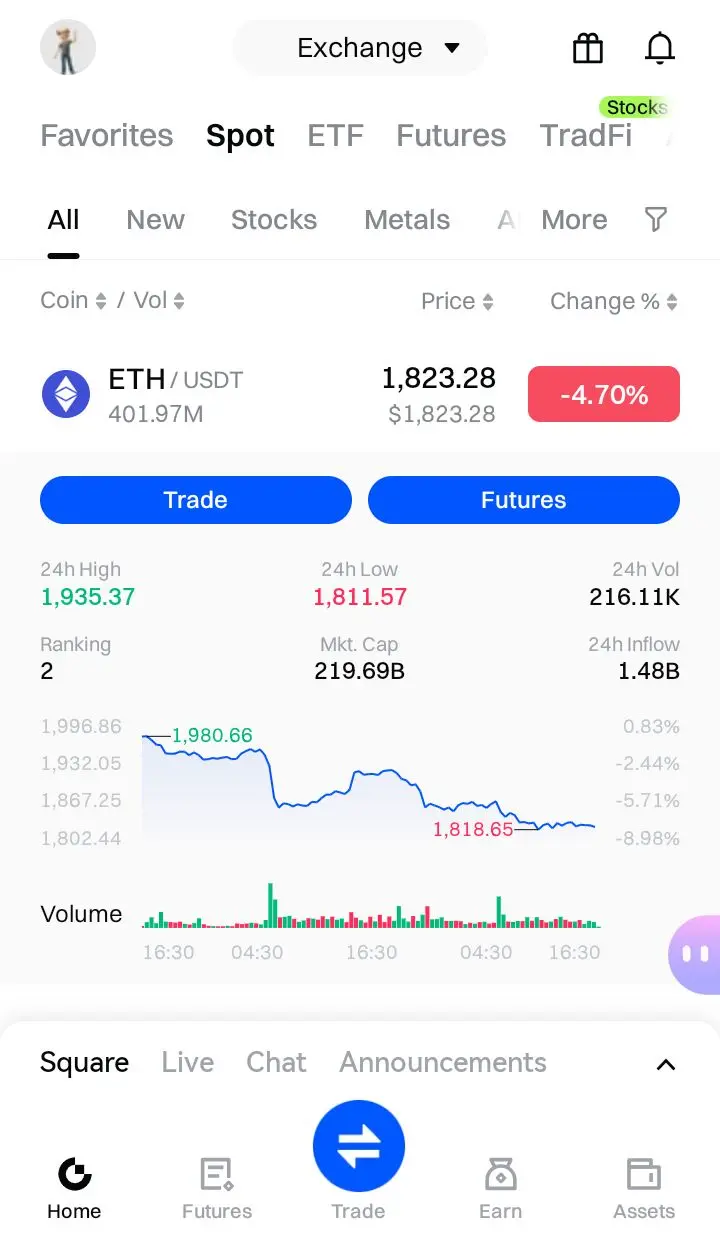
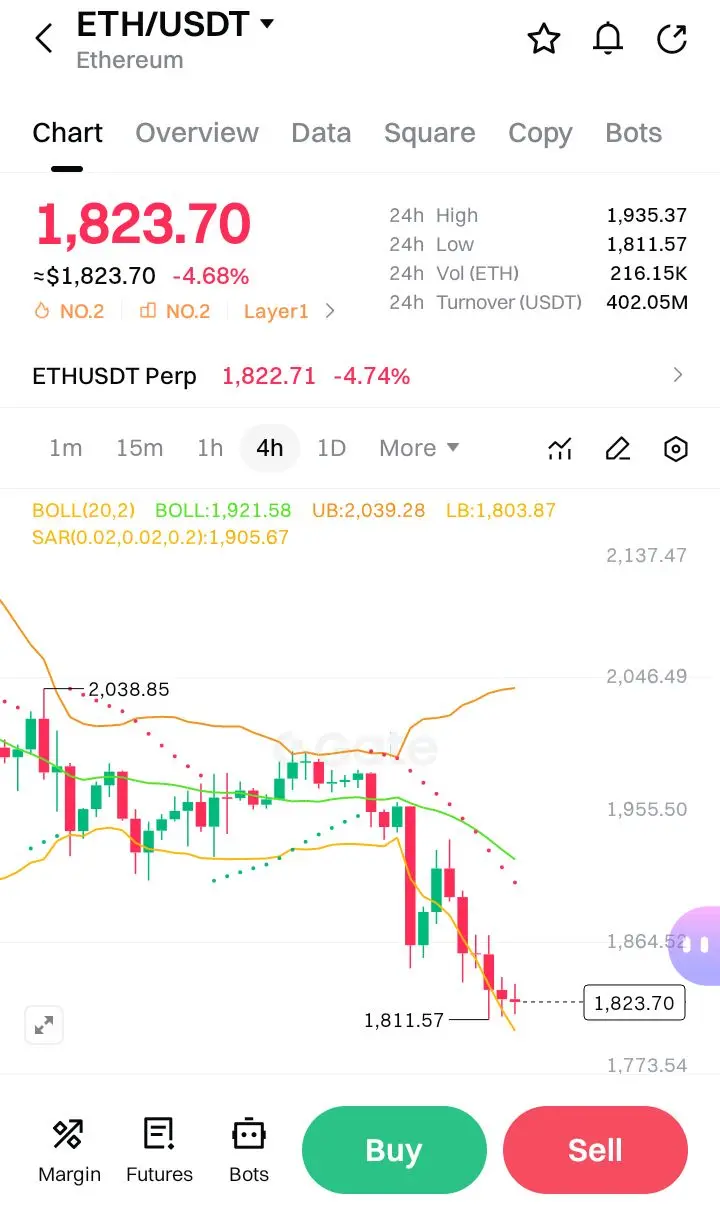
$ETH #TrumpAnnouncesNewTariffs
Here is an in-depth technical analysis based on the visible data points and indicators.
1. Current Market Snapshot
· Price: $1,823.70
· 24h Change: -4.68%
· Context: Ethereum is currently trading near the lower end of its 24-hour range ($1,811.57 – $1,935.37).
2. Key Indicators Analysis
A. Bollinger Bands (BOLL(20,2))
· Upper Band (UB): 2,039.28
· Middle Band (Base): 1,921.58 (20-period SMA)
· Lower Band (LB): 1,803.87
· Analysis:
· The price is currently testing the Lower Band (1,803.87).
· Interpretation: When price touches or breaks below the lower band,
ETH-4.98%
- Reward
- 2
- Comment
- Repost
- Share
Trending Topics
View More361.38K Popularity
22.44K Popularity
64.84K Popularity
15.94K Popularity
470.2K Popularity
Pin