How to Use the Top Reversal Pattern—Double Top (M-Shape)
Gate Learn's intermediate futures series helps users build a structured framework for technical analysis, covering candlestick basics, chart patterns, moving averages and trendlines, as well as technical indicators. In this article, we focus on the top reversal pattern—Double Top, covering its definition, features, application in BTC markets, and key considerations.
What Is a Double Top
When the price rises to a certain level with increasing volume but momentum stalls, it pulls back with decreasing volume. A second rally then follows, with rising volume, but this volume still fails to exceed that of the first peak. When the price reaches nearly the same high as before and declines again—this time breaking below the previous low—a Double Top pattern is formed.
Visually, the price forms two peaks, hence the name Double Top. Because the shape resembles the capital letter “M”, it is also known as an M-Top, as shown below:
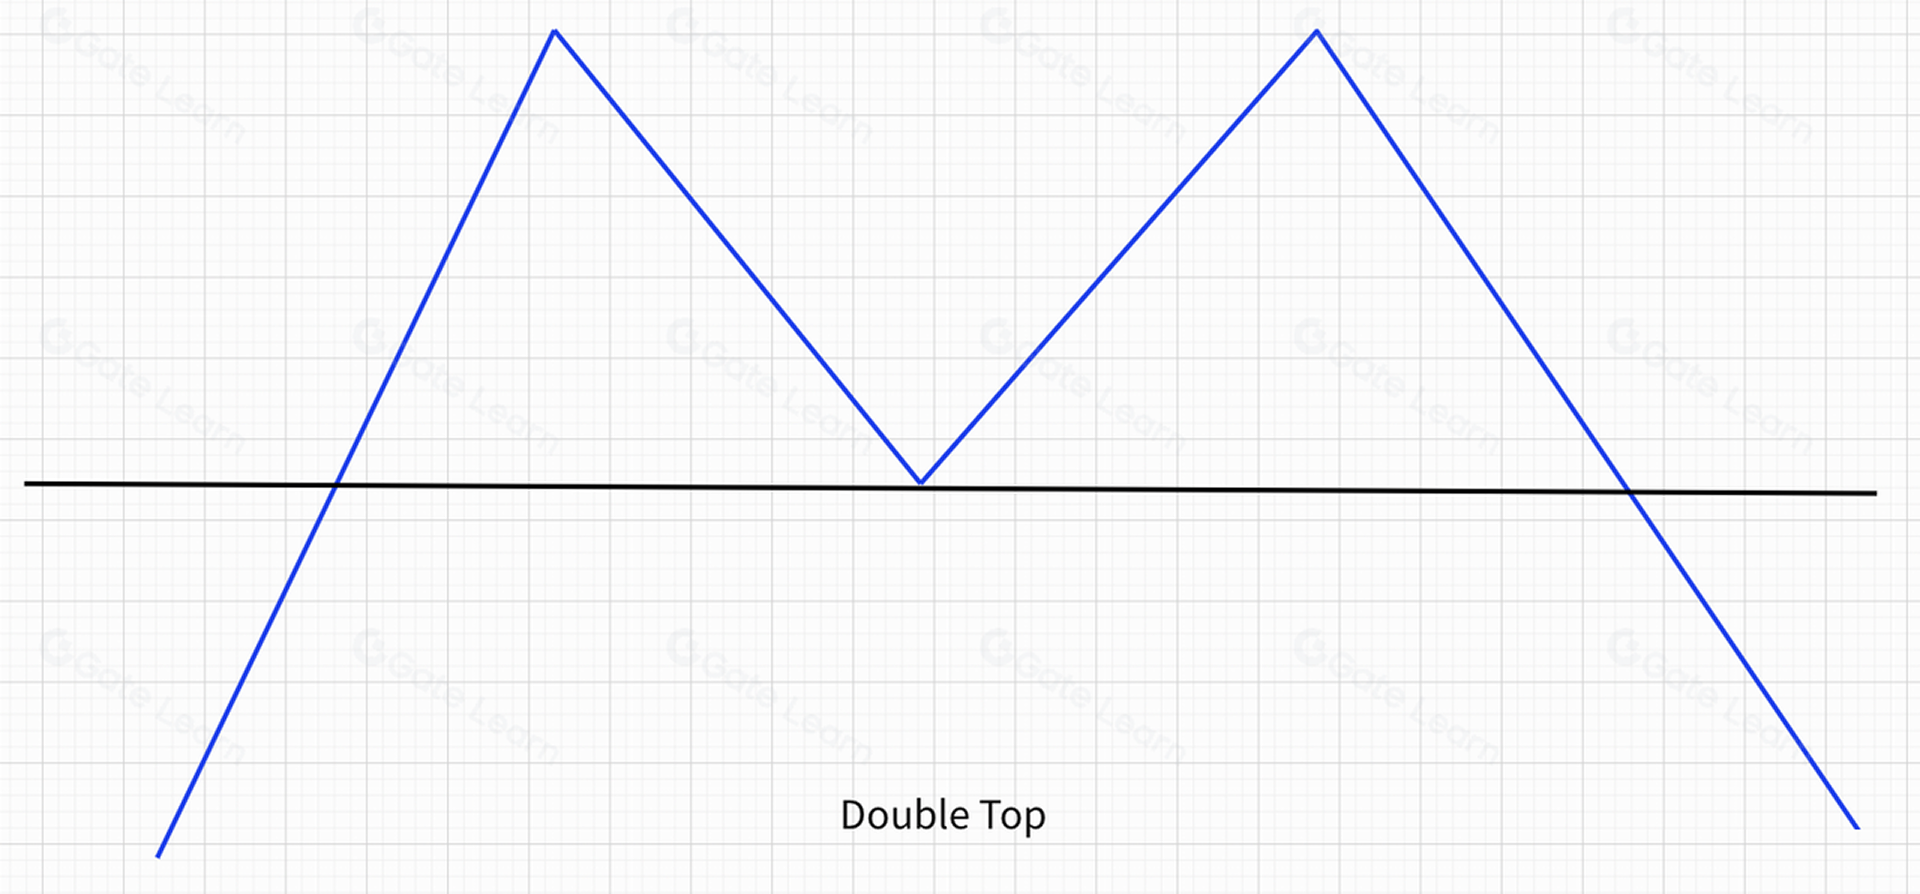
A neckline is drawn through the lowest point between the two peaks. This neckline serves as an important reference for identifying trade signals.
How to Identify a Double Top
- Appears in an uptrend;
- The two highs are at roughly the same level, or the right high is slightly lower.
- In most cases, the volume on the right peak is lower than that of the left.
- The neckline generally aligns with the low between the two peaks; sometimes it may slope slightly.
Technical Implications of a Double Top
A Double Top is a trend reversal pattern. Once the price falls to the neckline, it typically generates a reliable sell signal.
Applications of the Double Top Pattern
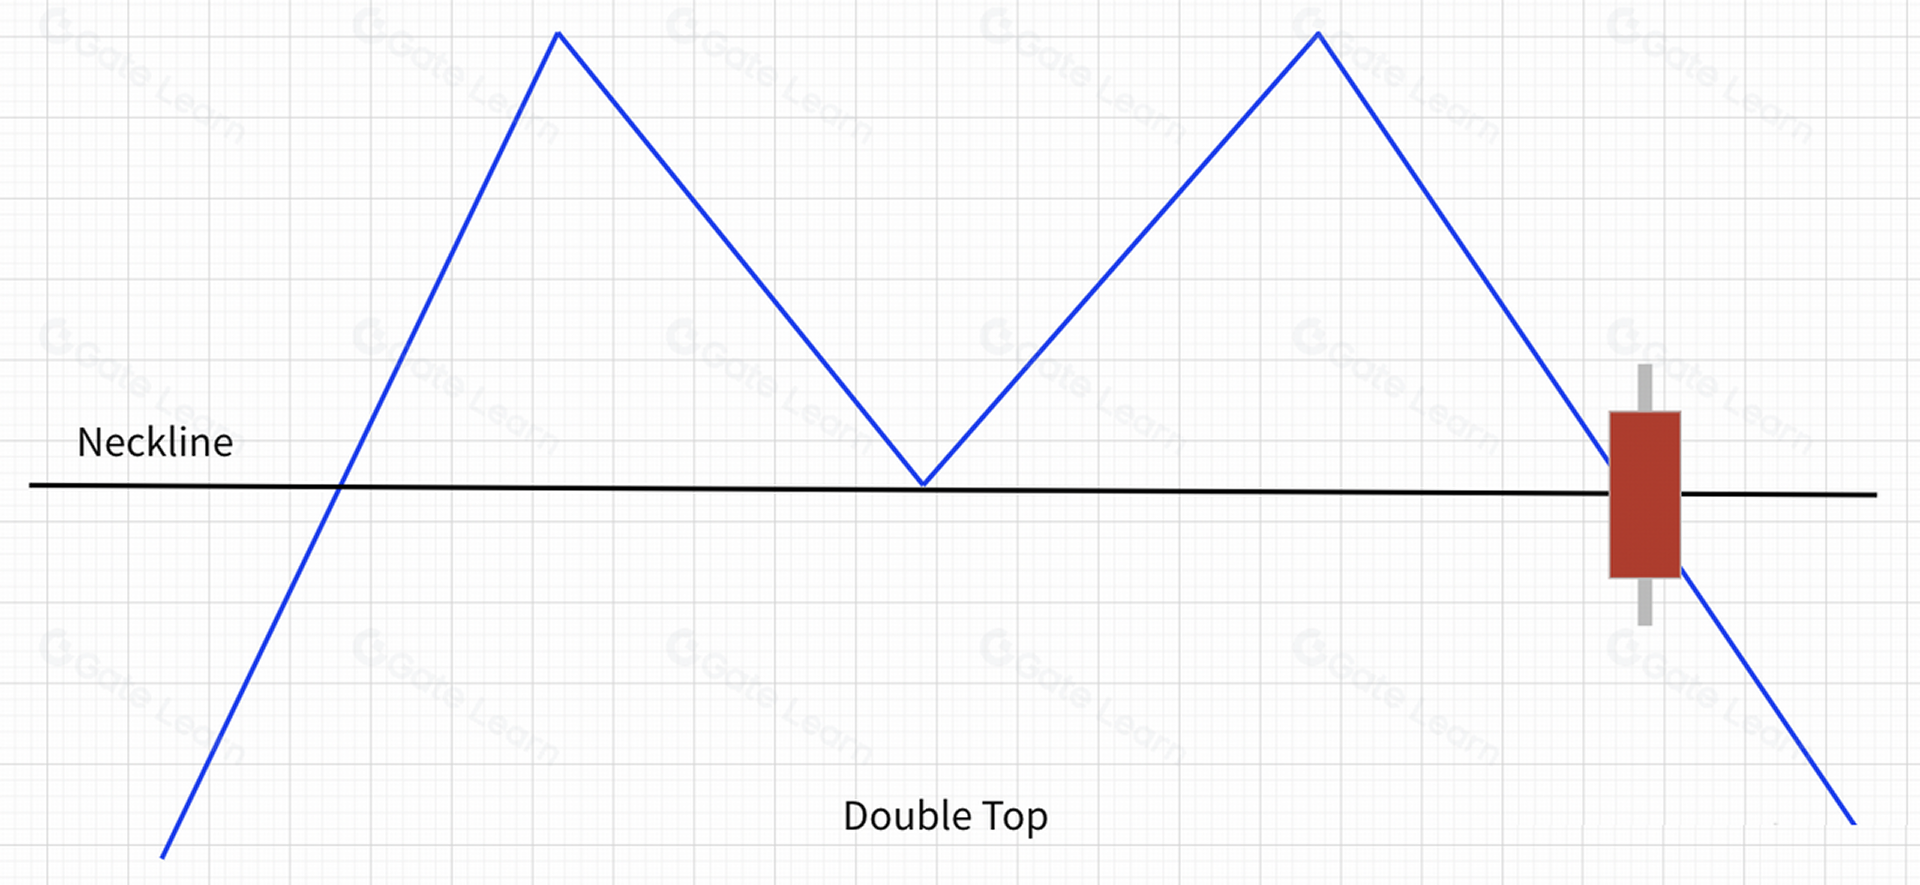
A Double Top is a top-reversal formation, providing strong short-selling opportunities once confirmed. Below are the key entry points:
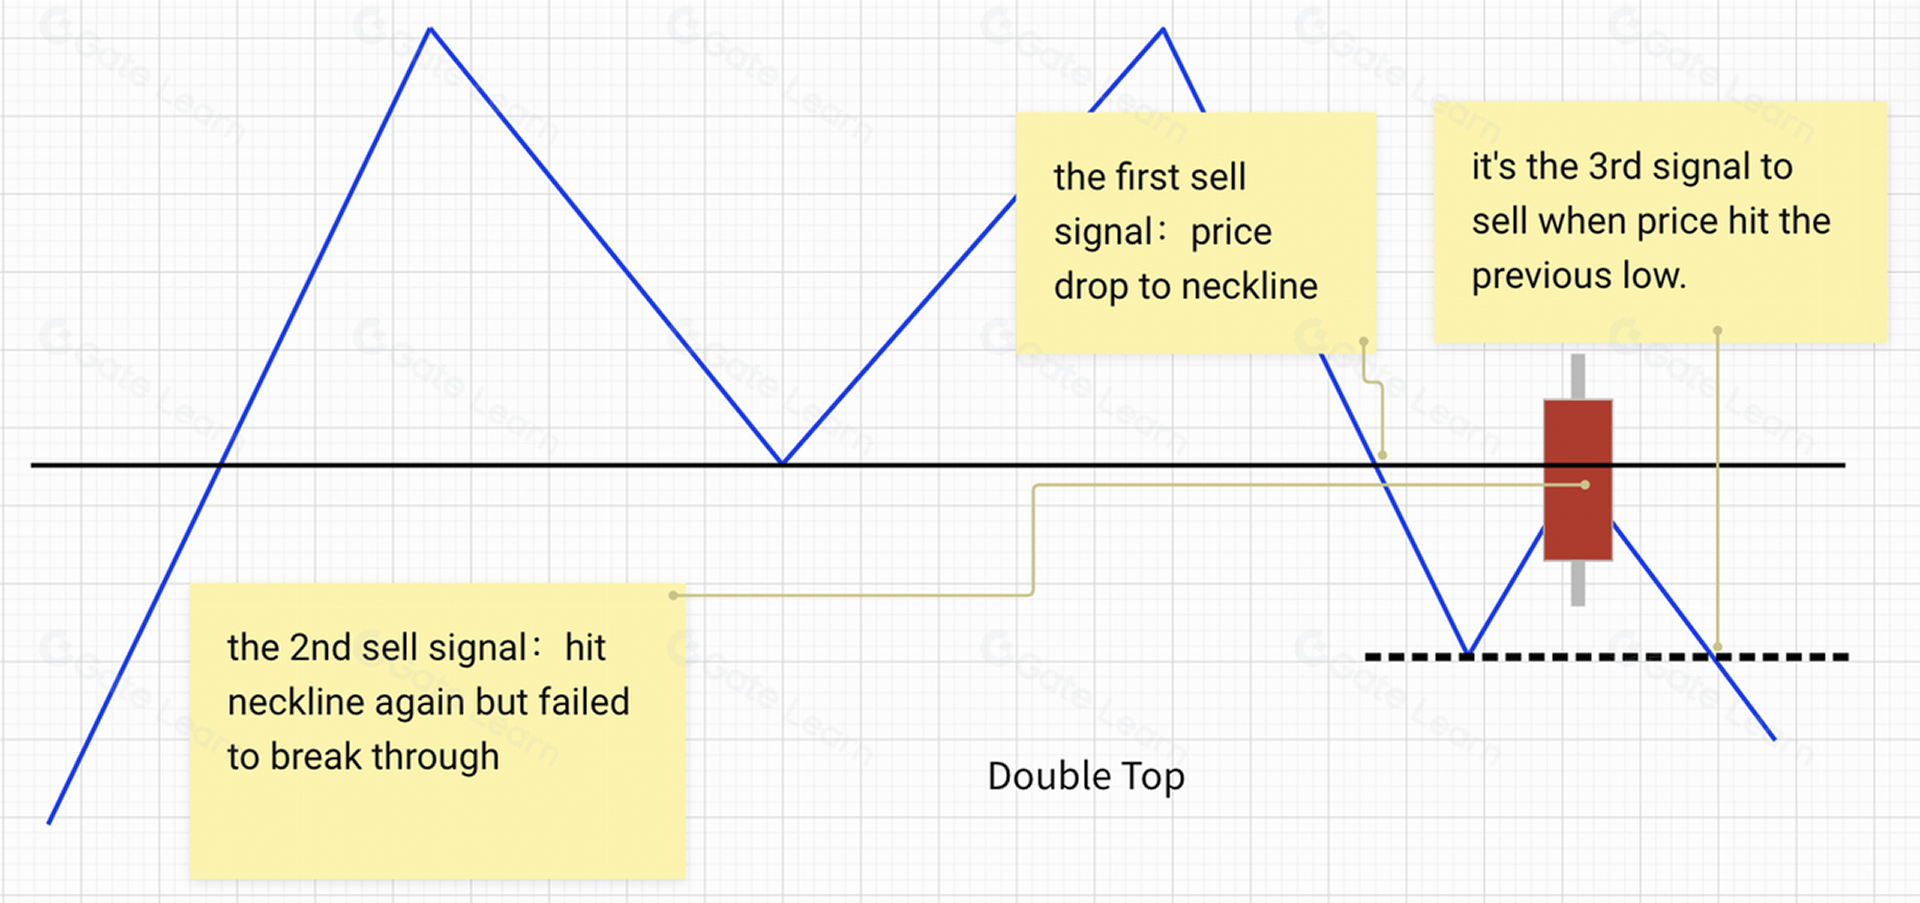
- After the pattern forms, when the price breaks below the neckline with a solid bearish candlestick, the first short entry point appears. See the figure below.
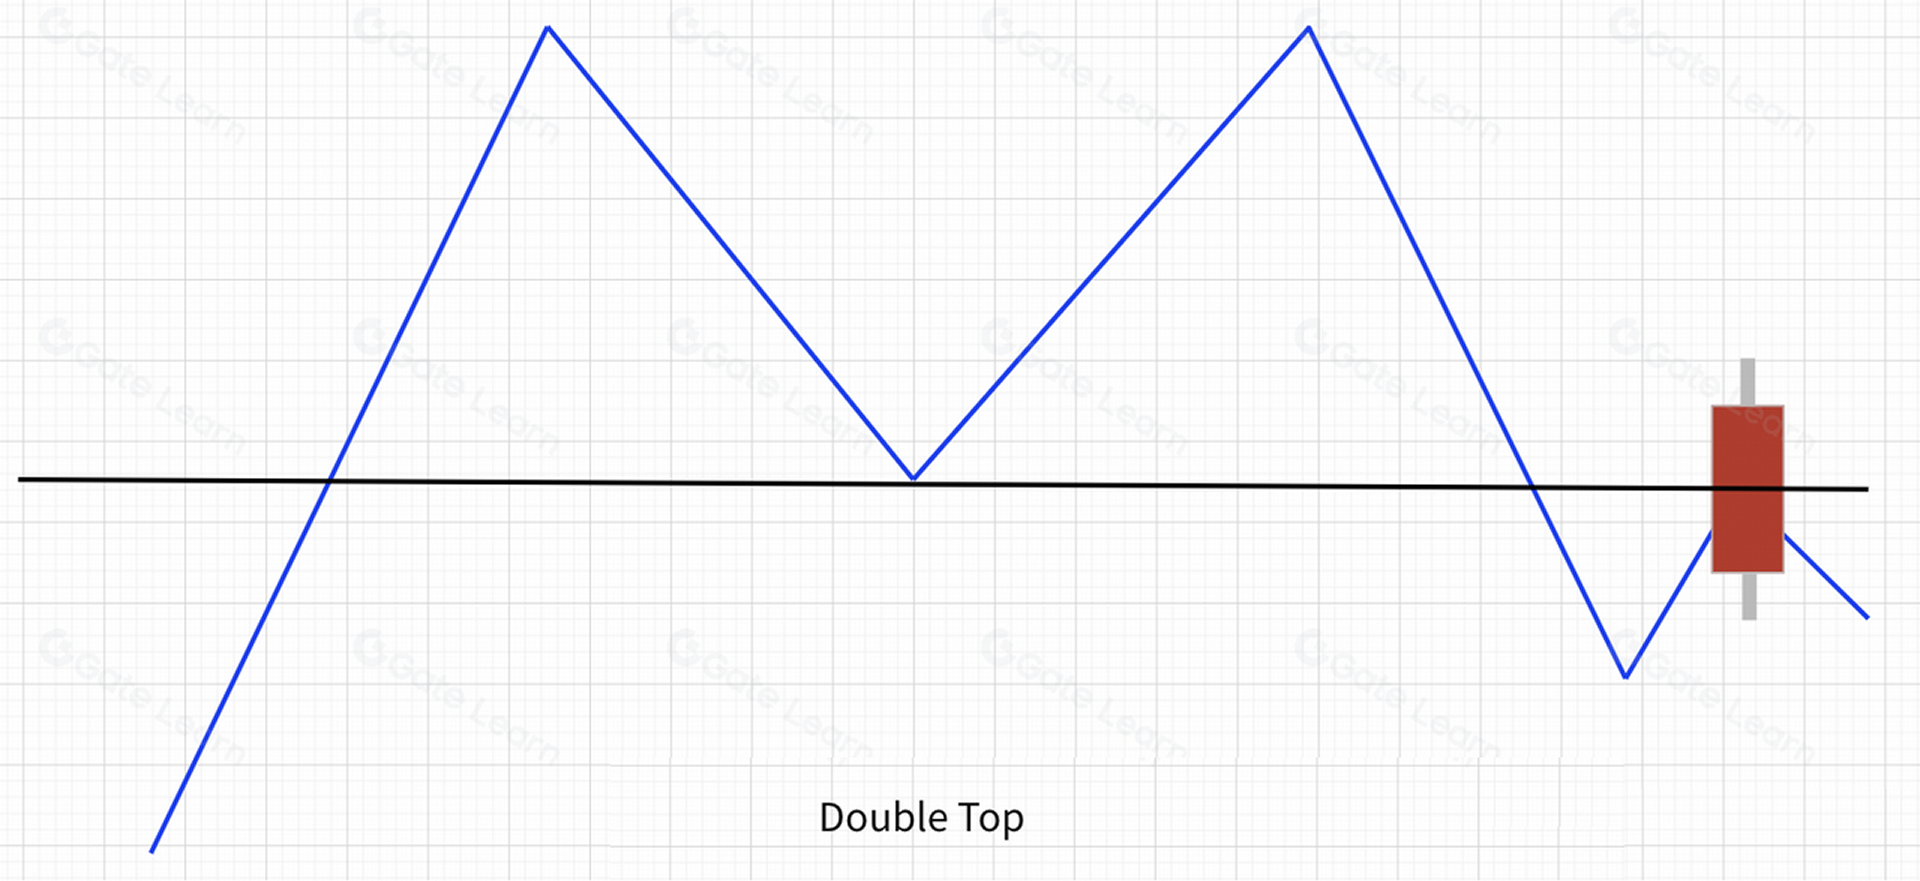
- After breaking the neckline, the price rebounds toward it. If it fails to reclaim the neckline and forms a strong bearish candlestick, the second short entry point appears.
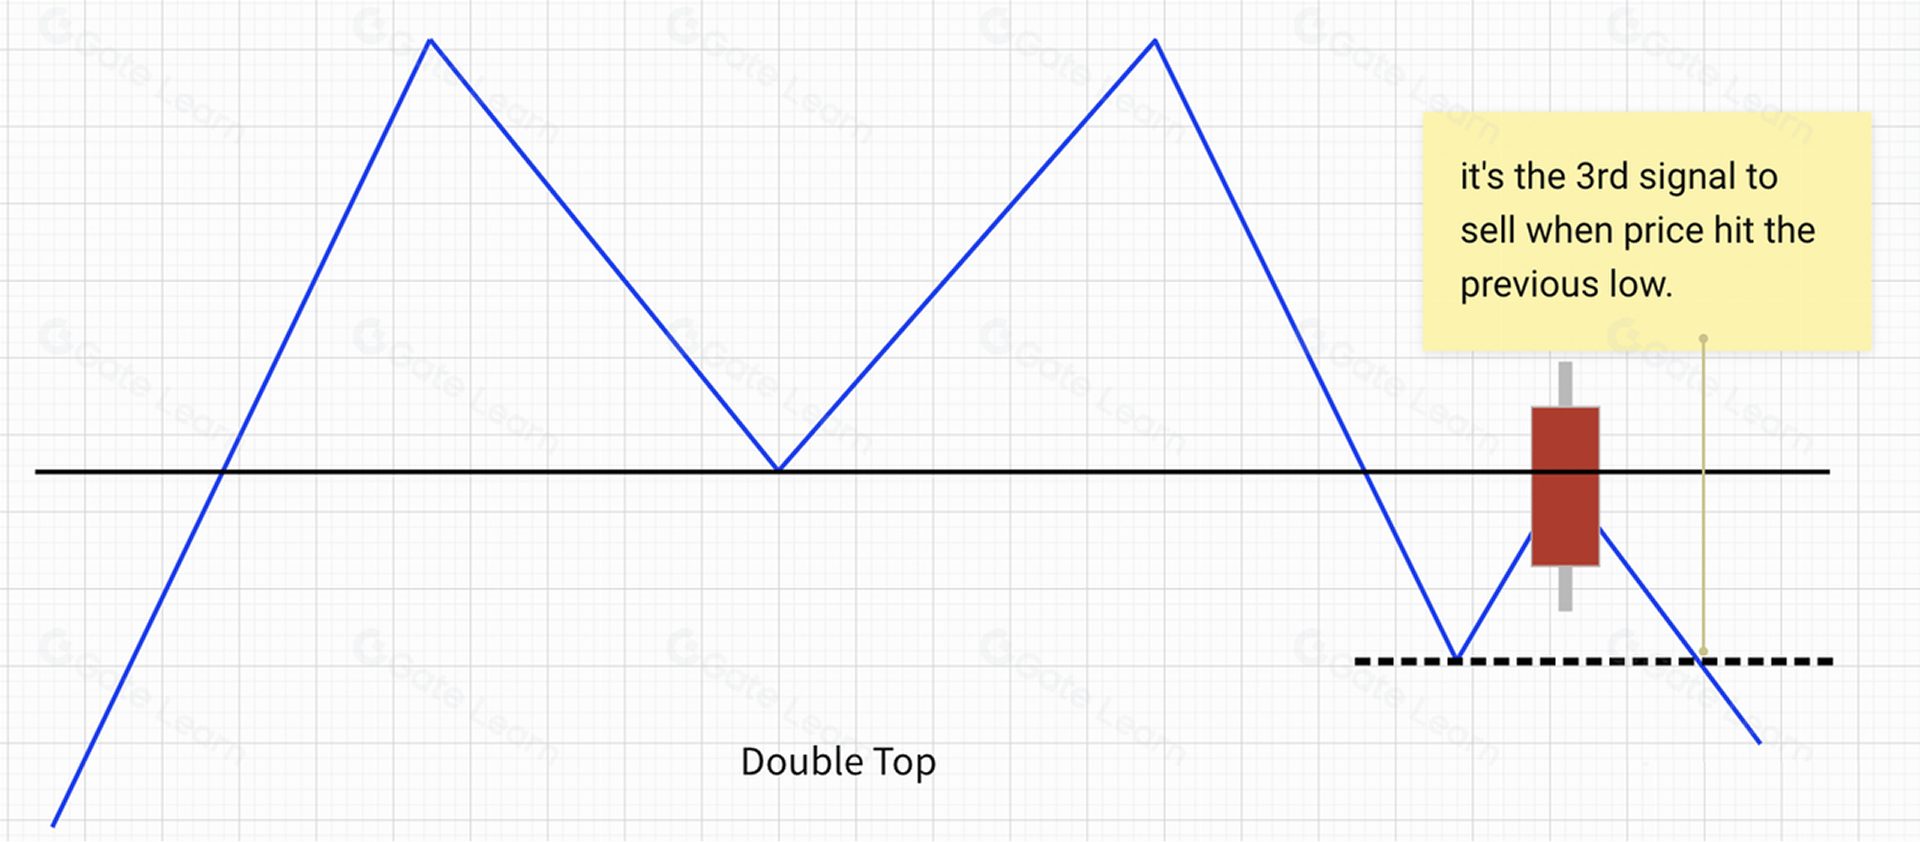
- After pulling back to the neckline, if the price drops again and breaks below the previous low, the third short entry point appears.
Now, let’s summarize the three selling signals of the Double Top pattern, as shown in the figure below:
Sell signal 1: Breakdown of the neckline;
Sell signal 2: Pull back to the neckline;
Sell signal 3: Breakdown of the prior low.
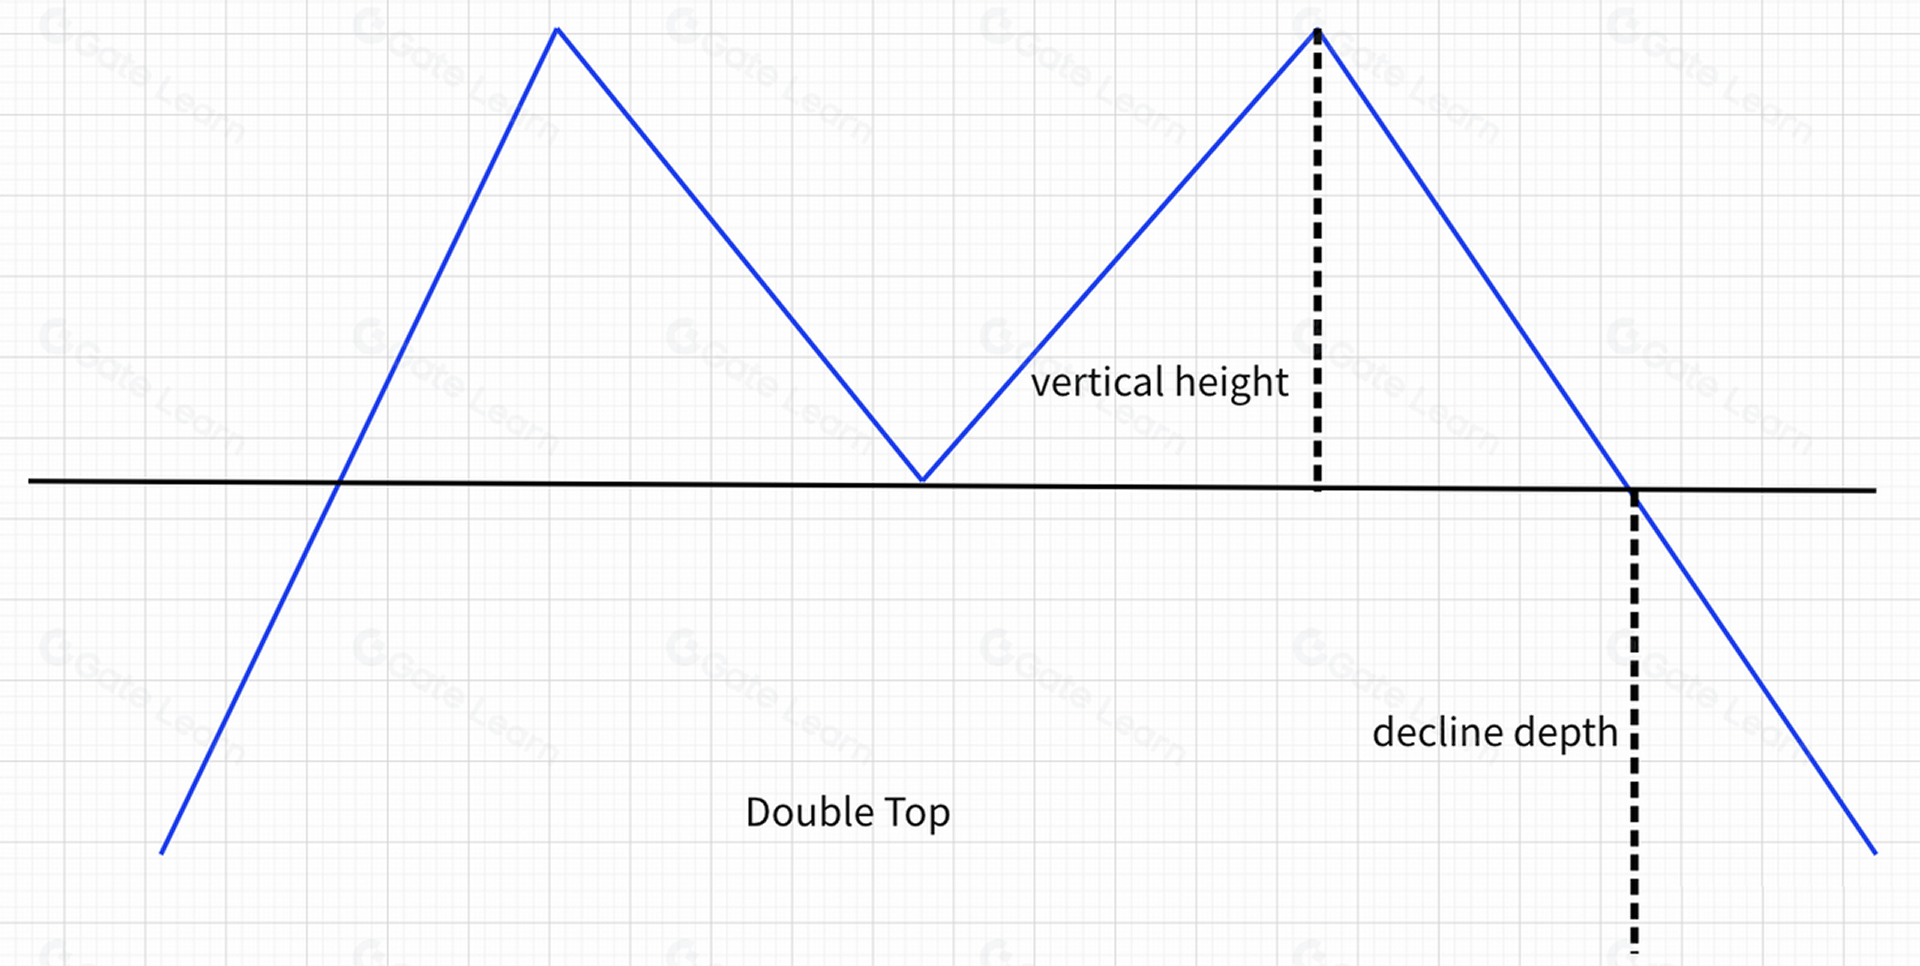
- The longer it takes for a Double Top to form, the more reliable the reversal signal and the stronger the likely downtrend.
- To estimate the minimum downside target, measure the vertical distance from the neckline to the highest peak.
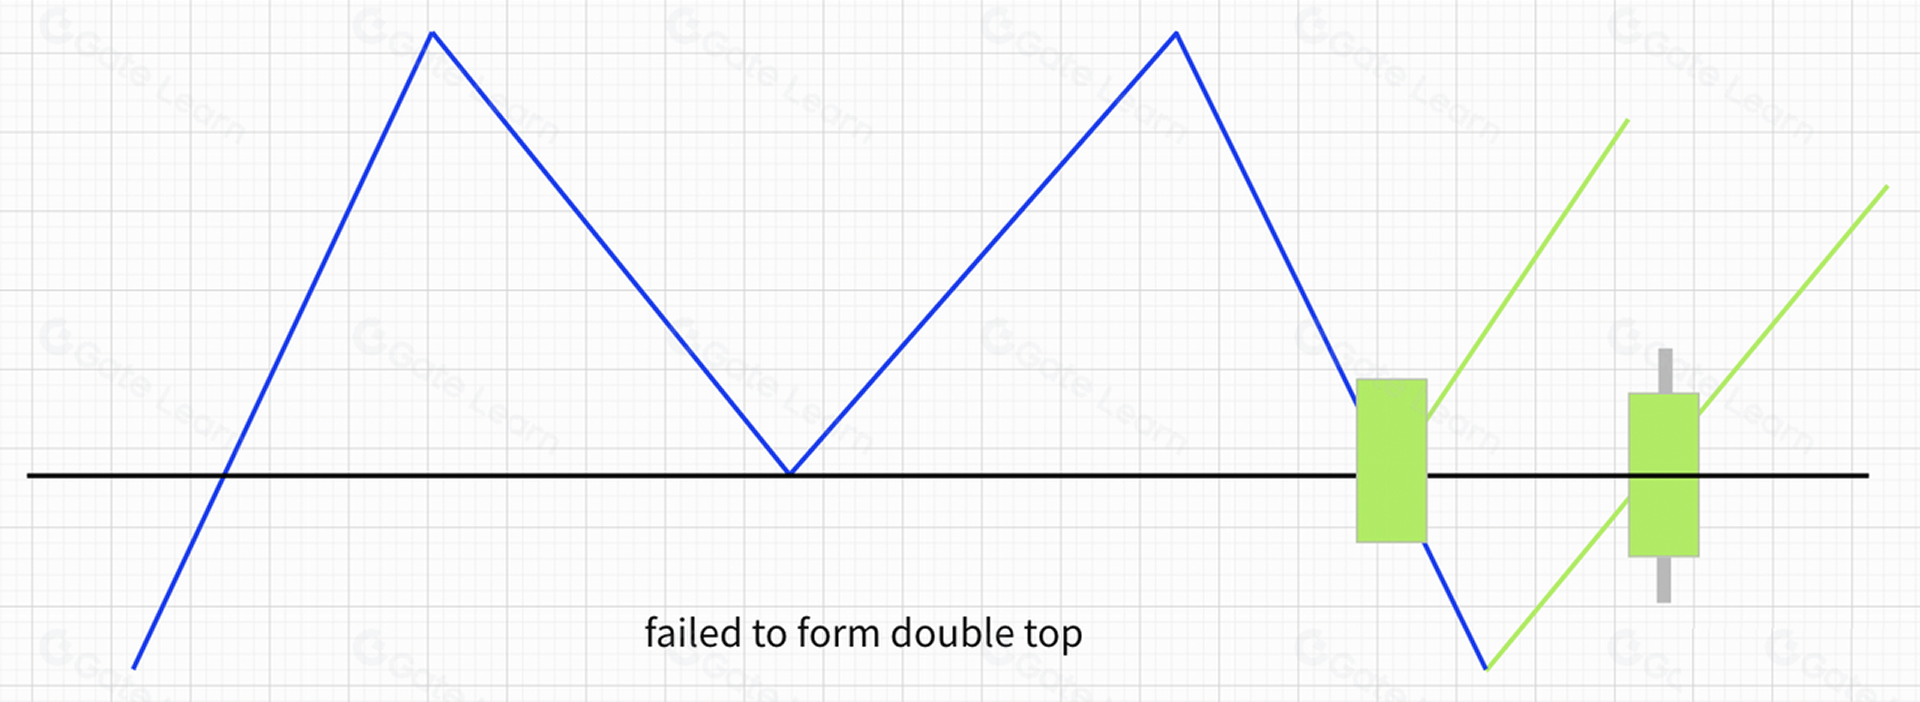
- A Double Top can fail. If the price retests the neckline and breaks above it with a solid bullish candle, be cautious of a potential reversal failure. See figure below:
Real-Market Example
Using BTC as an example:
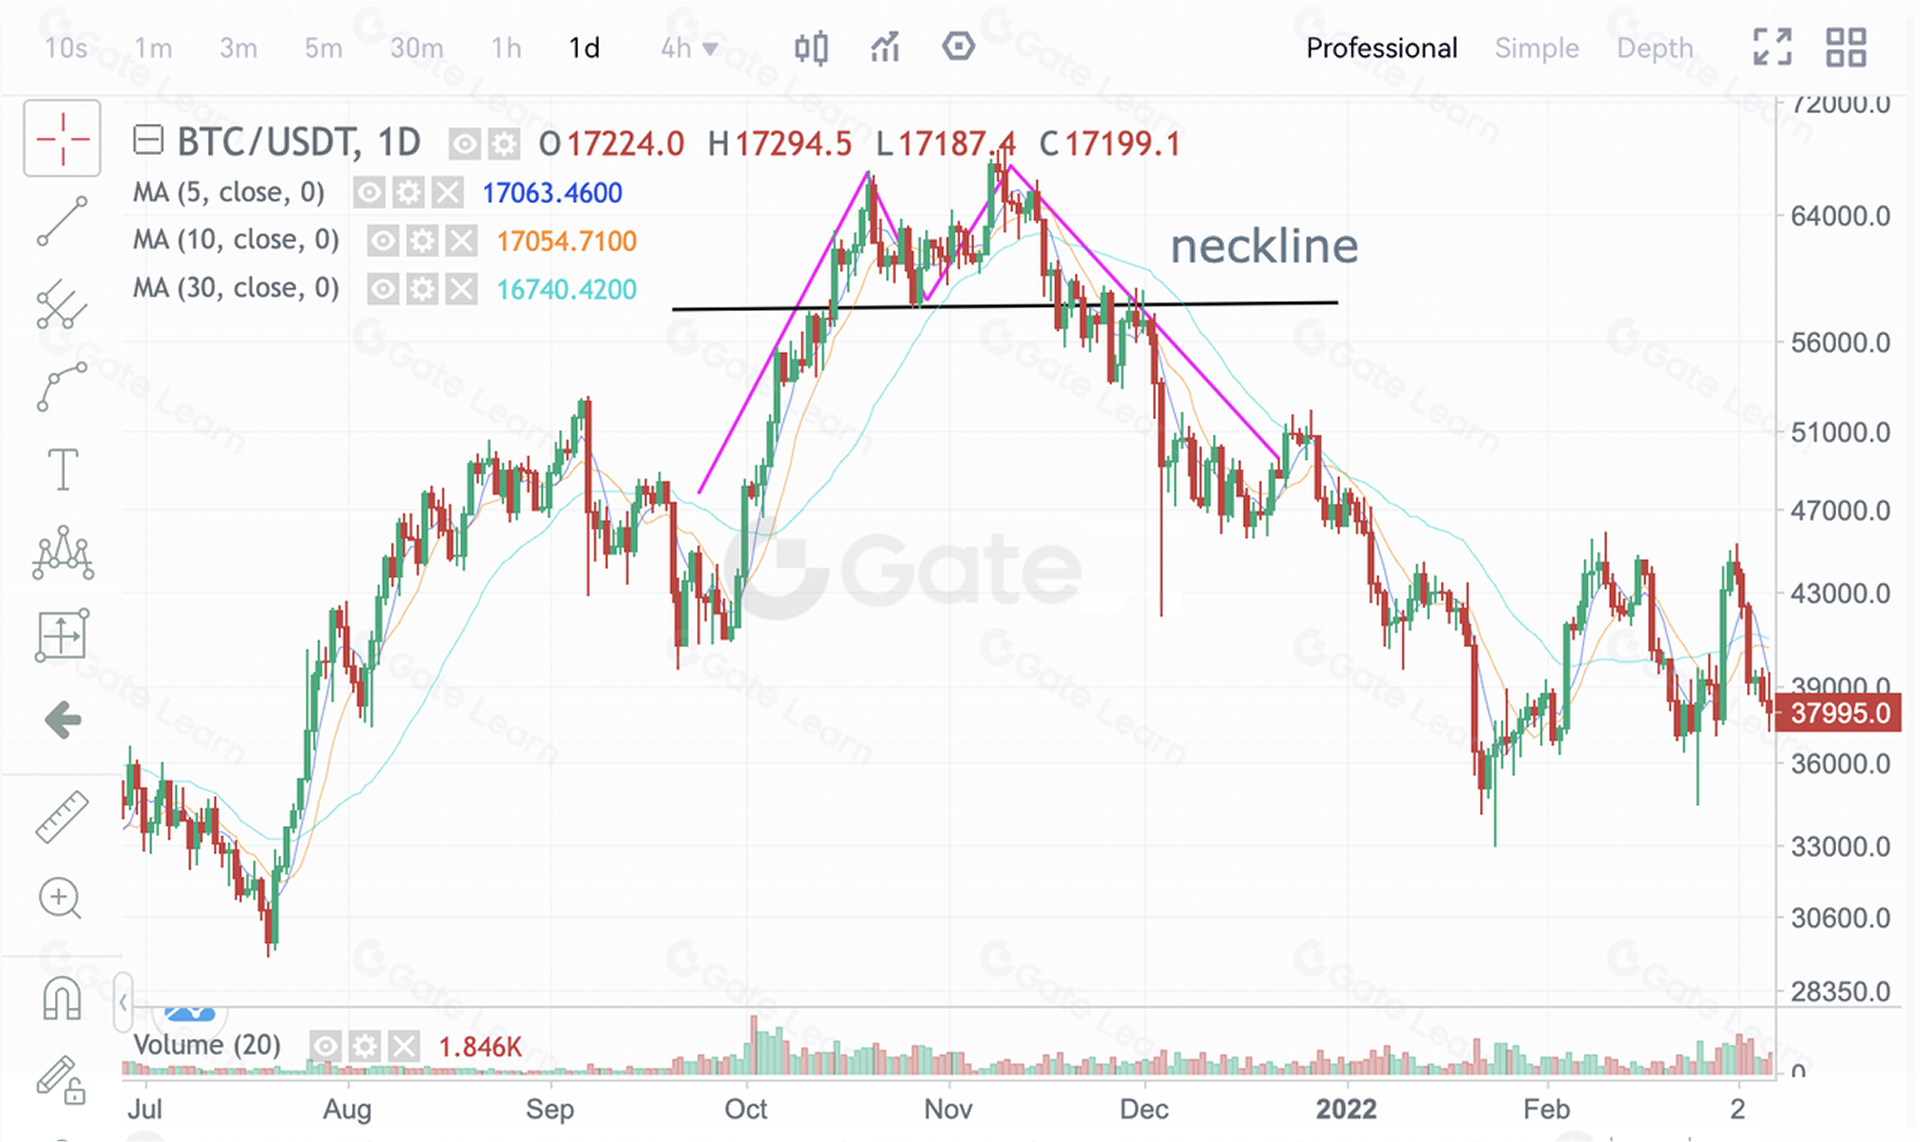
The chart above is the BTC Daily chart on Gate futures. Starting from July 21, BTC rallied from 29,000 USDT to roughly 66,000 USDT—over 120% in just three months. After consolidation and a minor pullback, BTC reached a new high near 69,000 USDT. Several attempts failed to break this high, forming a Double Top. Once the price broke the neckline at 58,000 USDT, a prolonged year-long downtrend began.
Summary
In practical trading, Double Tops may also appear as Triple Tops or multiple tops. Their overall meaning remains the same—a potential trend reversal. Traders should focus on the neckline and look for valid sell signals.
For more information on futures trading, please visit the Gate futures platform and sign up to start your futures trading journey.
Disclaimer
This article is for informational purposes only. The information provided by Gate does not constitute investment advice, nor does Gate bear responsibility for any investment decisions made by users. Content involving technical analysis, market interpretation, trading strategies, or trader insights may include potential risks, uncertainties, and market variables. Nothing in this article guarantees profits, either explicitly or implicitly.
Lesson 1:What Is Technical Analysis in the Crypto Market?
Lesson 2:Common Bullish Candlestick Patterns
Lesson 3:Common Bearish Candlestick Patterns
Lesson 4:Bottom Reversal Pattern—Head and Shoulders Bottom
Lesson 5:How to Use the Top Reversal Pattern—Head and Shoulders Top
Lesson 6:How to Use the Bottom Reversal Pattern—Rounding Bottom
Lesson 7:How to Use the Top Reversal Pattern—Rounding Top
Lesson 8:How to Use the Bottom Reversal Pattern—Double Bottom (W-Shape)
Lesson 9:How to Use the Top Reversal Pattern—Double Top (M-Shape)
Lesson 10:How to Use the Bottom Reversal Pattern—V-Shaped Reversal
Lesson 11:How to Use the Consolidation Pattern—Ascending Triangle
Lesson 12:How to Use the Continuation Pattern—Descending Triangle
Lesson 13:How to Use the Continuation Pattern—Other Triangle Patterns
Lesson 14:How to Use the Continuation Pattern—Flag Pattern
Lesson 15:How to Use the Continuation Pattern—Wedge Pattern
Lesson 16:How to Use the Continuation Pattern—Rectangle Pattern
Lesson 17:Mastering Technical Analysis—Methodology Summary
Related Courses

Tools That Help You Trade Better: Moving Averages, Trend Lines, and Indicators

Gate Futures Trading Guide - A must-read for newbies

Futures Grid Trading User Guide
ETF Leveraged Tokens — Product Guide