The current VIX is at 50. Facing the uncertainty of U.S. tariffs, market sentiment remains in a state of extreme panic. However, markets are always born out of despair.
Written by: WOO
In 2025, the trade war escalated comprehensively, with the Trump administration announcing a minimum 10% tariff on goods from almost all countries and imposing higher tariffs on about 60 countries that have the largest trade imbalances with the United States, causing panic in the global market, with the main logic being
- Tariff increases corporate costs and compresses profit expectations.
- Disrupting global supply chains, deepening economic uncertainty
- Trigger retaliatory tariffs and expand trade war risks
In such an environment, participants in the capital market will:
- Reduce risk asset allocation (e.g., stocks, cryptocurrencies)
- Increase allocation to hedging assets (such as gold, US dollars, Japanese yen)
- Increase in volatility expectation → VIX surges
Tariffs → Increased costs + Global supply chain disruptions + Risk of retaliation + Reduced investment + Flight of safe-haven funds → Market panic
The Panic Index VIX also surged to 60 on April 7, what does this mean? Historically, it has only happened three times, the last time being on August 5, 2024, and the first time during the COVID-19 pandemic in 2020.
We can confirm that the current VIX index is in an extremely historical level environment. In the face of such a situation, how can we use the VIX to make predictions about the market?
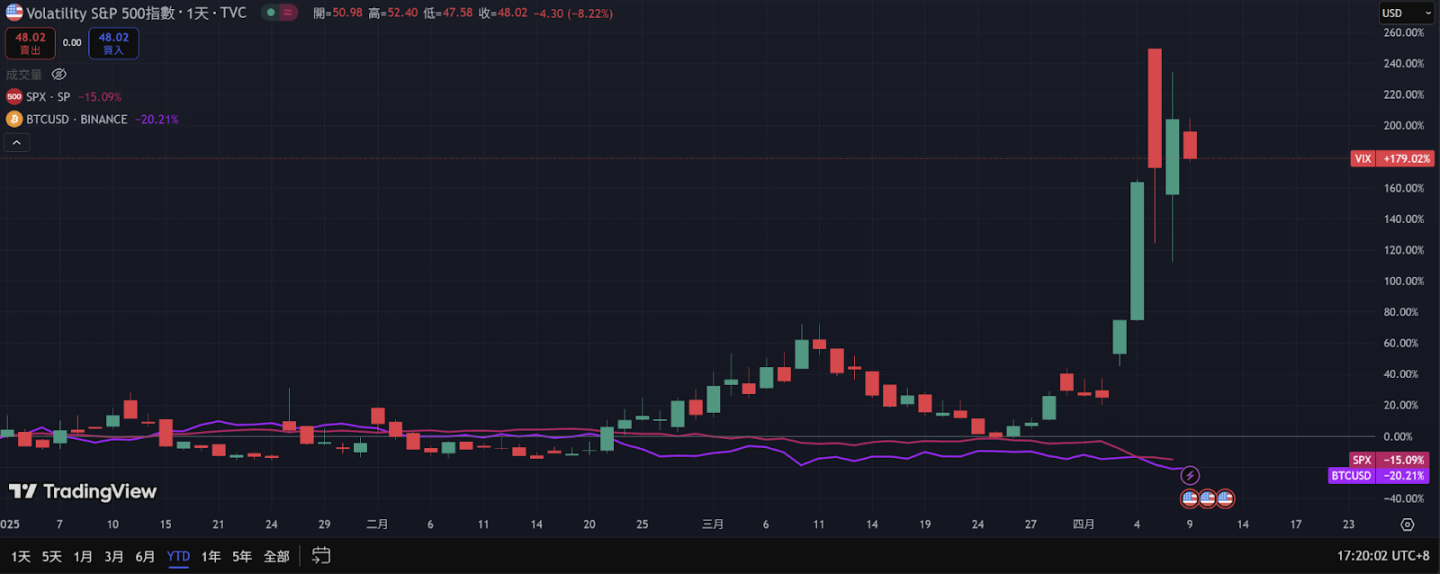
Reference: Tradingview
What is VIX?
VIX is derived from the prices of S&P 500 index options and represents the market’s expectation of volatility over the next 30 days, serving as a measure of market uncertainty and fear.
In simple terms, the higher the VIX, the more the market expects future volatility to be intense, and the stronger the panic sentiment; the lower the VIX, the calmer the market and the higher the confidence. Historical experience shows that the VIX usually spikes when the stock market falls sharply and retreats when the stock market rises and stabilizes. Due to this inverse relationship with the stock market, the VIX is also known as the “fear index” or the market’s emotional thermometer.
The normal level of VIX is around 15-20, which is considered a calm range; when VIX is above 25, it indicates that the market is starting to panic significantly; above 35 is considered extreme panic. During extreme crisis events (such as financial crises or pandemic outbreaks), the VIX index can even soar to above 50, reflecting extreme risk aversion in the market. Therefore, by observing the changes in VIX, investors can gain insights into the strength of current market risk aversion, serving as a reference for adjusting their investment allocation.
High Volatility Panic Zone: VIX ≥ 30
When the VIX index rises above 30, it usually indicates that the market is in a state of high fear or panic. This situation is often accompanied by a sharp decline in the stock market, but historical data shows that the market often rebounds after extreme fear.
- Sample events: Between 2018 and 2024, there have been more than ten instances where the VIX closing price rose above 30. Typical scenarios include the volatility storm in February 2018, the pre-Christmas sell-off in December 2018, the pandemic panic in February-March 2020, the retail investor storm in early 2021, and the interest rate hikes and geopolitical shocks in early 2022.
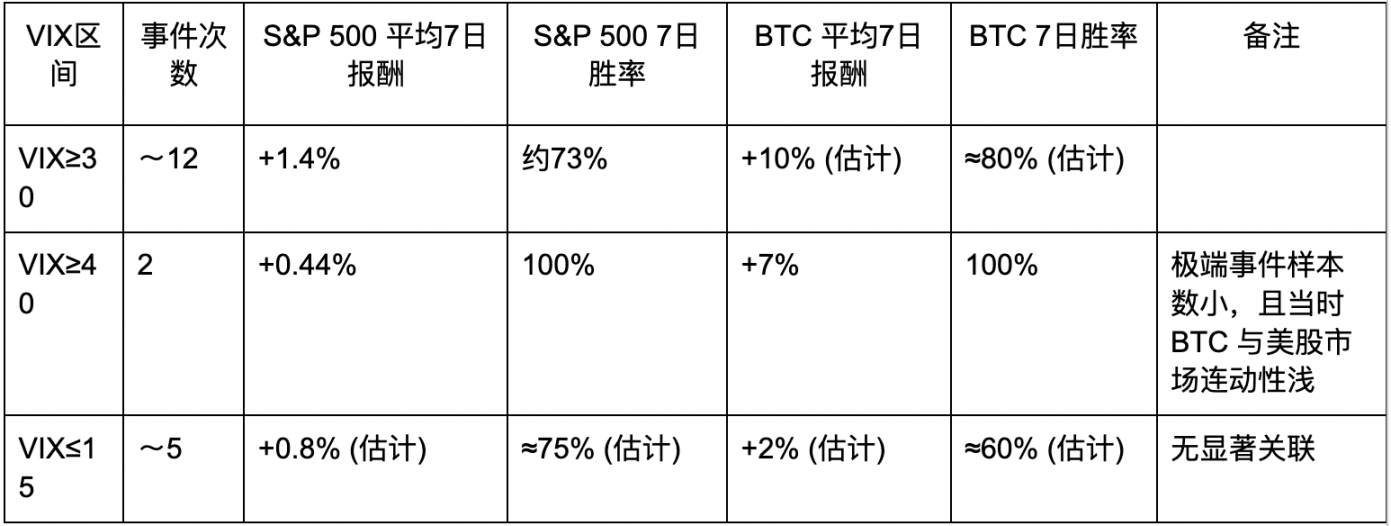
- S&P 500 Average Performance: Within 7 days following these panic events, the S&P 500 often experiences a positive rebound. Statistics show an average increase of approximately 1.4%, with about a 73% chance of rising after the event in 7 days.
- This indicates that when the VIX soars above 30 (panic zone), the stock market usually experiences a technical rebound in the short term.
BTC Average Performance: Bitcoin tends to strongly rebound after extreme panic. Statistical estimates suggest that the average 7-day increase of BTC is around 10%, with a win rate of about 75–80%. For example, in February 2022, when the VIX surged above 30 due to geopolitical crises, Bitcoin rose over 20% in the following week, demonstrating a rebound phenomenon similar to the stock market’s easing of risk-aversion sentiment.
Extreme Fear Peak: VIX ≥ 40
Raising the standard to VIX ≥ 40 (extreme panic), qualifying events were extremely rare during the period from 2018 to 2024. In fact, they only occurred on February 5, 2018, and on February 28, 2020, when the market crash triggered by the pandemic caused the VIX to close above 40 (for the first time in four years). Subsequently, the VIX soared to an unprecedented 82 points in March.
Due to the extremely limited sample size, the statistical results are only for reference: after the event in 2020, the S&P 500 slightly rebounded by about 0.6% within 7 days (the market was highly volatile that week but showed a slight technical rebound), while BTC rebounded by about 7%. In terms of win rate, both had 100%, but this was solely due to a single event causing the increase (which does not guarantee a rise in similar future situations). Overall, when the VIX reaches historical extreme values above 40, it often indicates that the market’s extreme panic selling pressure is nearing its peak, and the opportunity for a short-term rebound is relatively high; from a long-term perspective, this is generally a relatively low point.
- On February 5, 2018 (VIX surged over 100% during intraday trading to nearly 50): The S&P 500 only rose 0.28% a week later, with no significant increase. However, Bitcoin plummeted 16% that day, hitting a local low of ~$6,900, before rebounding to over $11,000 two weeks later, indicating strong rebound momentum. However, in the context of that time, the correlation between Bitcoin and real-world asset trends was not high, making it inappropriate to use VIX to judge Bitcoin’s movements.
- Mid-March 2020 (VIX peak of 82): The S&P 500 rebounded over 10% within a week after bottoming out on March 23, and Bitcoin also rapidly surged about 30% from below $4,000.
Although statistically, the short-term performance after extreme panic is biased towards the positive, the small sample size means high uncertainty, and at that time, the correlation between Bitcoin and US stocks was not as high as it is now. In practice, a VIX above 40 is more of a signal confirming that the market is in an extreme panic state, and future market trends still need to be assessed in conjunction with fundamental information.
Low Volatility Range: VIX ≤ 15
When the VIX index falls below 15, it usually indicates that the market is in a relatively calm state. Investor sentiment is more optimistic, and the demand for hedging is low. However, the subsequent trend at this time is not as clearly consistent as when VIX is high:
- Sample Event: The VIX has repeatedly fallen below 15 between 2018 and 2024, such as after a strong stock market rebound in early 2019, during the market stability period at the end of 2019, during the stock market uptrend in mid-2021, and in mid-2023. During these periods, market volatility was at historically low levels (sometimes referred to as market calm).
- S&P 500 Average Performance: The average return of the S&P 500 is around +0.8% and the win rate is around 60–75% (slightly higher than the random probability) within 7 days of a very low VIX event. Overall, stock indices tend to rise slowly or fluctuate slightly in a low-volatility environment. For example, in the week after the VIX fell below 15 in October 2019, the S&P 500 was largely stable and slightly high; When the VIX was around 13 in July 2023, the index continued to rise slowly by about 2% the following week. This suggests that a low VIX does not necessarily lead to an immediate pullback, and the market is likely to continue its upward trend for some time. However, it is important to be wary that extremely low volatility often implies market complacency, and in the event of a sudden bearishness, volatility and decline may be significantly amplified.
- BTC Average Performance: Bitcoin’s movement during the low VIX period lacks clear directionality. Statistics show that its 7-day average increase is only about +2%, with a win rate of approximately 60%. Sometimes, the calm period of low VIX coincides with BTC’s own bull market phase (for example, in the spring of 2019, low VIX accompanied a significant rise in BTC); however, there are also times when BTC experiences a correction during the low VIX period (for instance, in early 2018, when VIX remained low, Bitcoin was in a downtrend following a bubble burst).
Therefore, the low VIX has little predictive value for the subsequent trend of BTC and must be considered in conjunction with the funding sentiment and cyclical considerations of the crypto market itself.
Overall, when the VIX is below 15, the S&P 500 tends to continue its existing trend (mostly a gradual rise), but the magnitude of the rise and the win rate are significantly lower than the rebounds after panic. However, BTC lacks a unified response pattern in this environment, indicating that low volatility in traditional markets does not necessarily mean synchronization with the crypto market.
Conclusion: Risks and opportunities coexist; seeking a sword by carving a boat is merely a reference.
When VIX soars to the 30-40 range
- Short-term trading may carry risks, but it also contains potential reversal opportunities.
- BTC usually declines synchronously during panic selling pressures, but as panic subsides, the excessive shorts accumulated from the sell-off are likely to trigger a strong technical rebound.
- If you observe that the VIX starts to peak and fall back from 35 slowly to below 30 (, it is a potential opportunity to buy BTC in the short term.
- It is necessary to assess the severity of the event itself; if a major financial risk erupts, the market may continue to decline further.
When VIX ≥ 40
- Represents that the market is in extreme panic, including possibilities such as liquidity depletion and large capital withdrawal.
- The short-term probability of a significant drop in BTC is extremely high, but often if the panic alleviates slightly after a week or two, the expected rebound in BTC will also be relatively astonishing.
- In this environment, short-term speculators are advised to maintain high risk control and strictly adhere to stop-losses, as “tasting blood on the knife’s edge” comes with both profits and risks.
- In terms of the long term, they are relatively low points.
When VIX ≤ 15
- The market is generally in a natural state. Whether BTC rises often depends more on the crypto market’s own cycles, capital flow, or technical trends.
- In an overly calm environment, be aware that once sudden variables or black swan events occur, the VIX may rise rapidly, and BTC may also follow suit with a drop.
- Consider keeping a portion of cash / stablecoins as a reserve during this period, and stay alert to the risk trends.
The middle zone of VIX 15–30
- Generally regarded as the range of “normal fluctuations.” BTC is also influenced by the crypto cycle and macro liquidity, at which point the VIX can serve as a supporting indicator.
- If the VIX rises from above 20 to near 30, it indicates that panic is gradually increasing, and risk prevention is needed; conversely, if the VIX gradually falls from 25 to below 20, it shows that panic is easing and BTC may be relatively stable.
As of now, the VIX is at 50, and in the face of uncertainty regarding U.S. tariffs, market sentiment remains in a state of extreme panic. However, market trends are always born out of despair.
During the pandemic in 2020, the VIX peaked above 80, while the S&P 500 was around 2300 points. Even after the recent panic sell-off, the S&P 500 remains around 5000 points, with over 100% ROI in five years; at the same time, Bitcoin was at an excellent buying point, priced at only 4800 dollars, and the peak of this bull market reached 110,000 dollars, with a maximum increase of nearly 25 times.
Each major drop is often accompanied by market repricing and capital flow; chaos is a staircase, and whether one can use it to climb and leap forward is the key issue of this period.
