Author: Frank, PANews
With the surge in multiple Binance Alpha tokens, discussions about the altcoin season led by Binance Alpha have once again become rampant.
Many users are discussing on social media what kind of logic constitutes a potential wealth code. However, this so-called altcoin season is actually just a cognitive bias triggered by a few “explosive” projects. But if we are to find commonalities among these wealth codes, what kind of token conditions among the various Binance Alpha tokens can lead the market?
PANews conducted a comprehensive data analysis of 335 tokens launched on Binance Alpha, examining multiple dimensions such as market capitalization, chain distribution, trading pair types, and whether they are airdropped, to deeply explore the true wealth code behind them and to investigate an ultimate question: Has the so-called “Binance Alpha Shanzhai Season” really arrived?
Shanzhai season or illusion, in the past week, only 5 tokens have seen an increase of more than double.
According to PANews' analysis of the 335 tokens launched on Binance Alpha, their market performance exhibits two core characteristics: a general “listing pump effect” and a significant “performance polarization.”
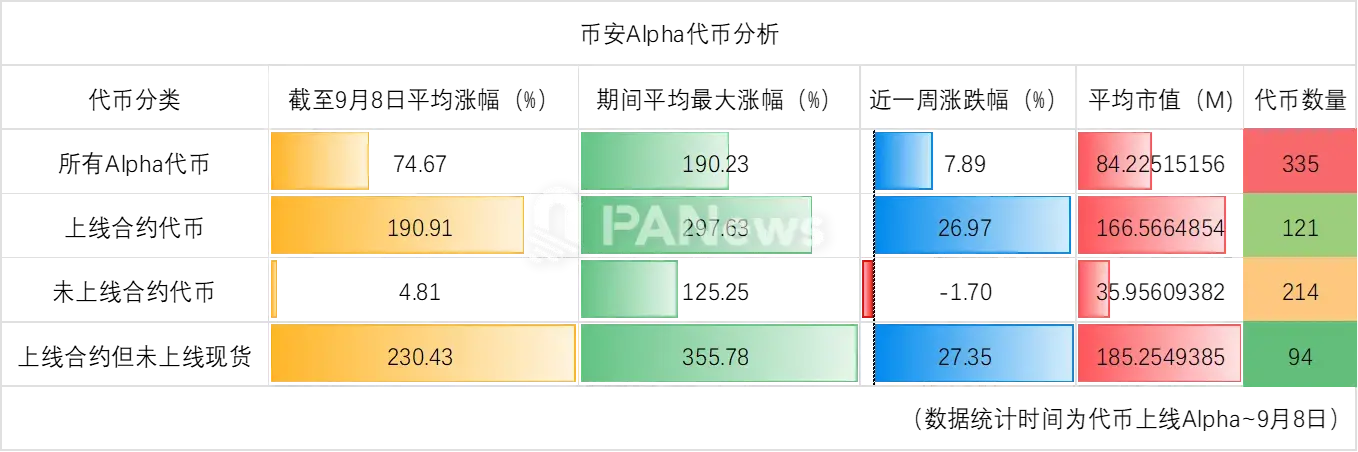
General Surge Effect: From the overall data, the average increase of this batch of tokens since their launch has been 74.6%, while the historical average maximum increase has reached as high as 190%. This indicates that the vast majority of tokens have experienced a strong surge after landing on the Alpha platform. Specifically, there are 120 tokens (accounting for 35%) that have at one point doubled in price after launch, with only 19 tokens never breaking their issue price.
Performance Polarization: However, there is a huge difference in long-term performance after the surge. So far, 146 tokens (43.5%) have seen an increase, with 44 of them doubling in price, and the star project MYX has achieved an astonishing return of 123 times. At the same time, there are also 81 tokens (24%) whose prices have been halved, with the maximum decline exceeding 97%.
Market Capitalization Distribution Characteristics: In terms of project size, the average market capitalization of this batch of tokens is $84.22 million, with a median of $18.58 million. Among them, the number of projects with a market capitalization exceeding $100 million is the highest (48), followed by projects with a market capitalization in the range of $10 million to $20 million. This also indicates that although there are small projects in the market with a total market capitalization of less than $1 million, the mainstream projects on the Alpha platform still possess a certain scale.
Data from the past week: 141 tokens have experienced an increase in the past week, with MYX still having the largest increase at 1064% over 7 days. However, there are actually not many tokens that have increased by more than 1 time in the past week, only 5. From the statistical data, the average price fluctuation of Binance Alpha tokens in the past week is only 7.8%, far less than the fluctuation over the entire period. Therefore, the recent explosion of altcoin season on Binance Alpha may only be a cognitive bias and does not have general applicability.
Do futures contracts rise more than spot?
In addition, one of the topics that has been widely discussed on social media is that tokens that have launched Binance contracts but have not launched spot trading may see a larger increase.
First of all, from a holistic perspective, currently only 28 tokens have launched spot trading pairs on Binance, accounting for only 8.3%. The vast majority of these have also launched contract trading pairs. The number of trading pairs that have launched contracts is relatively high, reaching 121, accounting for 36%. There are 94 tokens that have only launched contracts but have not launched spot trading pairs, and the average increase in their value over the past 7 days has reached 27%, which is indeed higher than the average value of all tokens. In comparison, tokens that have not launched contract trading pairs have an average increase of -1.7%, indicating an overall downward trend in the past week.
In terms of market value, the average market value of tokens that have not yet launched contracts is around $35.96 million, while the average market value of tokens that have launched contracts is approximately $160 million. Clearly, those tokens with higher market values are more likely to prioritize launching contract trading. Over the entire period, the average increase for tokens that have launched contracts has reached 190%, with the historical maximum average increase reaching 297%. The data indeed shows better performance, whereas the average increase for tokens that have launched spot trading so far is only 45.77% (referring to the performance after launching Alpha).
In comparison, tokens that launch contracts but do not launch spot trading have an average increase of 230% and an average maximum increase of 355%. Tokens that meet this condition do indeed perform better.
The BSC chain has significant local advantages, with an average increase of over 100%.
Are there also different effects in terms of the chain?
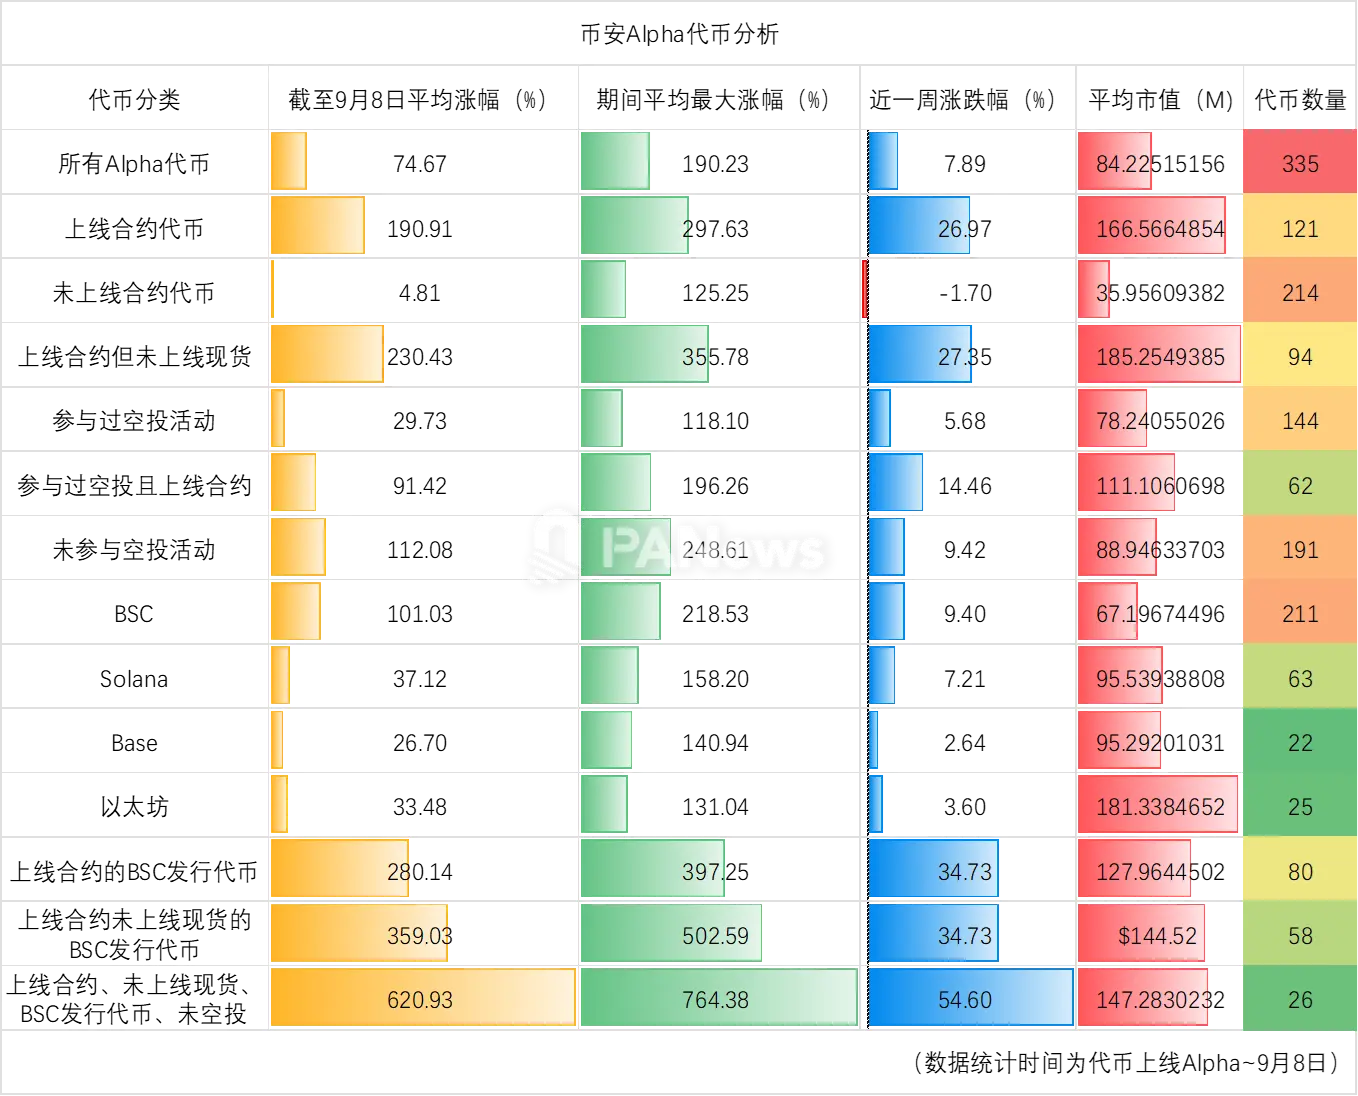
From the distribution of chains, among the tokens currently listed, there are 22 on the Base chain, with an average increase of 26%; there are 211 tokens on the BSC chain, with an average increase of 101%; there are 28 tokens on the Ethereum chain, with an average increase of about 33.4%; and there are 64 tokens on the Solana chain, with an average increase of about 37%.
From the perspective of chain distribution, BSC, as a native public chain, is indeed more favored by the market, with market performance superior to that of tokens from other public chains.

Buy old, not new; popular tokens generally launch earlier.
What are the characteristics of the tokens that have seen the largest price increases recently?
-
Tokens on the BSC chain dominate, among the 5 tokens that have increased by over 100% in the past week, 4 are from the BSC chain and 1 is issued on the Solana chain.
-
The launch time does not refer to newly listed tokens in the near future; these tokens were generally launched in May and July, with only one launched on August 24.
-
There are 3 tokens for the newly launched contract trading pair, but this does not seem to indicate that the increase is directly related to the launch of the contract trading.
-
In terms of market capitalization distribution, there is no significant statistical meaning. The market capitalization of these 5 tokens ranges from several hundred thousand dollars to several billion dollars. However, the market capitalization of 4 of the tokens exceeds 10 million dollars.
If we look further ahead and analyze the tokens that have increased by more than 100% since their launch, there may be more references.
-
In terms of market capitalization, these tokens generally have a market cap exceeding 10 million USD, and the tokens with a market cap over 100 million USD tend to have higher growth rankings.
-
The number of contracts launched accounts for 54.5%. From this point of view, it seems that this cannot directly prove a necessary connection between the significant increase and the trading of launched contracts.
-
The number of tokens issued on the BSC chain accounts for 56%, while the number of tokens issued on Solana accounts for 22.7%. The overall proportion of these two chains has reached nearly 80%.
-
There is a significant difference in the launch time of coins on Binance Alpha. The distribution of launch times is as follows: April (12), May (4), June (3), July (16), August (6), September (3). From this data, it is evident that the tokens launched in April, July, and August performed better in the market.
Does issuing airdrops actually hinder the rise of token prices?
Another perspective that the market is concerned about is how the tokens that participated in the Binance Alpha airdrop have performed. According to a PANews investigation, the number of tokens that have undergone the Alpha airdrop so far is 144. The average increase in price of these tokens to date is about 29%, which is actually not as good as the performance of all Alpha tokens. Among them, 91 tokens have been in a downward trend from the price after going live on Alpha to the current price, with the largest drop reaching 97%. However, from the perspective of maximum increase, these tokens experienced a price surge after going live on Alpha, with an average maximum increase of about 1235%. However, if we observe the data, we can see that REX had a maximum increase of 1457 times after going live, which was caused by a short-term anomaly in the candlestick chart. After removing such anomalous data, the average maximum increase is about 118%.
However, when the data filtering criteria include participation in airdrop activities and having already launched on Binance contract trading, the average increase of these tokens reached 91%, while the average maximum increase reached 196%. This data performance is better than the average level of airdrop tokens, but lower than the average level of contract tokens.
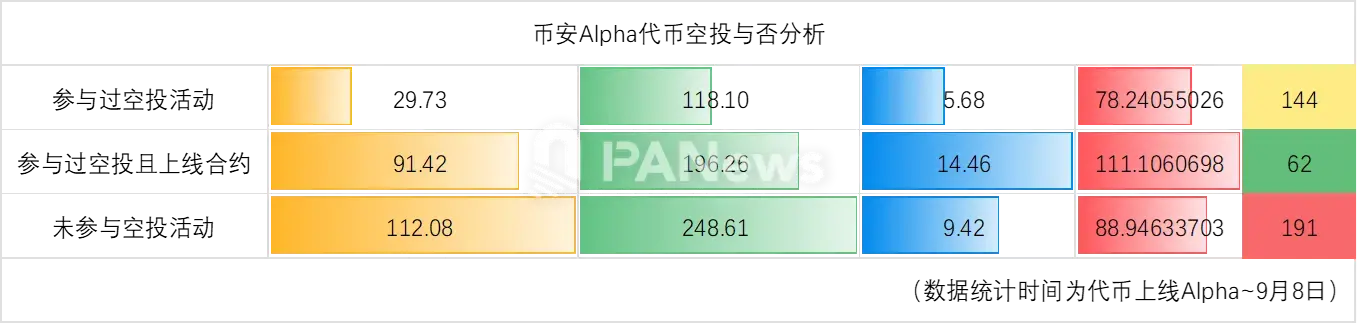
From this perspective, whether to launch contract trading has become one of the most critical positive factors for Binance Alpha token. In contrast, participating in airdrops does not provide much impetus for the project's market price, and may even have adverse effects.
Optimal combination: Long contracts, do not trade spot, BSC chain, no airdrop
So, back to our ultimate question, what kind of tokens might be the best-performing category in Binance Alpha? Combining previous analyses, we can see several potential favorable conditions from multiple dimensions, namely the launch of futures trading, issuance on the BSC chain, no airdrop, and no spot trading launched.
After adding several conditions, the average increase in tokens issued on the BSC chain that have already launched contract trading has reached 280%, higher than the tokens that have only launched contracts. If we further add the filter for those not yet listed on spot, the average increase will reach 359%. The strongest filtering condition is for tokens that have launched contracts, not listed on spot, not issued airdrops, and issued on the BSC chain; in this case, the average increase of such tokens has reached 620%, with the average maximum increase reaching 764%, and the increase over the past week has been 54%. Data from various angles has almost reached optimal conditions.

At this point, it seems we have found the key to potential stocks on Binance Alpha, and under such screening conditions, there are only 26 tokens. By carefully analyzing the reasons for this result, we can find that in this process, whether the contract trading is launched and whether it is issued on the BSC chain have become the most critical factors, while the other few are more like auxiliary factors. However, ironically, these auxiliary factors are not due to these projects or tokens doing more, but rather not launching spot trades and airdrops, which is a subtraction.
Fundamentally speaking, the underlying logic behind this may be that airdropped tokens bring a large amount of low-priced chips to the market, creating a dumping effect. The fact that they are only available for contract trading and not for spot trading means that the price difficulty of these tokens is relatively lower. Of course, for investors holding spot assets, an increase is always a good thing, but for investors who prefer contract trading, the volatility of these tokens is also greater, making it easier to create a short squeeze effect.
However, it is worth noting that the conditions established by the above studies are based on historical data, and there is a possibility of overfitting. Additionally, a major regret during the research process is the failure to classify these tokens and provide more specific project information, which may be more important factors. Therefore, these research conclusions cannot serve as a basis for actual investment judgments. It is hoped that such studies are merely a starting point to guide methods and provide readers with a new perspective.
The current opportunity is not a brainless buying spree that guarantees profits in the early stages of a bull market, but rather a structural market that requires careful selection and in-depth analysis. For investors, understanding the logic behind this phenomenon is far more important than simply chasing trends. Because in this game dominated by contract trading and characterized by extreme volatility, the flip side of opportunity is always the risk that must be heeded.
