- Bitcoin is currently hovering around the $90.3K mark.
- BTC’s daily trading volume has surged by over 44%.
With the fear sentiment across the crypto market, the majority of the tokens are charted in red, while a very few are in green. The market is fluctuating between losses and gains. Meanwhile, the largest asset, Bitcoin (BTC), has been stuck in the bear trap, despite multiple recovery attempts
BTC could reach $95K once the potential bulls assert dominance. As of today, in the early hours, the asset traded at a high range of $92,721.77. With the bearish command talks, the price fell back to a bottom level of $89,532.60. As per CMC data, Bitcoin has posted a 2.09% loss and is currently trading at $90,313
In addition, the market cap of the asset is resting at $1.8 trillion, with the daily trading volume having surged by over 44.69%, reaching the $83.1 billion mark. The Coinglass data has reported that the market has experienced a liquidation of $71.83 million worth of Bitcoin during the last 24 hours
Which Way Is Bitcoin Headed Next: Higher or Lower?
Bitcoin’s Moving Average Convergence Divergence (MACD) line has crossed below the zero line, which implies the broader trend is bearish. However, with the signal line positioned above the zero line, the momentum is trying to shift upward
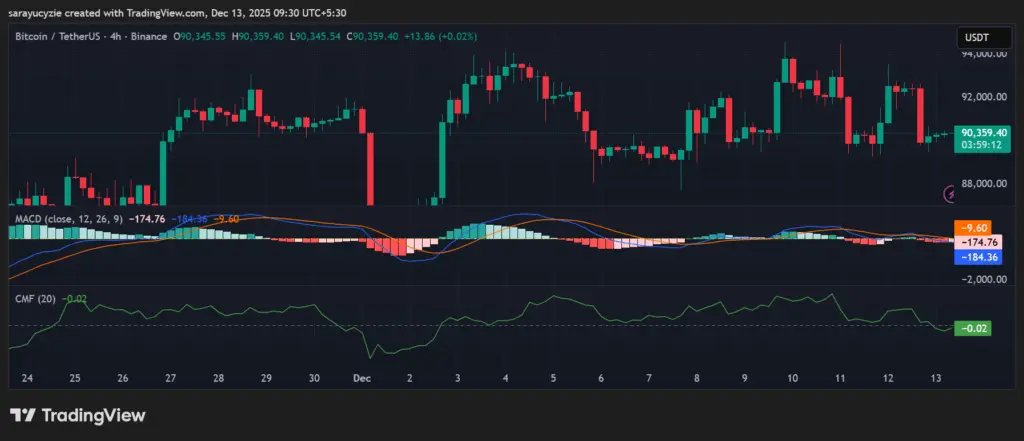 *BTC chart (Source: TradingView)*Moreover, the Chaikin Money Flow (CMF) indicator of BTC at -0.02 hints at weak selling pressure. The value is slightly below zero, showing the outflow of money, reflecting indecision, with neither buyers nor sellers in firm control.
If Bitcoin’s bearish command strengthens, it might push the price down to test its support at around $90,248. Further correction on the downside could trigger the death cross emergence, likely sending the asset’s price below the $90,113 range
Assuming the asset’s price got charted in green, the nearby resistance would be hit at the $90,451 level. An extended bullish pressure might initiate the golden cross to take action, and drive the Bitcoin price up to revisit its recent high above $90,579
Furthermore, Bitcoin’s daily Relative Strength Index (RSI) found at 45.45 indicates a neutral to slightly bearish sentiment. Notably, the current market momentum holds with no strong trend confirmed. BTC’s Bull Bear Power (BBP) value of -1,171.64 suggests strong bearish dominance. A deep negative value puts the sellers firmly in control, and the downtrend may continue unless the buyers step in.
Top Updated Crypto News
Fartcoin Gasps Higher: Will the 12% Rally Push for the Next Wave Upward?
Disclaimer: The information on this page may come from third parties and does not represent the views or opinions of Gate. The content displayed on this page is for reference only and does not constitute any financial, investment, or legal advice. Gate does not guarantee the accuracy or completeness of the information and shall not be liable for any losses arising from the use of this information. Virtual asset investments carry high risks and are subject to significant price volatility. You may lose all of your invested principal. Please fully understand the relevant risks and make prudent decisions based on your own financial situation and risk tolerance. For details, please refer to
Disclaimer.
Related Articles
BTC 15-minute rise of 0.60%: ETF capital inflows and technical breakout resonance drive short-term momentum
2026-03-13 12:45 to 2026-03-13 13:00 (UTC), BTC achieved a +0.60% return within 15 minutes, with a price range of 72341.6-72888.0 USDT and a volatility amplitude of 0.76%. Short-term price oscillations noticeably intensified. Due to abundant trading volume, market attention rose rapidly, reflecting a phase of strengthened buying power.
The primary drivers of this movement are continuous net inflows into ETFs and a technical breakout of key structures. In March 2026, BTC spot ETFs attracted capital inflows as high as 1.6 billion dollars in a single week.
GateNews6m ago
"Seeking a Sword by Marking a Boat" - Style Coin Price Predictions Go Viral: The Practical Logic and Flaws of Mystical Prophecies
Author: Frank, PANews
Whenever the market enters a confusing phase of going nowhere, people try to use a "cutting the boat to seek the sword" method of historical retrospection to predict the next market movement. In such cases, people often see from these theories and charts that history always repeats itself, and seem to automatically overlay and verify future price movements with a certain period in the past.
This coincidence seems to have a magical effect and is often verified. Some bloggers claim this prediction method has an accuracy rate of 75%~80%.
Does this "cutting the boat to seek the sword" style price prediction that repeatedly goes viral on social media help the market identify stages, or is it just packaging noise as prophecy?
From "Tick Fractals" to "History Rhyming"
The peak operation regarding predictions of October 2025 market tops is an analyst named CryptoBullet, who created a method called "ti
区块客14m ago
Win 3 Free GA Passes to Bitcoin 2026 in Las Vegas With CryptoBreaking
CryptoBreaking is excited to announce a brand-new giveaway for our community in partnership with The Bitcoin Conference.
We are giving away 3 free General Admission passes to Bitcoin 2026, taking place at The Venetian in Las Vegas from April 27 to April 29, 2026.
This is your chance to be part
CryptoBreaking34m ago
A certain whale accumulated 2003 BTC from a certain CEX within 10 days, worth $140 million.
Gate News: On March 13, according to on-chain analyst Ember's monitoring, 2 hours ago, a certain whale continued to withdraw 283 BTC from a CEX, valued at $20.52 million. Over the past 10 days, this whale has accumulated a total of 2003.2 BTC through this exchange, valued at $140 million, at an average price of $69923.
GateNews38m ago